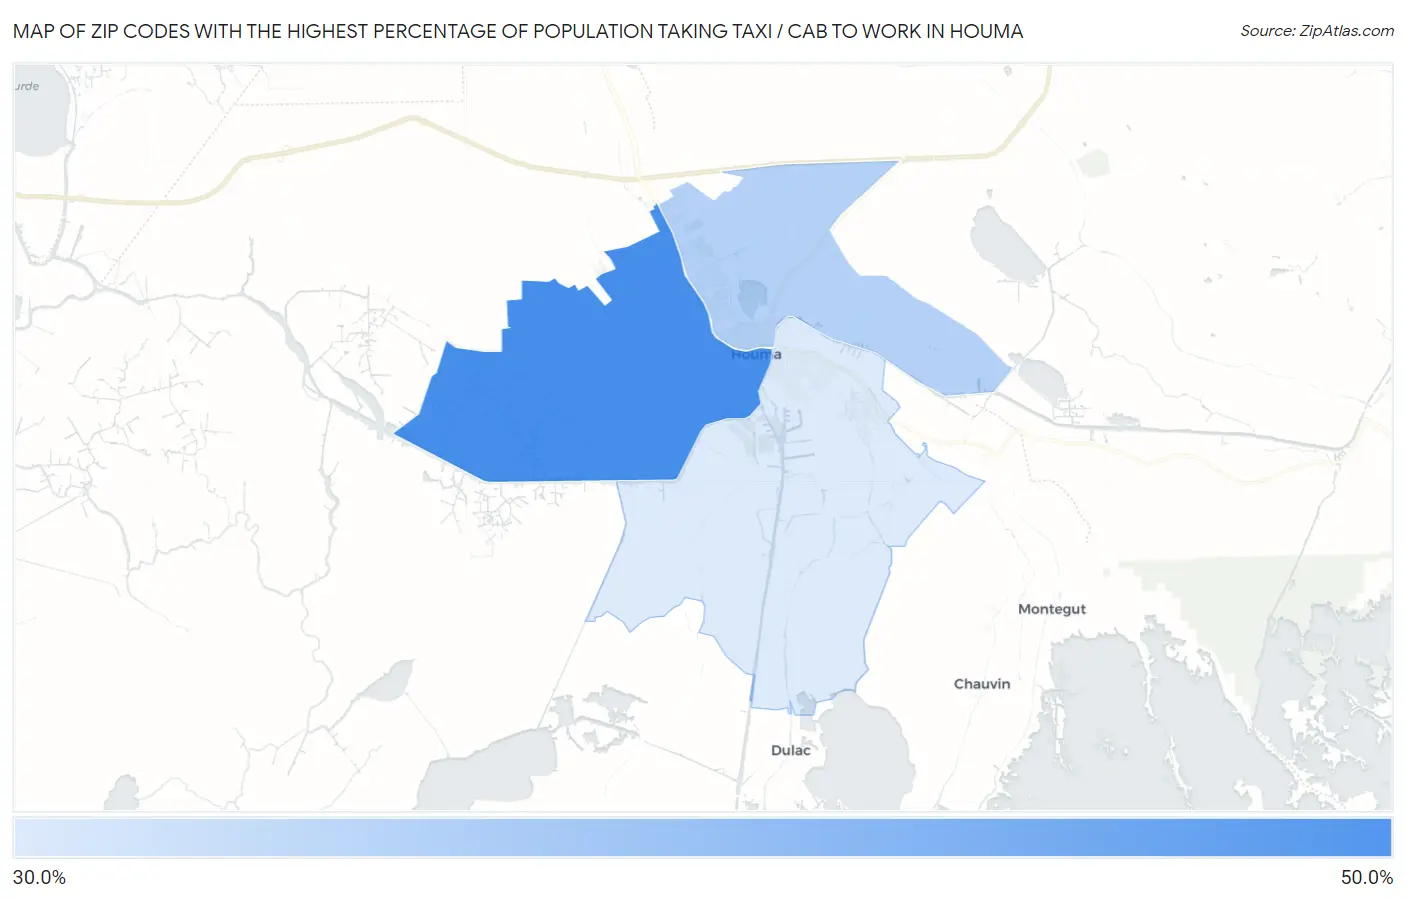
Zip Codes with the Highest Percentage of Population Taking Taxi / Cab to Work in Houma, LA
RELATED REPORTS & OPTIONS
Taxi / Cab
Houma
Compare Zip Codes
Map of Zip Codes with the Highest Percentage of Population Taking Taxi / Cab to Work in Houma
31.8%
45.3%
Zip Codes with the Highest Percentage of Population Taking Taxi / Cab to Work in Houma, LA
| Zip Code | % Take Taxi / Cab | vs State | vs National | |
| 1. | 70360 | 45.3% | 38.2%(+7.10)#57 | 38.2%(+7.10)#4,542 |
| 2. | 70364 | 35.5% | 38.2%(-2.70)#130 | 38.2%(-2.70)#8,663 |
| 3. | 70363 | 31.8% | 38.2%(-6.40)#163 | 38.2%(-6.40)#10,243 |
1
Common Questions
What are the Top Zip Codes with the Highest Percentage of Population Taking Taxi / Cab to Work in Houma, LA?
Top Zip Codes with the Highest Percentage of Population Taking Taxi / Cab to Work in Houma, LA are:
What zip code has the Highest Percentage of Population Taking Taxi / Cab to Work in Houma, LA?
70360 has the Highest Percentage of Population Taking Taxi / Cab to Work in Houma, LA with 45.3%.
What is the Percentage of Population Taking Taxi / Cab to Work in Houma, LA?
Percentage of Population Taking Taxi / Cab to Work in Houma is 35.7%.
What is the Percentage of Population Taking Taxi / Cab to Work in Louisiana?
Percentage of Population Taking Taxi / Cab to Work in Louisiana is 38.2%.
What is the Percentage of Population Taking Taxi / Cab to Work in the United States?
Percentage of Population Taking Taxi / Cab to Work in the United States is 38.2%.