Whitley City, KY Map & Demographics
Whitley City Map
Whitley City Overview
$12,632
PER CAPITA INCOME
$22,702
AVG HOUSEHOLD INCOME
$14,390
FAMILY INCOME DEFICIT
0.47
INEQUALITY / GINI INDEX
1,148
TOTAL POPULATION
664
MALE POPULATION
484
FEMALE POPULATION
137.19
MALES / 100 FEMALES
72.89
FEMALES / 100 MALES
37.9
MEDIAN AGE
4.7
AVG FAMILY SIZE
2.7
AVG HOUSEHOLD SIZE
284
LABOR FORCE [ PEOPLE ]
33.1%
PERCENT IN LABOR FORCE
Whitley City Zip Codes
Whitley City Area Codes
Income in Whitley City
Income Overview in Whitley City
| Characteristic | Number | Measure |
| Per Capita Income | 1,148 | $12,632 |
| Median Family Income | 148 | $0 |
| Mean Family Income | 148 | $43,266 |
| Median Household Income | 405 | $22,702 |
| Mean Household Income | 405 | $31,799 |
| Income Deficit | 148 | $14,390 |
| Wage / Income Gap (%) | 1,148 | 0.00% |
| Wage / Income Gap ($) | 1,148 | 100.00¢ per $1 |
| Gini / Inequality Index | 1,148 | 0.47 |
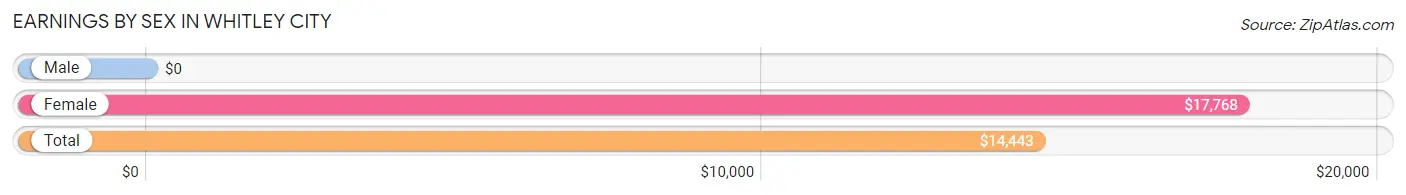
Earnings by Sex in Whitley City
| Sex | Number | Average Earnings |
| Male | 302 (79.7%) | $0 |
| Female | 77 (20.3%) | $17,768 |
| Total | 379 (100.0%) | $14,443 |
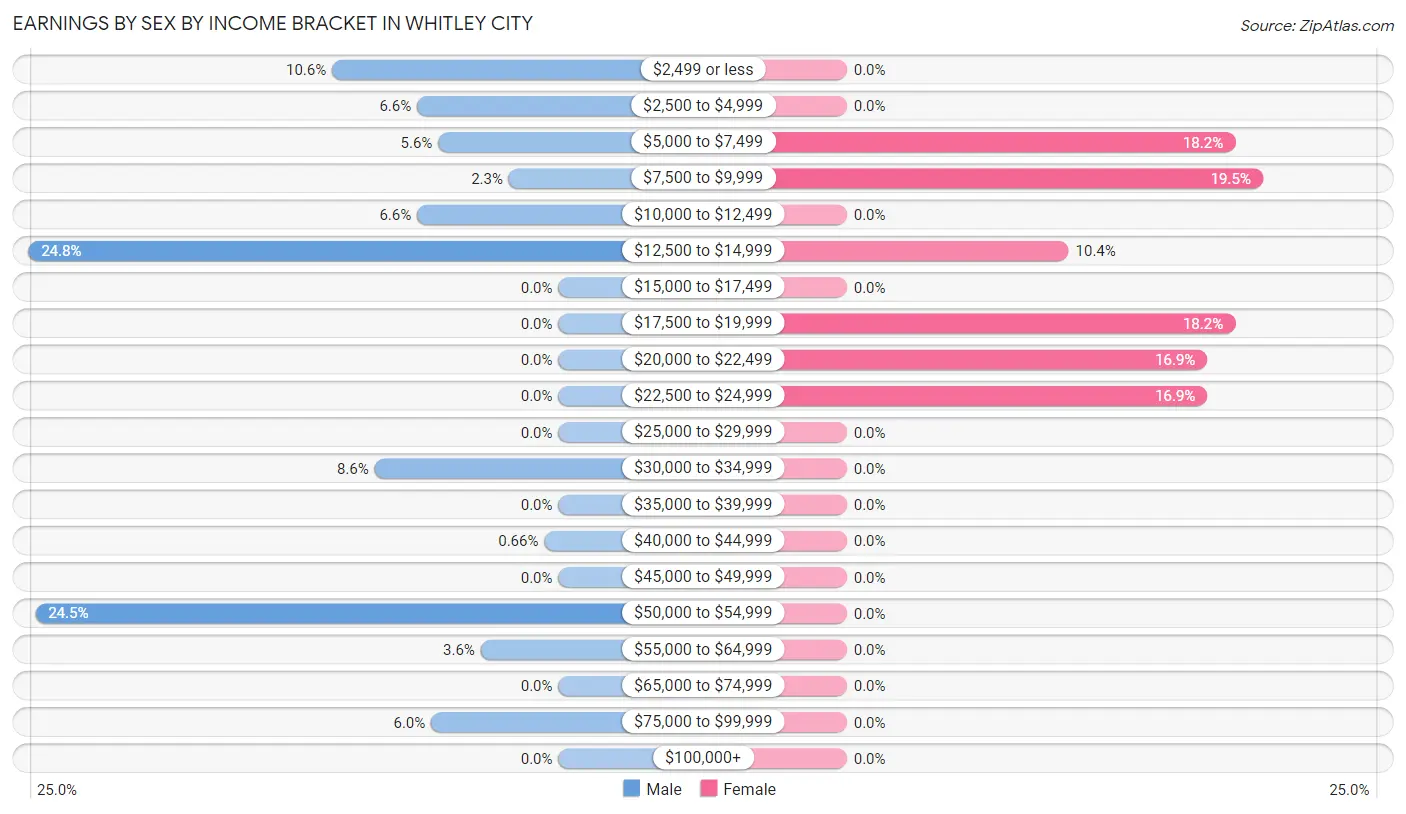
Earnings by Sex by Income Bracket in Whitley City
The most common earnings brackets in Whitley City are $12,500 to $14,999 for men (75 | 24.8%) and $7,500 to $9,999 for women (15 | 19.5%).
| Income | Male | Female |
| $2,499 or less | 32 (10.6%) | 0 (0.0%) |
| $2,500 to $4,999 | 20 (6.6%) | 0 (0.0%) |
| $5,000 to $7,499 | 17 (5.6%) | 14 (18.2%) |
| $7,500 to $9,999 | 7 (2.3%) | 15 (19.5%) |
| $10,000 to $12,499 | 20 (6.6%) | 0 (0.0%) |
| $12,500 to $14,999 | 75 (24.8%) | 8 (10.4%) |
| $15,000 to $17,499 | 0 (0.0%) | 0 (0.0%) |
| $17,500 to $19,999 | 0 (0.0%) | 14 (18.2%) |
| $20,000 to $22,499 | 0 (0.0%) | 13 (16.9%) |
| $22,500 to $24,999 | 0 (0.0%) | 13 (16.9%) |
| $25,000 to $29,999 | 0 (0.0%) | 0 (0.0%) |
| $30,000 to $34,999 | 26 (8.6%) | 0 (0.0%) |
| $35,000 to $39,999 | 0 (0.0%) | 0 (0.0%) |
| $40,000 to $44,999 | 2 (0.7%) | 0 (0.0%) |
| $45,000 to $49,999 | 0 (0.0%) | 0 (0.0%) |
| $50,000 to $54,999 | 74 (24.5%) | 0 (0.0%) |
| $55,000 to $64,999 | 11 (3.6%) | 0 (0.0%) |
| $65,000 to $74,999 | 0 (0.0%) | 0 (0.0%) |
| $75,000 to $99,999 | 18 (6.0%) | 0 (0.0%) |
| $100,000+ | 0 (0.0%) | 0 (0.0%) |
| Total | 302 (100.0%) | 77 (100.0%) |
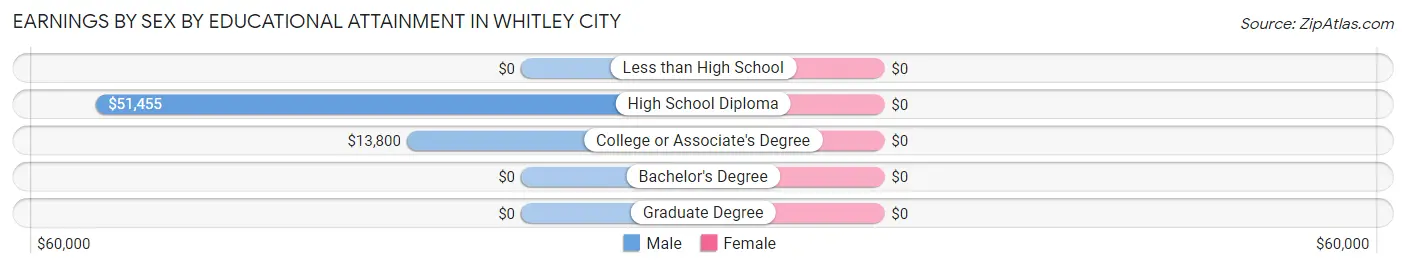
Earnings by Sex by Educational Attainment in Whitley City
| Educational Attainment | Male Income | Female Income |
| Less than High School | - | - |
| High School Diploma | $51,455 | $0 |
| College or Associate's Degree | $13,800 | $0 |
| Bachelor's Degree | - | - |
| Graduate Degree | - | - |
| Total | - | - |
Family Income in Whitley City
Family Income Brackets in Whitley City
According to the Whitley City family income data, there are 43 families falling into the $50,000 to $74,999 income range, which is the most common income bracket and makes up 29.0% of all families.
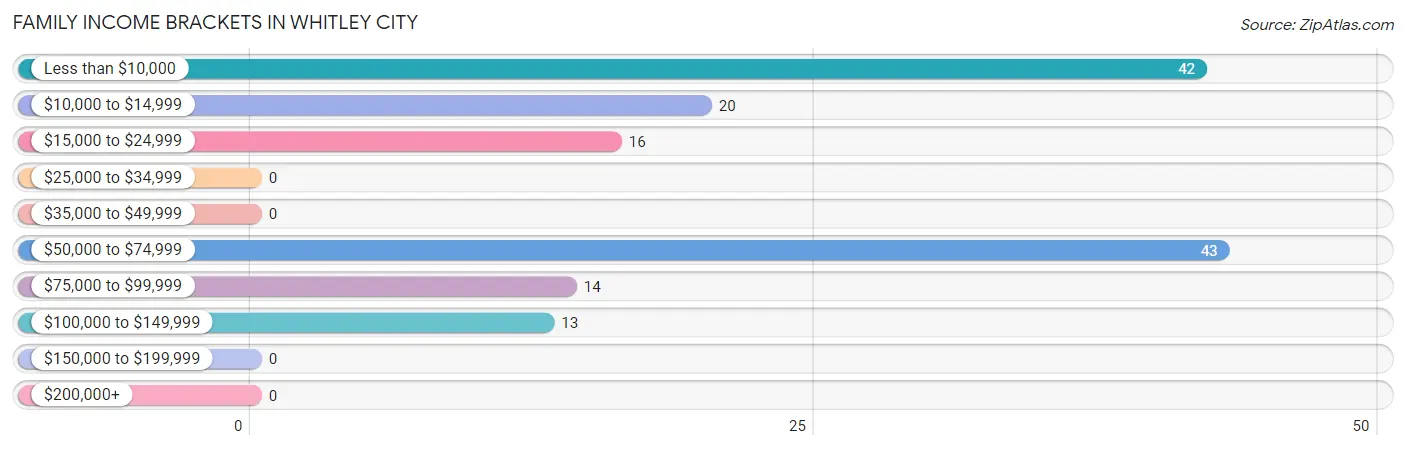
| Income Bracket | # Families | % Families |
| Less than $10,000 | 42 | 28.4% |
| $10,000 to $14,999 | 20 | 13.5% |
| $15,000 to $24,999 | 16 | 10.8% |
| $25,000 to $34,999 | 0 | 0.0% |
| $35,000 to $49,999 | 0 | 0.0% |
| $50,000 to $74,999 | 43 | 29.1% |
| $75,000 to $99,999 | 14 | 9.5% |
| $100,000 to $149,999 | 13 | 8.8% |
| $150,000 to $199,999 | 0 | 0.0% |
| $200,000+ | 0 | 0.0% |
Family Income by Famaliy Size in Whitley City
2-person families (43 | 29.0%) account for the highest median family income in Whitley City with $66,118 per family, while 2-person families (43 | 29.0%) have the highest median income of $33,059 per family member.
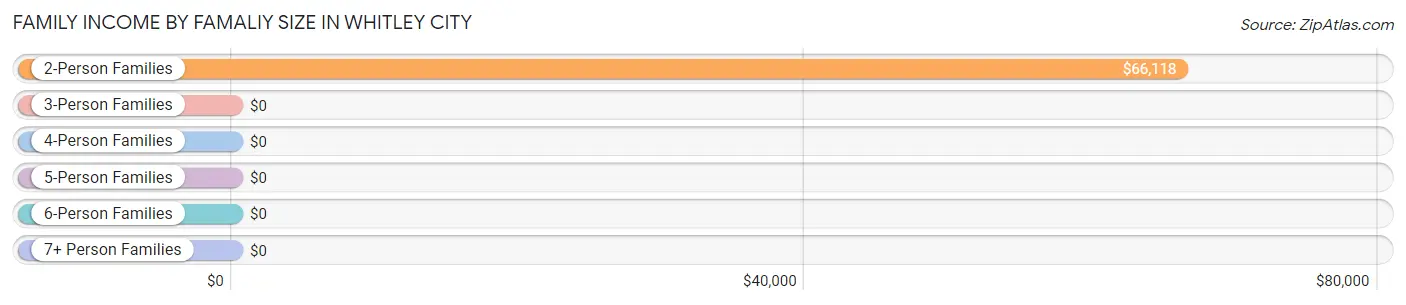
| Income Bracket | # Families | Median Income |
| 2-Person Families | 43 (29.0%) | $66,118 |
| 3-Person Families | 36 (24.3%) | $0 |
| 4-Person Families | 50 (33.8%) | $0 |
| 5-Person Families | 5 (3.4%) | $0 |
| 6-Person Families | 0 (0.0%) | $0 |
| 7+ Person Families | 14 (9.5%) | $0 |
| Total | 148 (100.0%) | $0 |
Family Income by Number of Earners in Whitley City
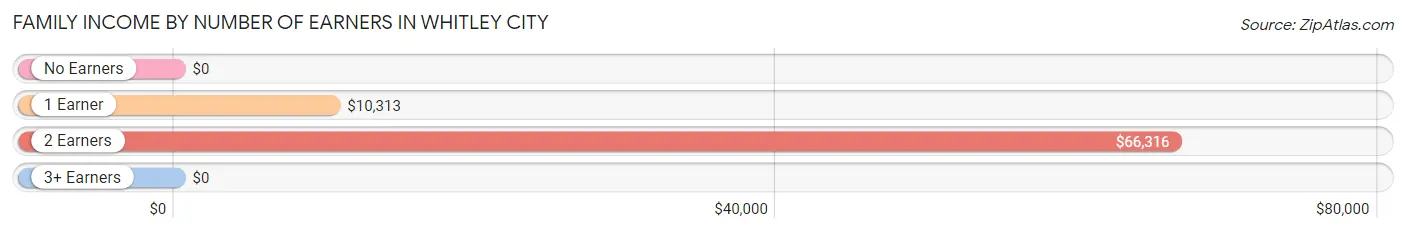
| Number of Earners | # Families | Median Income |
| No Earners | 32 (21.6%) | $0 |
| 1 Earner | 57 (38.5%) | $10,313 |
| 2 Earners | 46 (31.1%) | $66,316 |
| 3+ Earners | 13 (8.8%) | $0 |
| Total | 148 (100.0%) | $0 |
Household Income in Whitley City
Household Income Brackets in Whitley City
With 100 households falling in the category, the $15,000 to $24,999 income range is the most frequent in Whitley City, accounting for 24.7% of all households.
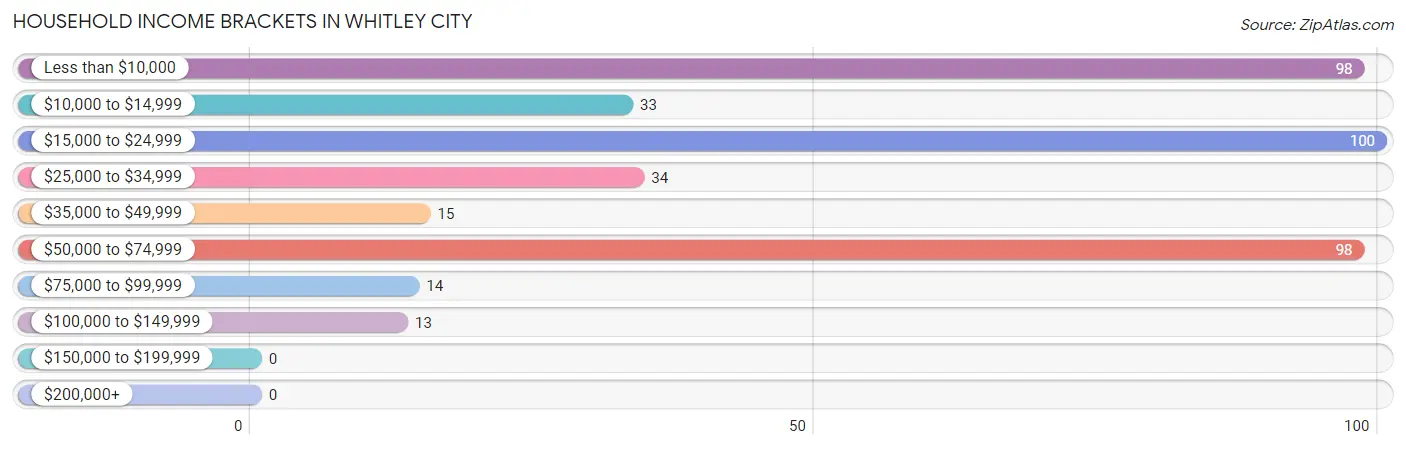
| Income Bracket | # Households | % Households |
| Less than $10,000 | 98 | 24.2% |
| $10,000 to $14,999 | 33 | 8.1% |
| $15,000 to $24,999 | 100 | 24.7% |
| $25,000 to $34,999 | 34 | 8.4% |
| $35,000 to $49,999 | 15 | 3.7% |
| $50,000 to $74,999 | 98 | 24.2% |
| $75,000 to $99,999 | 14 | 3.5% |
| $100,000 to $149,999 | 13 | 3.2% |
| $150,000 to $199,999 | 0 | 0.0% |
| $200,000+ | 0 | 0.0% |
Household Income by Householder Age in Whitley City
The median household income in Whitley City is $22,702, with the highest median household income of $50,227 found in the 45 to 64 years age bracket for the primary householder. A total of 148 households (36.5%) fall into this category. Meanwhile, the 15 to 24 years age bracket for the primary householder has the lowest median household income of $0, with 11 households (2.7%) in this group.
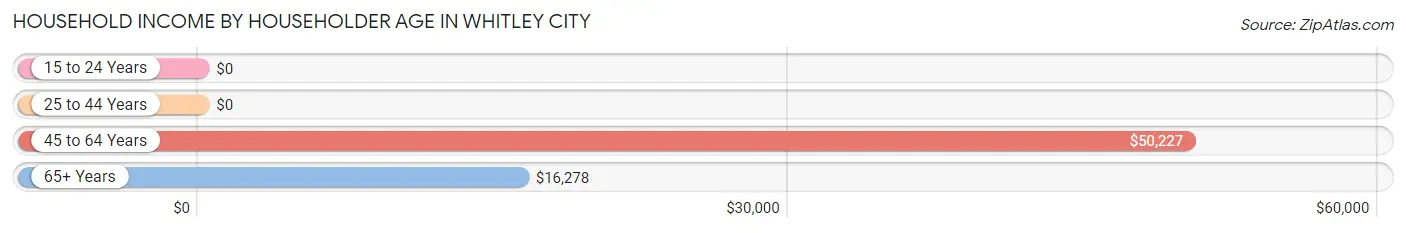
| Income Bracket | # Households | Median Income |
| 15 to 24 Years | 11 (2.7%) | $0 |
| 25 to 44 Years | 86 (21.2%) | $0 |
| 45 to 64 Years | 148 (36.5%) | $50,227 |
| 65+ Years | 160 (39.5%) | $16,278 |
| Total | 405 (100.0%) | $22,702 |
Poverty in Whitley City
Income Below Poverty by Sex and Age in Whitley City
With 42.9% poverty level for males and 54.7% for females among the residents of Whitley City, 6 to 11 year old males and 12 to 14 year old females are the most vulnerable to poverty, with 36 males (100.0%) and 6 females (100.0%) in their respective age groups living below the poverty level.
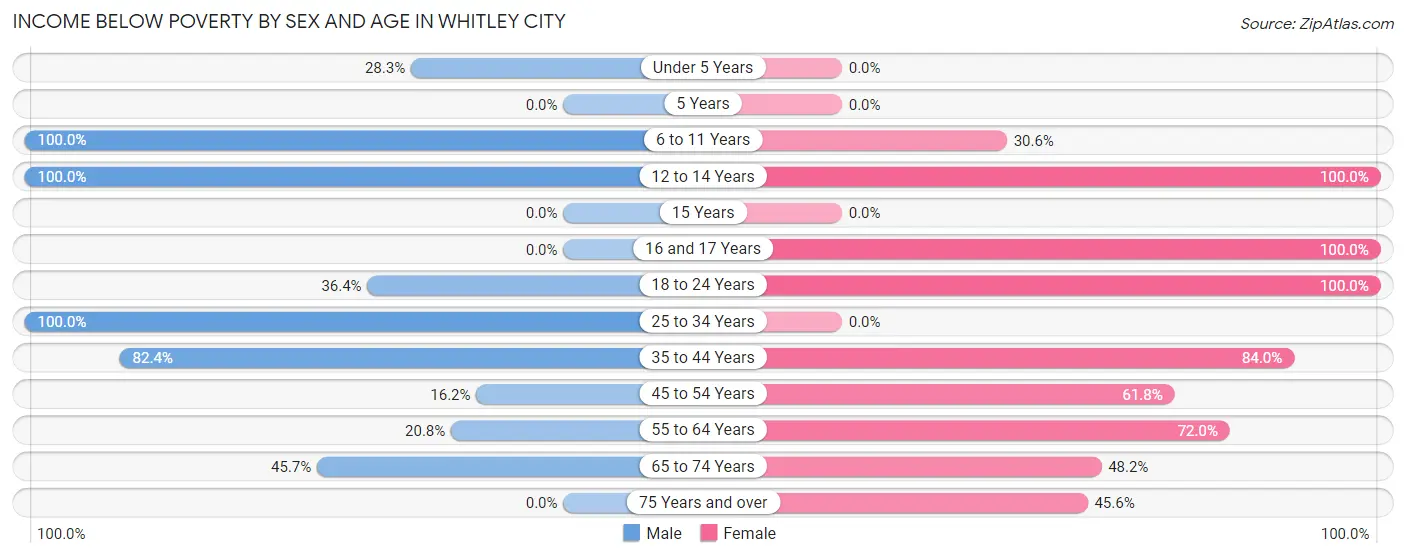
| Age Bracket | Male | Female |
| Under 5 Years | 28 (28.3%) | 0 (0.0%) |
| 5 Years | 0 (0.0%) | 0 (0.0%) |
| 6 to 11 Years | 36 (100.0%) | 15 (30.6%) |
| 12 to 14 Years | 8 (100.0%) | 6 (100.0%) |
| 15 Years | 0 (0.0%) | 0 (0.0%) |
| 16 and 17 Years | 0 (0.0%) | 7 (100.0%) |
| 18 to 24 Years | 20 (36.4%) | 42 (100.0%) |
| 25 to 34 Years | 92 (100.0%) | 0 (0.0%) |
| 35 to 44 Years | 28 (82.4%) | 68 (84.0%) |
| 45 to 54 Years | 26 (16.2%) | 21 (61.8%) |
| 55 to 64 Years | 5 (20.8%) | 36 (72.0%) |
| 65 to 74 Years | 16 (45.7%) | 13 (48.1%) |
| 75 Years and over | 0 (0.0%) | 57 (45.6%) |
| Total | 259 (42.9%) | 265 (54.7%) |
Income Above Poverty by Sex and Age in Whitley City
According to the poverty statistics in Whitley City, males aged 5 years and females aged under 5 years are the age groups that are most secure financially, with 100.0% of males and 100.0% of females in these age groups living above the poverty line.
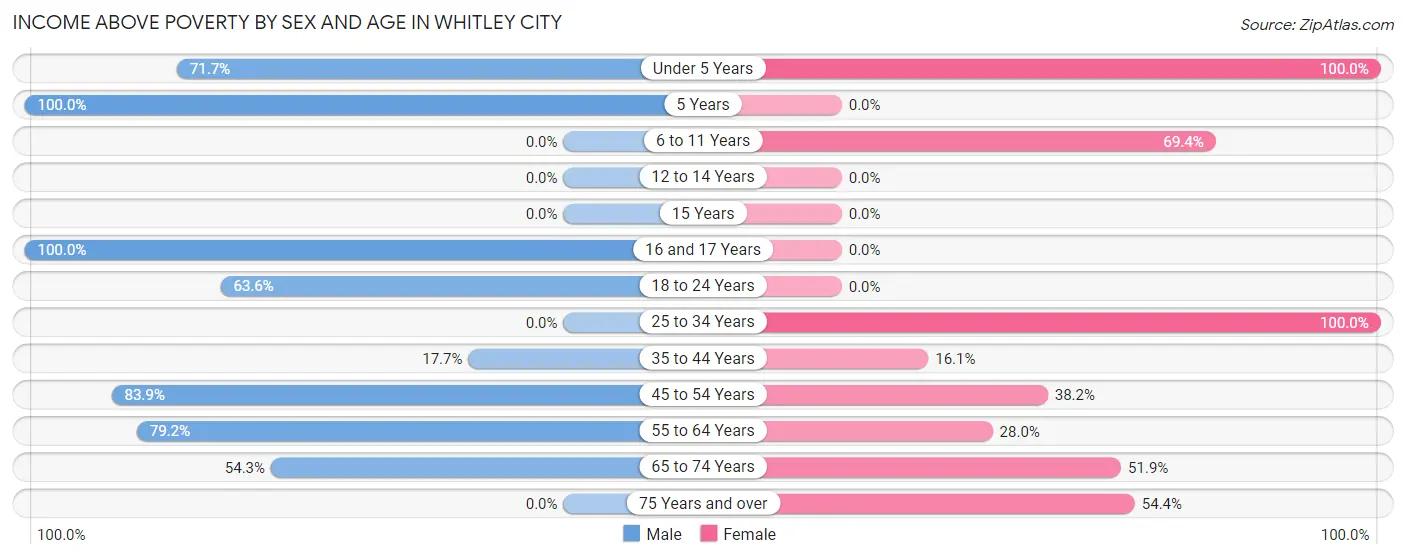
| Age Bracket | Male | Female |
| Under 5 Years | 71 (71.7%) | 49 (100.0%) |
| 5 Years | 42 (100.0%) | 0 (0.0%) |
| 6 to 11 Years | 0 (0.0%) | 34 (69.4%) |
| 12 to 14 Years | 0 (0.0%) | 0 (0.0%) |
| 15 Years | 0 (0.0%) | 0 (0.0%) |
| 16 and 17 Years | 17 (100.0%) | 0 (0.0%) |
| 18 to 24 Years | 35 (63.6%) | 0 (0.0%) |
| 25 to 34 Years | 0 (0.0%) | 14 (100.0%) |
| 35 to 44 Years | 6 (17.6%) | 13 (16.1%) |
| 45 to 54 Years | 135 (83.9%) | 13 (38.2%) |
| 55 to 64 Years | 19 (79.2%) | 14 (28.0%) |
| 65 to 74 Years | 19 (54.3%) | 14 (51.8%) |
| 75 Years and over | 0 (0.0%) | 68 (54.4%) |
| Total | 344 (57.1%) | 219 (45.3%) |
Income Below Poverty Among Married-Couple Families in Whitley City
The poverty statistics for married-couple families in Whitley City show that 57.8% or 78 of the total 135 families live below the poverty line. Families with 3 or 4 children have the highest poverty rate of 100.0%, comprising of 5 families. On the other hand, families with 5 or more children have the lowest poverty rate of 0.0%, which includes 0 families.
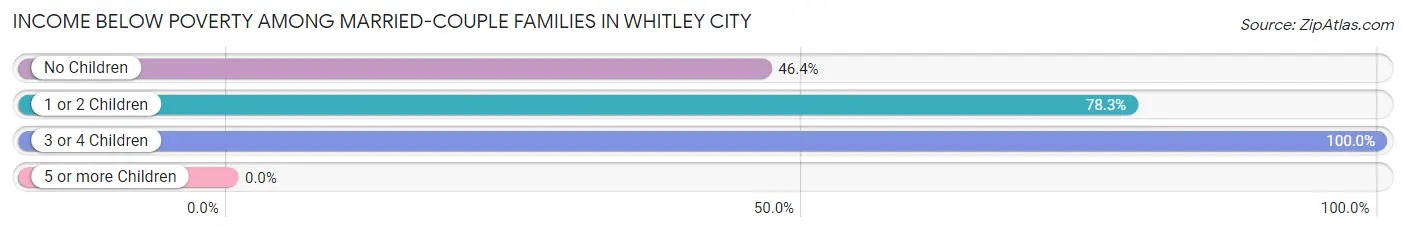
| Children | Above Poverty | Below Poverty |
| No Children | 30 (53.6%) | 26 (46.4%) |
| 1 or 2 Children | 13 (21.7%) | 47 (78.3%) |
| 3 or 4 Children | 0 (0.0%) | 5 (100.0%) |
| 5 or more Children | 14 (100.0%) | 0 (0.0%) |
| Total | 57 (42.2%) | 78 (57.8%) |
Income Below Poverty Among Single-Parent Households in Whitley City
| Children | Single Father | Single Mother |
| No Children | 0 (0.0%) | 0 (0.0%) |
| 1 or 2 Children | 0 (0.0%) | 0 (0.0%) |
| 3 or 4 Children | 0 (0.0%) | 0 (0.0%) |
| 5 or more Children | 0 (0.0%) | 0 (0.0%) |
| Total | 0 (0.0%) | 0 (0.0%) |
Income Below Poverty Among Married-Couple vs Single-Parent Households in Whitley City
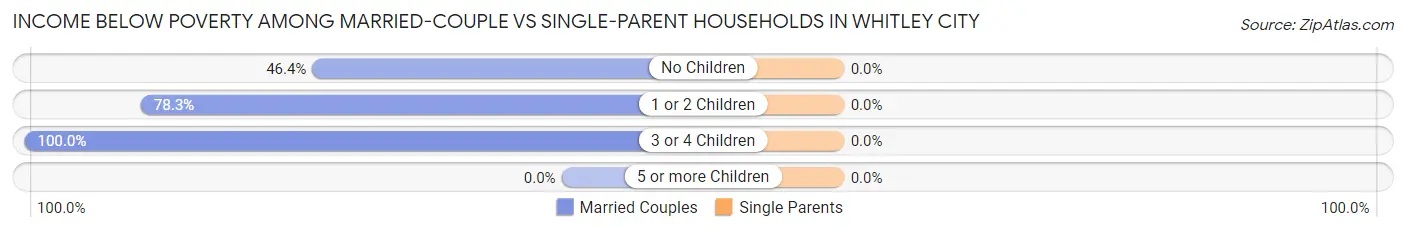
| Children | Married-Couple Families | Single-Parent Households |
| No Children | 26 (46.4%) | 0 (0.0%) |
| 1 or 2 Children | 47 (78.3%) | 0 (0.0%) |
| 3 or 4 Children | 5 (100.0%) | 0 (0.0%) |
| 5 or more Children | 0 (0.0%) | 0 (0.0%) |
| Total | 78 (57.8%) | 0 (0.0%) |
Race in Whitley City
The most populous races in Whitley City are White / Caucasian (1,042 | 90.8%), Two or more Races (56 | 4.9%), and Black / African American (38 | 3.3%).
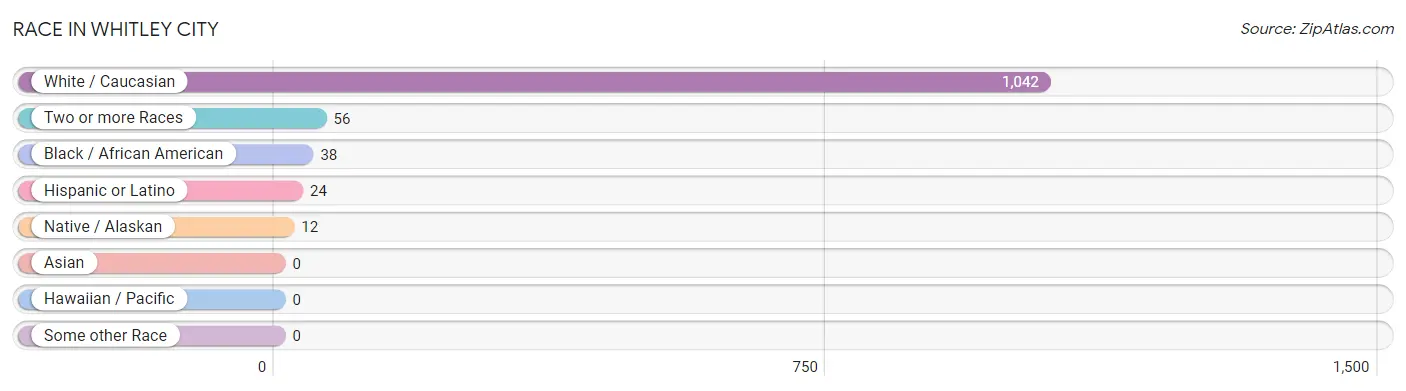
| Race | # Population | % Population |
| Asian | 0 | 0.0% |
| Black / African American | 38 | 3.3% |
| Hawaiian / Pacific | 0 | 0.0% |
| Hispanic or Latino | 24 | 2.1% |
| Native / Alaskan | 12 | 1.1% |
| White / Caucasian | 1,042 | 90.8% |
| Two or more Races | 56 | 4.9% |
| Some other Race | 0 | 0.0% |
| Total | 1,148 | 100.0% |
Ancestry in Whitley City
The most populous ancestries reported in Whitley City are American (112 | 9.8%), Scottish (91 | 7.9%), Irish (67 | 5.8%), English (60 | 5.2%), and Scandinavian (48 | 4.2%), together accounting for 32.9% of all Whitley City residents.
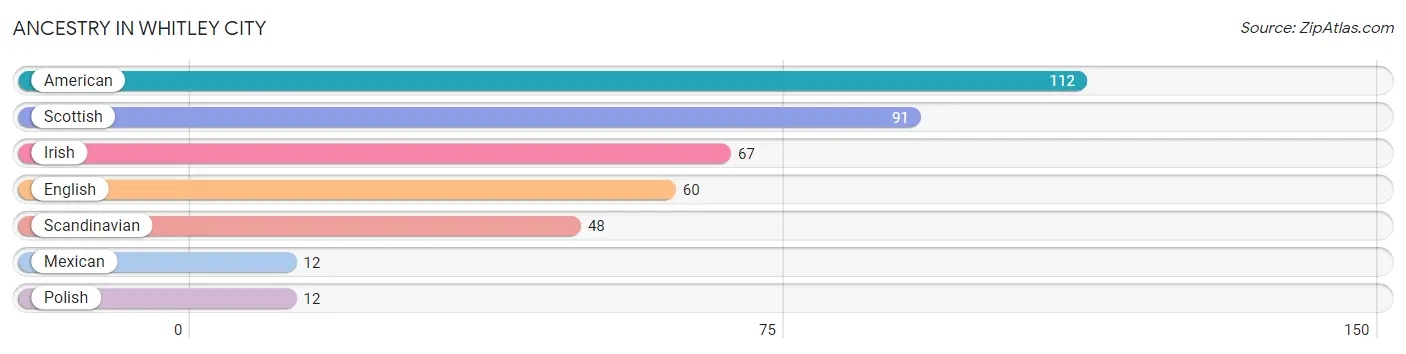
| Ancestry | # Population | % Population |
| American | 112 | 9.8% |
| English | 60 | 5.2% |
| Irish | 67 | 5.8% |
| Mexican | 12 | 1.1% |
| Polish | 12 | 1.1% |
| Scandinavian | 48 | 4.2% |
| Scottish | 91 | 7.9% | View All 7 Rows |
Immigrants in Whitley City
The most numerous immigrant groups reported in Whitley City came from Central America (6 | 0.5%), Honduras (6 | 0.5%), and Latin America (6 | 0.5%), together accounting for 1.6% of all Whitley City residents.
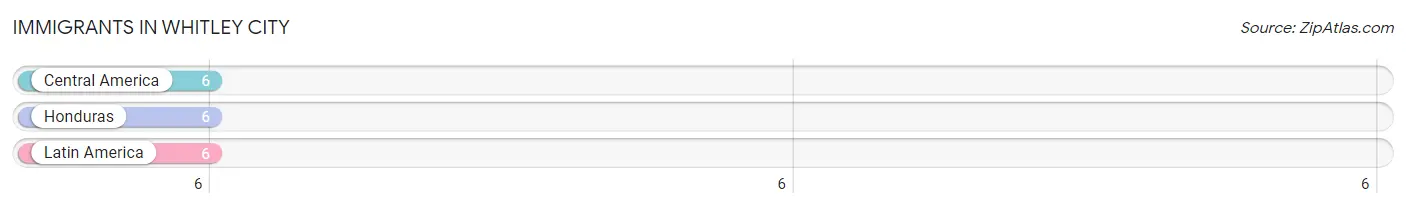
| Immigration Origin | # Population | % Population |
| Central America | 6 | 0.5% |
| Honduras | 6 | 0.5% |
| Latin America | 6 | 0.5% | View All 3 Rows |
Sex and Age in Whitley City
Sex and Age in Whitley City
The most populous age groups in Whitley City are 45 to 49 Years (131 | 19.7%) for men and 75 to 79 Years (112 | 23.1%) for women.
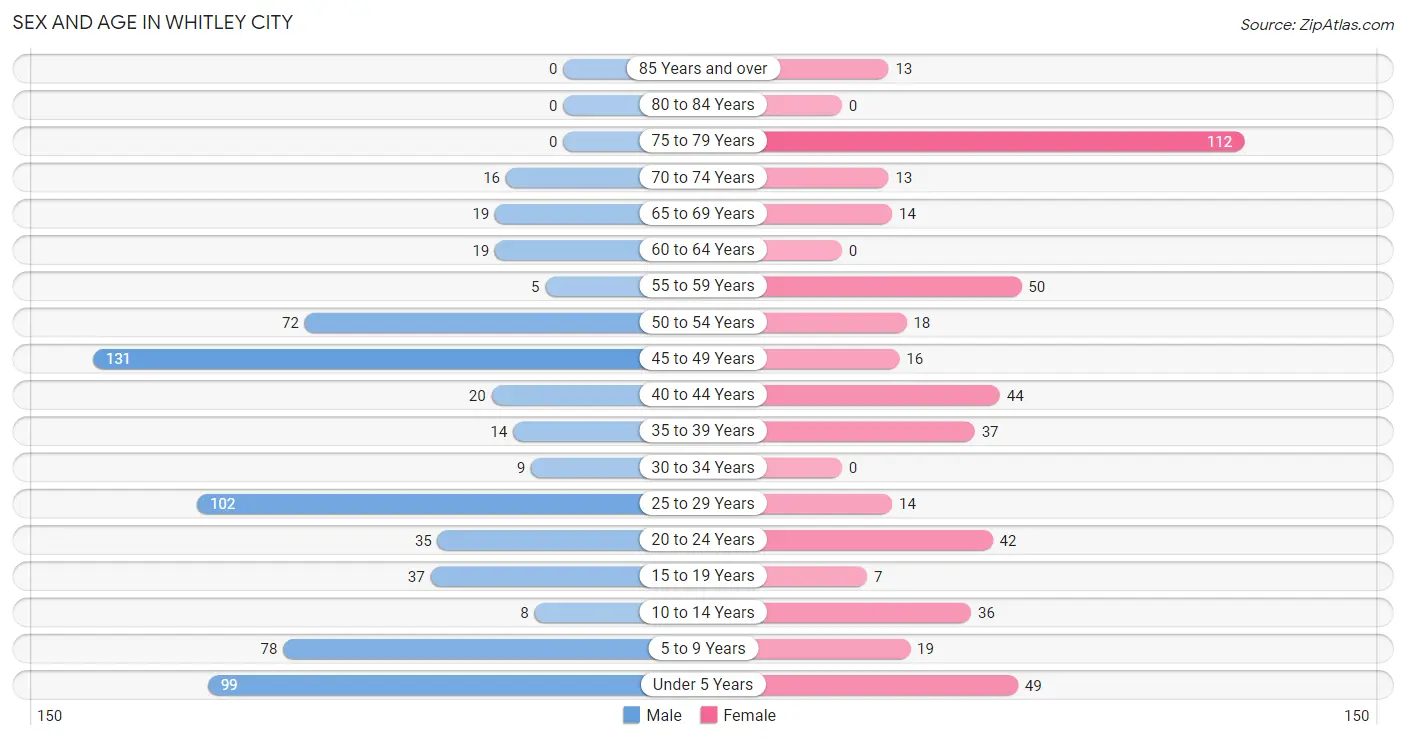
| Age Bracket | Male | Female |
| Under 5 Years | 99 (14.9%) | 49 (10.1%) |
| 5 to 9 Years | 78 (11.7%) | 19 (3.9%) |
| 10 to 14 Years | 8 (1.2%) | 36 (7.4%) |
| 15 to 19 Years | 37 (5.6%) | 7 (1.5%) |
| 20 to 24 Years | 35 (5.3%) | 42 (8.7%) |
| 25 to 29 Years | 102 (15.4%) | 14 (2.9%) |
| 30 to 34 Years | 9 (1.4%) | 0 (0.0%) |
| 35 to 39 Years | 14 (2.1%) | 37 (7.6%) |
| 40 to 44 Years | 20 (3.0%) | 44 (9.1%) |
| 45 to 49 Years | 131 (19.7%) | 16 (3.3%) |
| 50 to 54 Years | 72 (10.8%) | 18 (3.7%) |
| 55 to 59 Years | 5 (0.7%) | 50 (10.3%) |
| 60 to 64 Years | 19 (2.9%) | 0 (0.0%) |
| 65 to 69 Years | 19 (2.9%) | 14 (2.9%) |
| 70 to 74 Years | 16 (2.4%) | 13 (2.7%) |
| 75 to 79 Years | 0 (0.0%) | 112 (23.1%) |
| 80 to 84 Years | 0 (0.0%) | 0 (0.0%) |
| 85 Years and over | 0 (0.0%) | 13 (2.7%) |
| Total | 664 (100.0%) | 484 (100.0%) |
Families and Households in Whitley City
Median Family Size in Whitley City
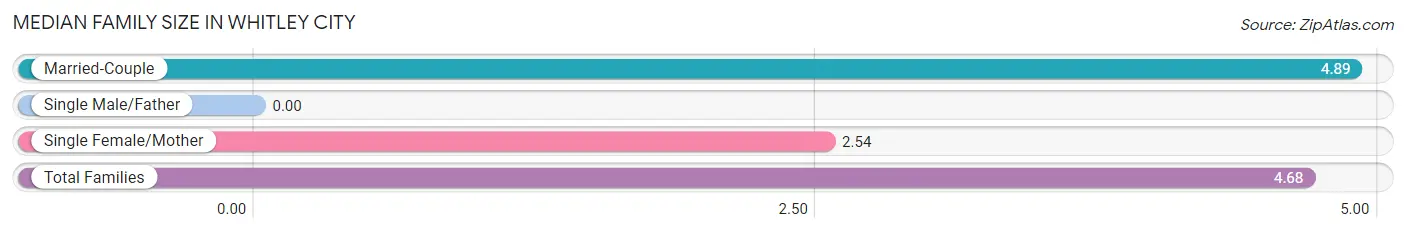
| Family Type | # Families | Family Size |
| Married-Couple | 135 (91.2%) | 4.89 |
| Single Male/Father | 0 (0.0%) | - |
| Single Female/Mother | 13 (8.8%) | 2.54 |
| Total Families | 148 (100.0%) | 4.68 |
Median Household Size in Whitley City
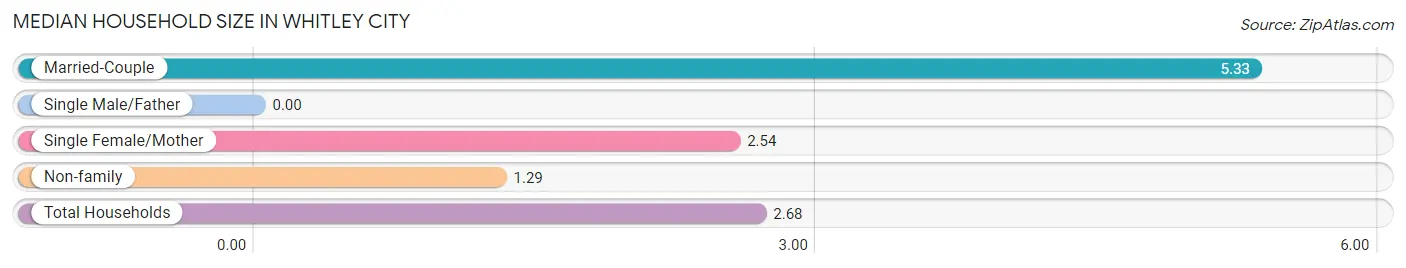
| Household Type | # Households | Household Size |
| Married-Couple | 135 (33.3%) | 5.33 |
| Single Male/Father | 0 (0.0%) | - |
| Single Female/Mother | 13 (3.2%) | 2.54 |
| Non-family | 257 (63.5%) | 1.29 |
| Total Households | 405 (100.0%) | 2.68 |
Household Size by Marriage Status in Whitley City
Out of a total of 405 households in Whitley City, 148 (36.5%) are family households, while 257 (63.5%) are nonfamily households. The most numerous type of family households are 2-person households, comprising 43, and the most common type of nonfamily households are 1-person households, comprising 226.
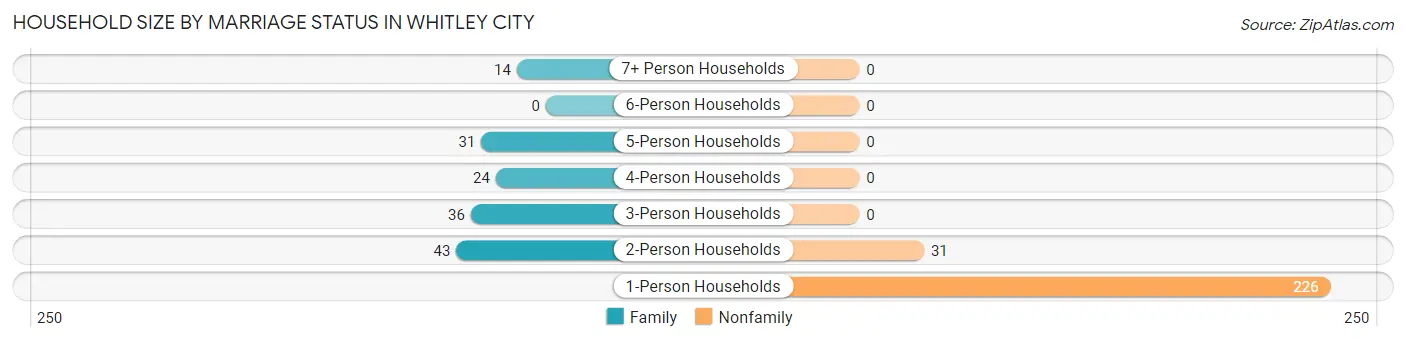
| Household Size | Family Households | Nonfamily Households |
| 1-Person Households | - | 226 (55.8%) |
| 2-Person Households | 43 (10.6%) | 31 (7.6%) |
| 3-Person Households | 36 (8.9%) | 0 (0.0%) |
| 4-Person Households | 24 (5.9%) | 0 (0.0%) |
| 5-Person Households | 31 (7.6%) | 0 (0.0%) |
| 6-Person Households | 0 (0.0%) | 0 (0.0%) |
| 7+ Person Households | 14 (3.5%) | 0 (0.0%) |
| Total | 148 (36.5%) | 257 (63.5%) |
Female Fertility in Whitley City
Fertility by Age in Whitley City
Average fertility rate in Whitley City is 69.0 births per 1,000 women. Women in the age bracket of 20 to 34 years have the highest fertility rate with 196.0 births per 1,000 women. Women in the age bracket of 20 to 34 years acount for 100.0% of all women with births.
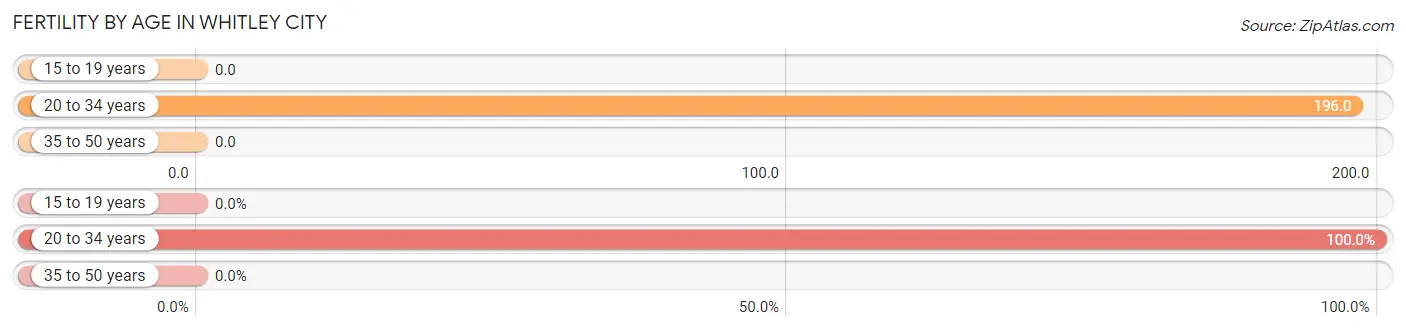
| Age Bracket | Women with Births | Births / 1,000 Women |
| 15 to 19 years | 0 (0.0%) | 0.0 |
| 20 to 34 years | 11 (100.0%) | 196.0 |
| 35 to 50 years | 0 (0.0%) | 0.0 |
| Total | 11 (100.0%) | 69.0 |
Fertility by Age by Marriage Status in Whitley City
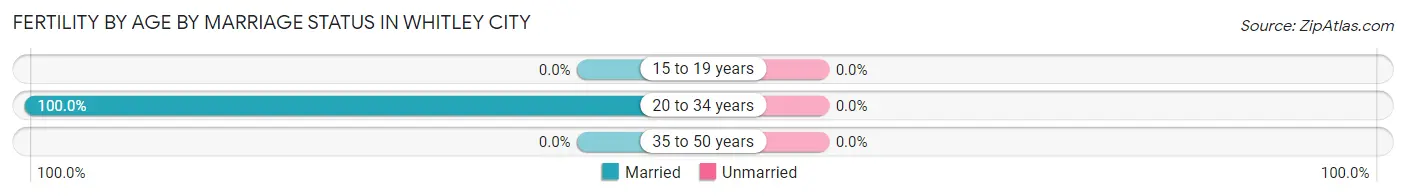
| Age Bracket | Married | Unmarried |
| 15 to 19 years | 0 (0.0%) | 0 (0.0%) |
| 20 to 34 years | 11 (100.0%) | 0 (0.0%) |
| 35 to 50 years | 0 (0.0%) | 0 (0.0%) |
| Total | 11 (100.0%) | 0 (0.0%) |
Fertility by Education in Whitley City
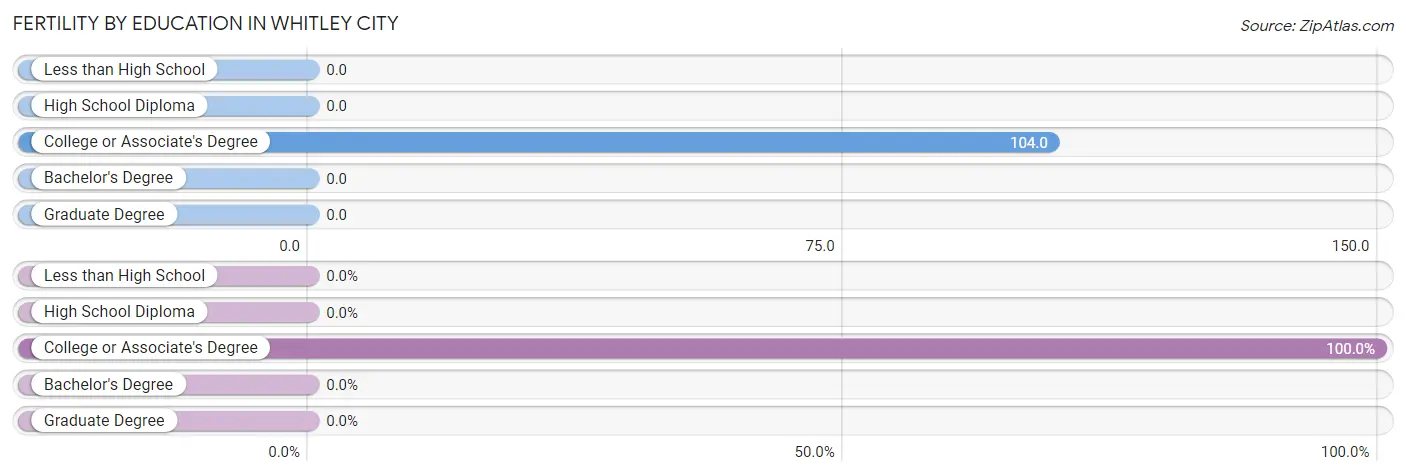
| Educational Attainment | Women with Births | Births / 1,000 Women |
| Less than High School | 0 (0.0%) | 0.0 |
| High School Diploma | 0 (0.0%) | 0.0 |
| College or Associate's Degree | 11 (100.0%) | 104.0 |
| Bachelor's Degree | 0 (0.0%) | 0.0 |
| Graduate Degree | 0 (0.0%) | 0.0 |
| Total | 11 (100.0%) | 69.0 |
Fertility by Education by Marriage Status in Whitley City
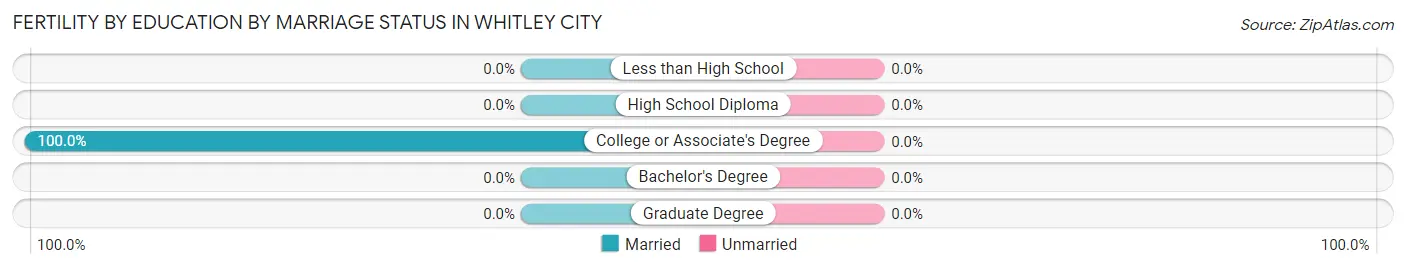
| Educational Attainment | Married | Unmarried |
| Less than High School | 0 (0.0%) | 0 (0.0%) |
| High School Diploma | 0 (0.0%) | 0 (0.0%) |
| College or Associate's Degree | 11 (100.0%) | 0 (0.0%) |
| Bachelor's Degree | 0 (0.0%) | 0 (0.0%) |
| Graduate Degree | 0 (0.0%) | 0 (0.0%) |
| Total | 11 (100.0%) | 0 (0.0%) |
Employment Characteristics in Whitley City
Employment by Class of Employer in Whitley City
Among the 284 employed individuals in Whitley City, private company employees (259 | 91.2%), and federal government employees (25 | 8.8%) make up the most common classes of employment.
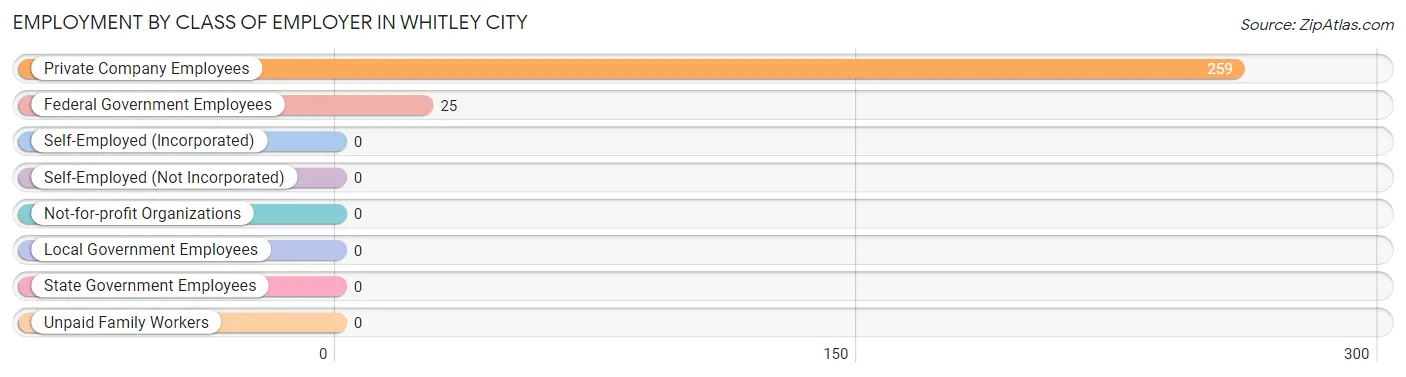
| Employer Class | # Employees | % Employees |
| Private Company Employees | 259 | 91.2% |
| Self-Employed (Incorporated) | 0 | 0.0% |
| Self-Employed (Not Incorporated) | 0 | 0.0% |
| Not-for-profit Organizations | 0 | 0.0% |
| Local Government Employees | 0 | 0.0% |
| State Government Employees | 0 | 0.0% |
| Federal Government Employees | 25 | 8.8% |
| Unpaid Family Workers | 0 | 0.0% |
| Total | 284 | 100.0% |
Employment Status by Age in Whitley City
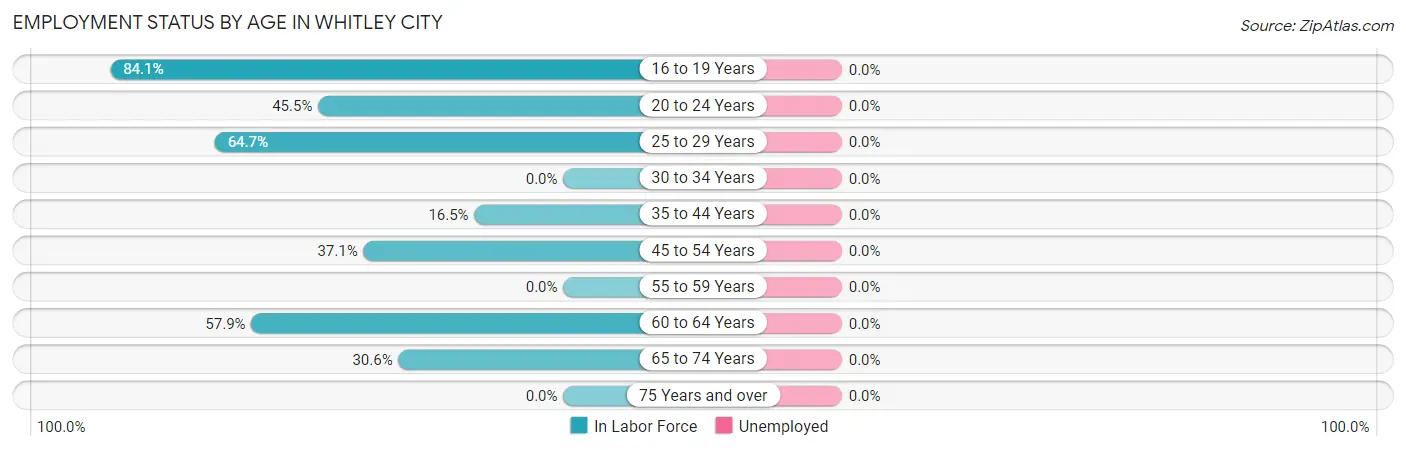
| Age Bracket | In Labor Force | Unemployed |
| 16 to 19 Years | 37 (84.1%) | 0 (0.0%) |
| 20 to 24 Years | 35 (45.5%) | 0 (0.0%) |
| 25 to 29 Years | 75 (64.7%) | 0 (0.0%) |
| 30 to 34 Years | 0 (0.0%) | 0 (0.0%) |
| 35 to 44 Years | 19 (16.5%) | 0 (0.0%) |
| 45 to 54 Years | 88 (37.1%) | 0 (0.0%) |
| 55 to 59 Years | 0 (0.0%) | 0 (0.0%) |
| 60 to 64 Years | 11 (57.9%) | 0 (0.0%) |
| 65 to 74 Years | 19 (30.6%) | 0 (0.0%) |
| 75 Years and over | 0 (0.0%) | 0 (0.0%) |
| Total | 284 (33.1%) | 0 (0.0%) |
Employment Status by Educational Attainment in Whitley City
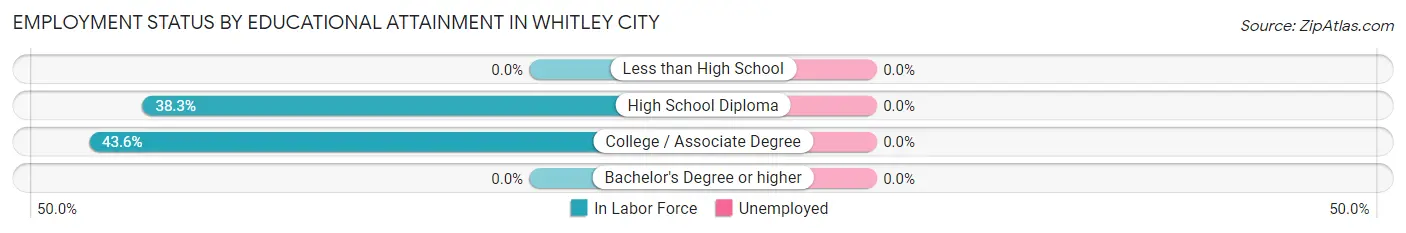
| Educational Attainment | In Labor Force | Unemployed |
| Less than High School | 0 (0.0%) | 0 (0.0%) |
| High School Diploma | 97 (38.3%) | 0 (0.0%) |
| College / Associate Degree | 96 (43.6%) | 0 (0.0%) |
| Bachelor's Degree or higher | 0 (0.0%) | 0 (0.0%) |
| Total | 193 (35.0%) | 0 (0.0%) |
Employment Occupations by Sex in Whitley City
Management, Business, Science and Arts Occupations
The most common Management, Business, Science and Arts occupations in Whitley City are Management (55 | 19.4%), and Health Diagnosing & Treating (13 | 4.6%).
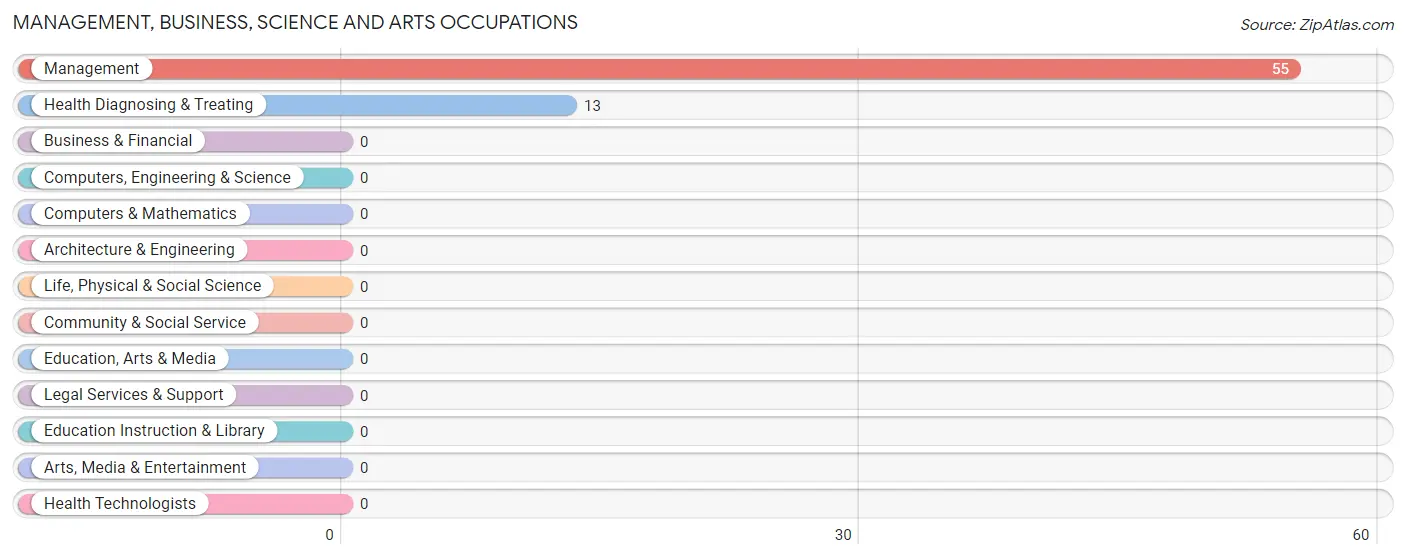
Management, Business, Science and Arts Occupations by Sex
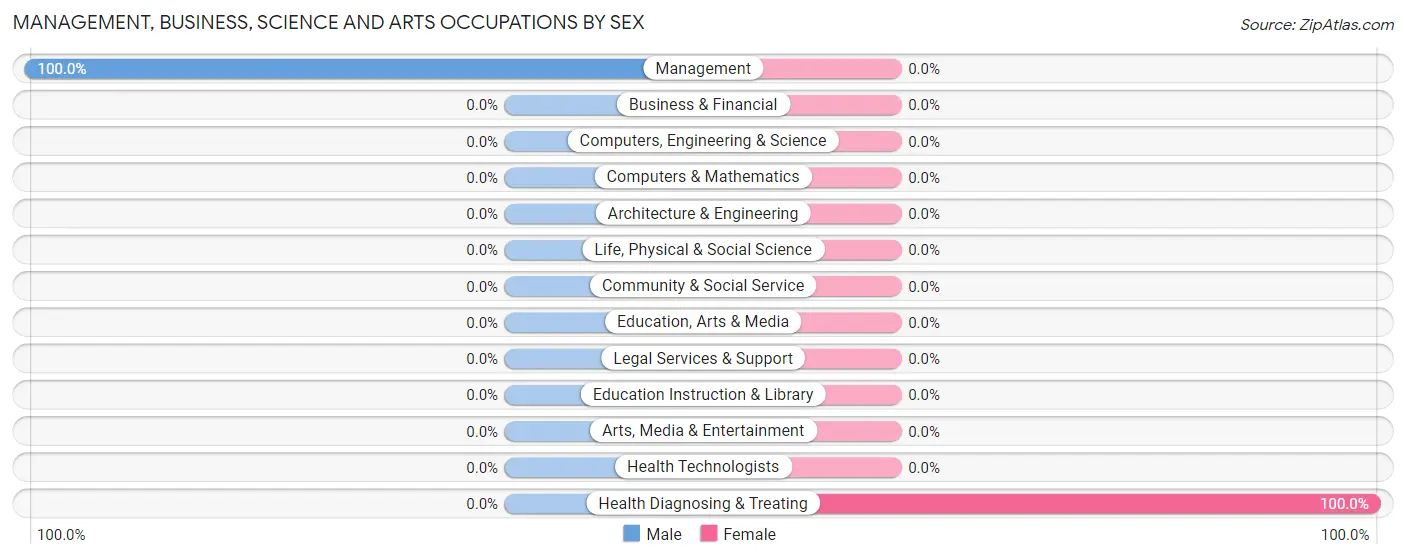
| Occupation | Male | Female |
| Management | 55 (100.0%) | 0 (0.0%) |
| Business & Financial | 0 (0.0%) | 0 (0.0%) |
| Computers, Engineering & Science | 0 (0.0%) | 0 (0.0%) |
| Computers & Mathematics | 0 (0.0%) | 0 (0.0%) |
| Architecture & Engineering | 0 (0.0%) | 0 (0.0%) |
| Life, Physical & Social Science | 0 (0.0%) | 0 (0.0%) |
| Community & Social Service | 0 (0.0%) | 0 (0.0%) |
| Education, Arts & Media | 0 (0.0%) | 0 (0.0%) |
| Legal Services & Support | 0 (0.0%) | 0 (0.0%) |
| Education Instruction & Library | 0 (0.0%) | 0 (0.0%) |
| Arts, Media & Entertainment | 0 (0.0%) | 0 (0.0%) |
| Health Diagnosing & Treating | 0 (0.0%) | 13 (100.0%) |
| Health Technologists | 0 (0.0%) | 0 (0.0%) |
| Total (Category) | 55 (80.9%) | 13 (19.1%) |
| Total (Overall) | 258 (90.8%) | 26 (9.1%) |
Services Occupations
The most common Services occupations in Whitley City are Food Preparation & Serving (90 | 31.7%), Security & Protection (26 | 9.1%), Firefighting & Prevention (20 | 7.0%), and Law Enforcement (6 | 2.1%).
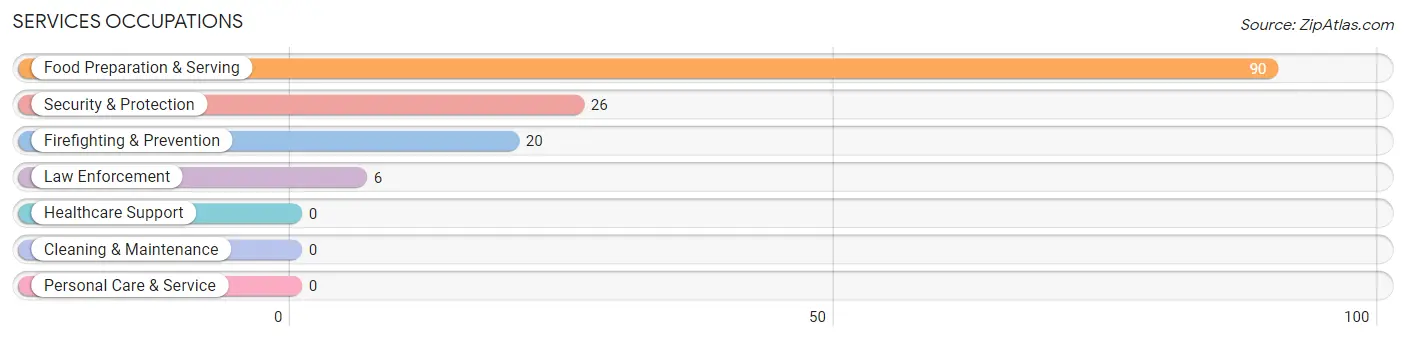
Services Occupations by Sex
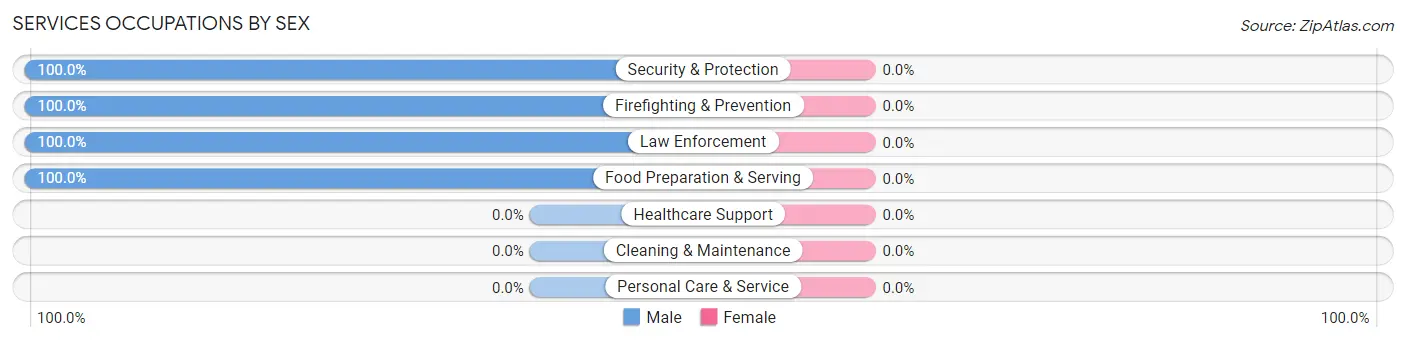
| Occupation | Male | Female |
| Healthcare Support | 0 (0.0%) | 0 (0.0%) |
| Security & Protection | 26 (100.0%) | 0 (0.0%) |
| Firefighting & Prevention | 20 (100.0%) | 0 (0.0%) |
| Law Enforcement | 6 (100.0%) | 0 (0.0%) |
| Food Preparation & Serving | 90 (100.0%) | 0 (0.0%) |
| Cleaning & Maintenance | 0 (0.0%) | 0 (0.0%) |
| Personal Care & Service | 0 (0.0%) | 0 (0.0%) |
| Total (Category) | 116 (100.0%) | 0 (0.0%) |
| Total (Overall) | 258 (90.8%) | 26 (9.1%) |
Sales and Office Occupations
The most common Sales and Office occupations in Whitley City are , and Office & Administration (13 | 4.6%).
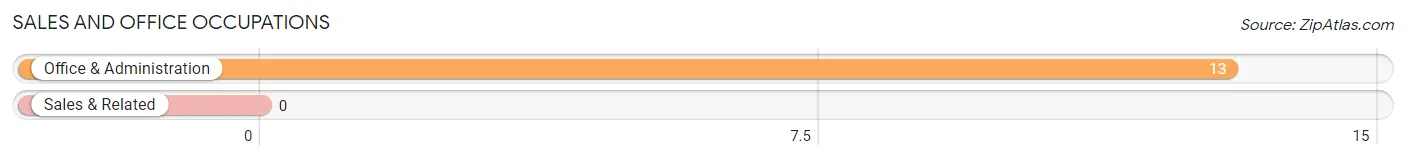
Sales and Office Occupations by Sex
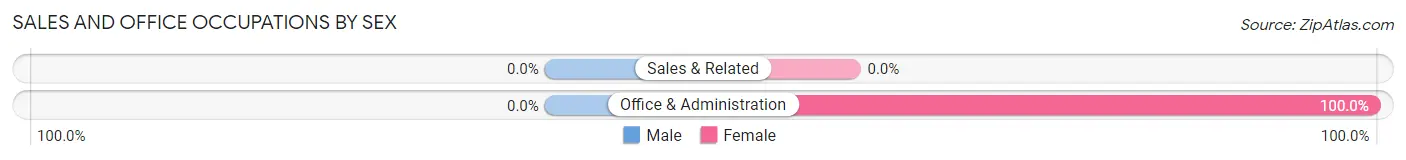
| Occupation | Male | Female |
| Sales & Related | 0 (0.0%) | 0 (0.0%) |
| Office & Administration | 0 (0.0%) | 13 (100.0%) |
| Total (Category) | 0 (0.0%) | 13 (100.0%) |
| Total (Overall) | 258 (90.8%) | 26 (9.1%) |
Natural Resources, Construction and Maintenance Occupations
The most common Natural Resources, Construction and Maintenance occupations in Whitley City are , and Construction & Extraction (28 | 9.9%).
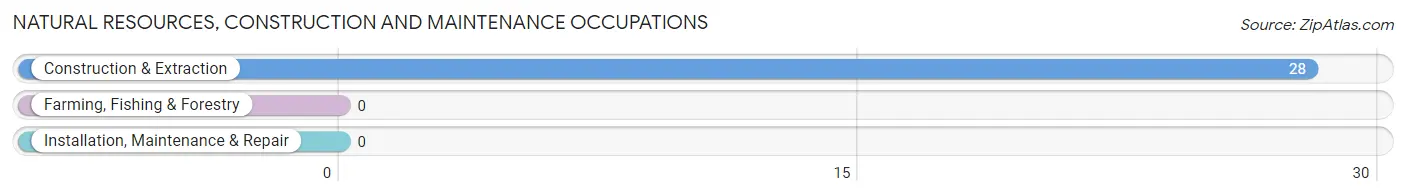
Natural Resources, Construction and Maintenance Occupations by Sex
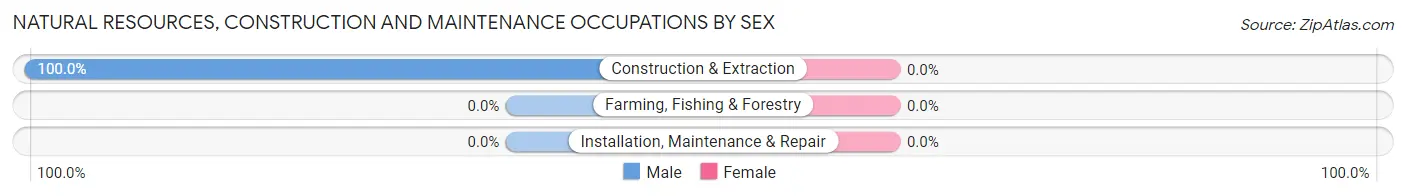
| Occupation | Male | Female |
| Farming, Fishing & Forestry | 0 (0.0%) | 0 (0.0%) |
| Construction & Extraction | 28 (100.0%) | 0 (0.0%) |
| Installation, Maintenance & Repair | 0 (0.0%) | 0 (0.0%) |
| Total (Category) | 28 (100.0%) | 0 (0.0%) |
| Total (Overall) | 258 (90.8%) | 26 (9.1%) |
Production, Transportation and Moving Occupations
The most common Production, Transportation and Moving occupations in Whitley City are Transportation (37 | 13.0%), and Production (22 | 7.7%).
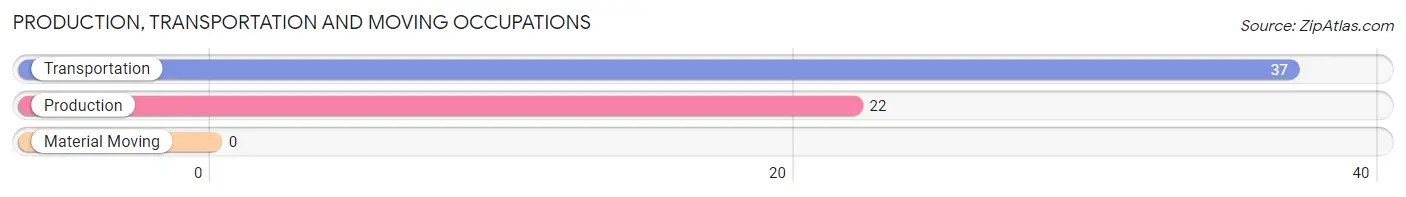
Production, Transportation and Moving Occupations by Sex
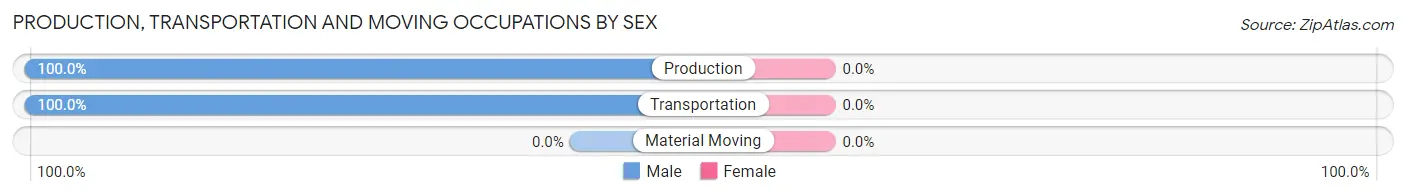
| Occupation | Male | Female |
| Production | 22 (100.0%) | 0 (0.0%) |
| Transportation | 37 (100.0%) | 0 (0.0%) |
| Material Moving | 0 (0.0%) | 0 (0.0%) |
| Total (Category) | 59 (100.0%) | 0 (0.0%) |
| Total (Overall) | 258 (90.8%) | 26 (9.1%) |
Employment Industries by Sex in Whitley City
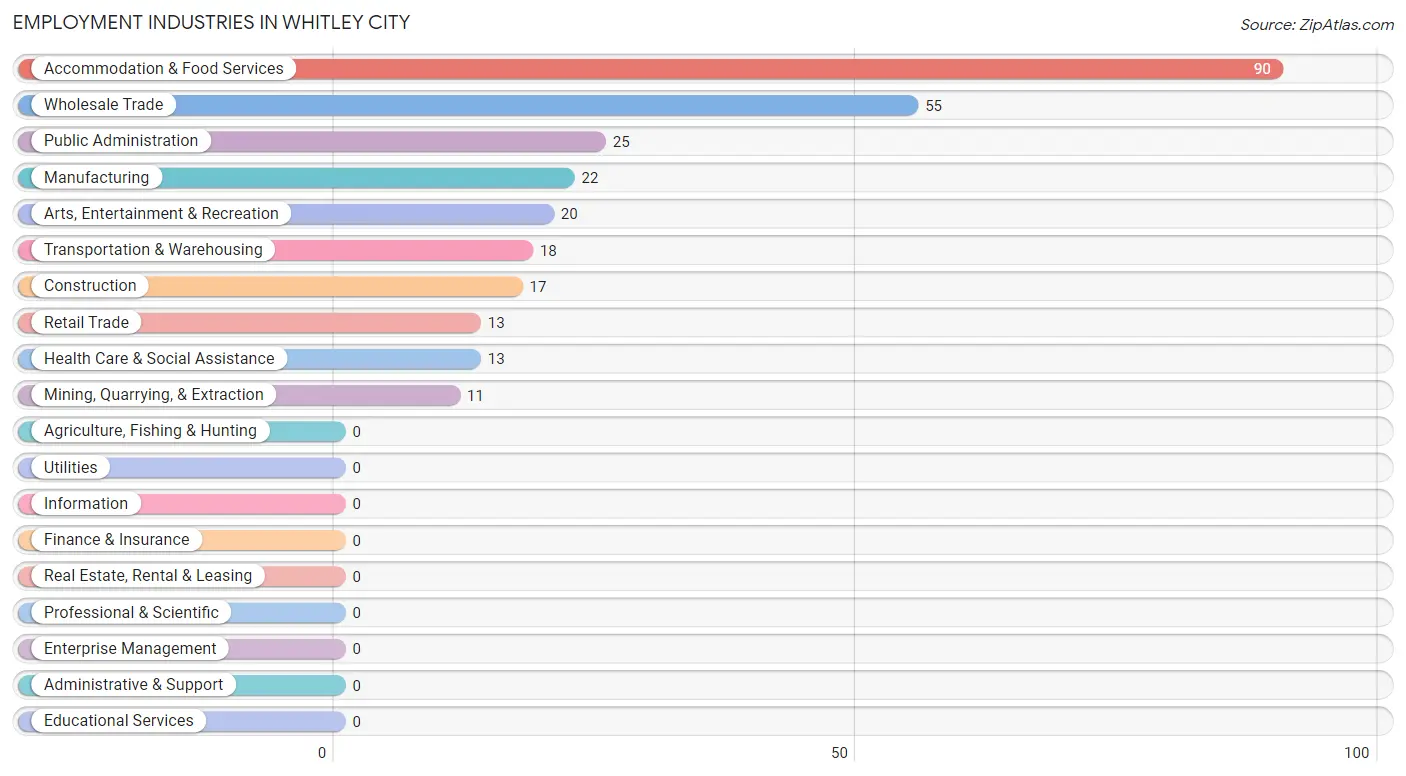
Employment Industries in Whitley City
The major employment industries in Whitley City include Accommodation & Food Services (90 | 31.7%), Wholesale Trade (55 | 19.4%), Public Administration (25 | 8.8%), Manufacturing (22 | 7.7%), and Arts, Entertainment & Recreation (20 | 7.0%).
Employment Industries by Sex in Whitley City
The Whitley City industries that see more men than women are Mining, Quarrying, & Extraction (100.0%), Construction (100.0%), and Manufacturing (100.0%), whereas the industries that tend to have a higher number of women are Retail Trade (100.0%), and Health Care & Social Assistance (100.0%).
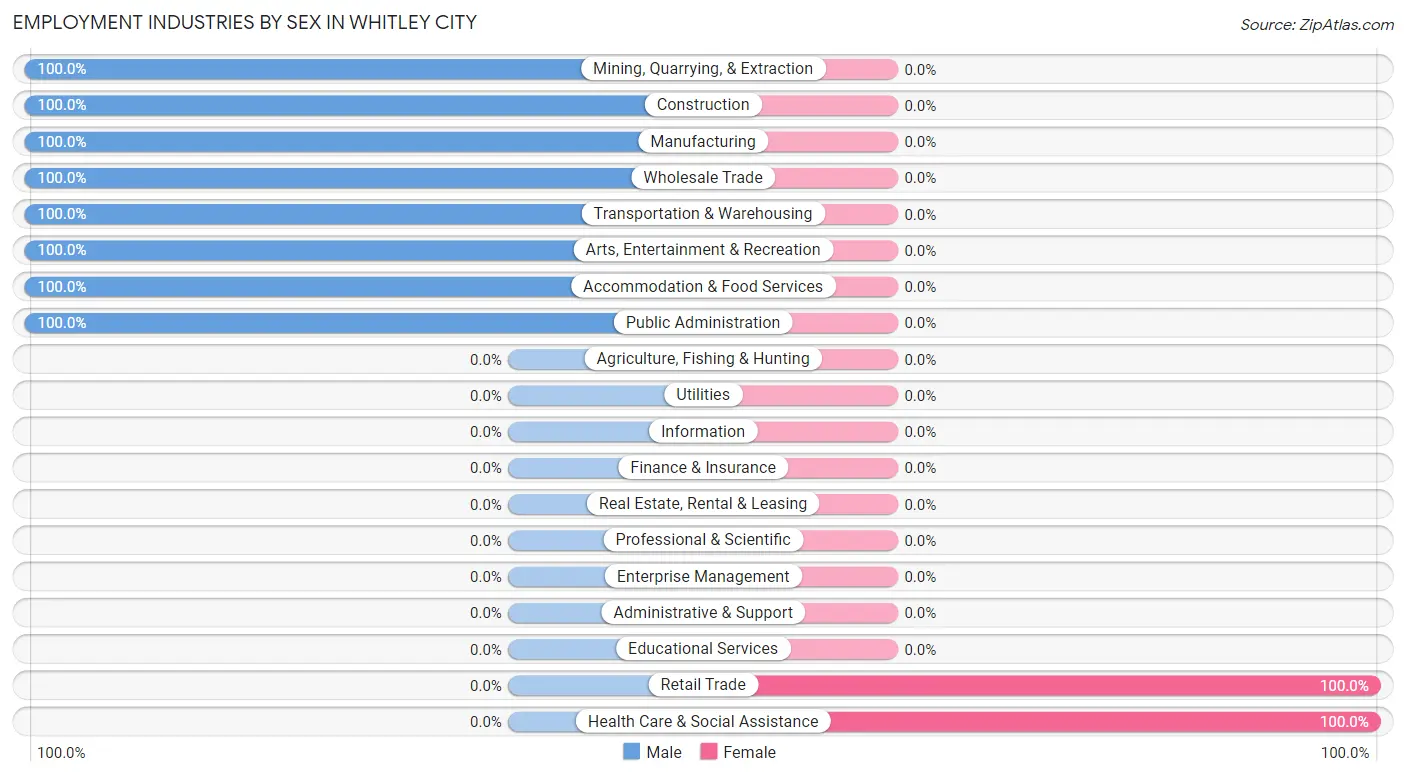
| Industry | Male | Female |
| Agriculture, Fishing & Hunting | 0 (0.0%) | 0 (0.0%) |
| Mining, Quarrying, & Extraction | 11 (100.0%) | 0 (0.0%) |
| Construction | 17 (100.0%) | 0 (0.0%) |
| Manufacturing | 22 (100.0%) | 0 (0.0%) |
| Wholesale Trade | 55 (100.0%) | 0 (0.0%) |
| Retail Trade | 0 (0.0%) | 13 (100.0%) |
| Transportation & Warehousing | 18 (100.0%) | 0 (0.0%) |
| Utilities | 0 (0.0%) | 0 (0.0%) |
| Information | 0 (0.0%) | 0 (0.0%) |
| Finance & Insurance | 0 (0.0%) | 0 (0.0%) |
| Real Estate, Rental & Leasing | 0 (0.0%) | 0 (0.0%) |
| Professional & Scientific | 0 (0.0%) | 0 (0.0%) |
| Enterprise Management | 0 (0.0%) | 0 (0.0%) |
| Administrative & Support | 0 (0.0%) | 0 (0.0%) |
| Educational Services | 0 (0.0%) | 0 (0.0%) |
| Health Care & Social Assistance | 0 (0.0%) | 13 (100.0%) |
| Arts, Entertainment & Recreation | 20 (100.0%) | 0 (0.0%) |
| Accommodation & Food Services | 90 (100.0%) | 0 (0.0%) |
| Public Administration | 25 (100.0%) | 0 (0.0%) |
| Total | 258 (90.8%) | 26 (9.1%) |
Education in Whitley City
School Enrollment in Whitley City
The most common levels of schooling among the 189 students in Whitley City are elementary school (85 | 45.0%), nursery / preschool (42 | 22.2%), and high school (24 | 12.7%).
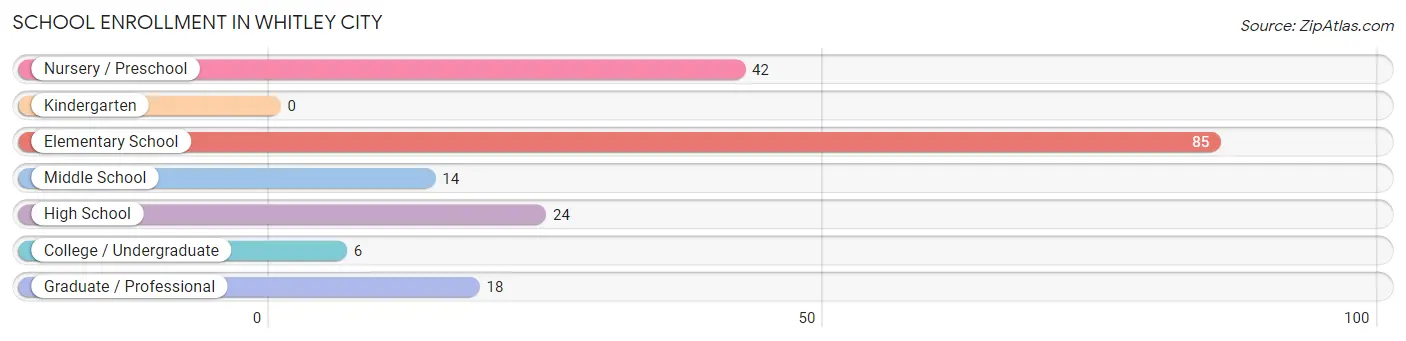
| School Level | # Students | % Students |
| Nursery / Preschool | 42 | 22.2% |
| Kindergarten | 0 | 0.0% |
| Elementary School | 85 | 45.0% |
| Middle School | 14 | 7.4% |
| High School | 24 | 12.7% |
| College / Undergraduate | 6 | 3.2% |
| Graduate / Professional | 18 | 9.5% |
| Total | 189 | 100.0% |
School Enrollment by Age by Funding Source in Whitley City
Out of a total of 189 students who are enrolled in schools in Whitley City, 14 (7.4%) attend a private institution, while the remaining 175 (92.6%) are enrolled in public schools. The age group of 10 to 14 year olds has the highest likelihood of being enrolled in private schools, with 14 (31.8% in the age bracket) enrolled. Conversely, the age group of 5 to 9 year old has the lowest likelihood of being enrolled in a private school, with 97 (100.0% in the age bracket) attending a public institution.
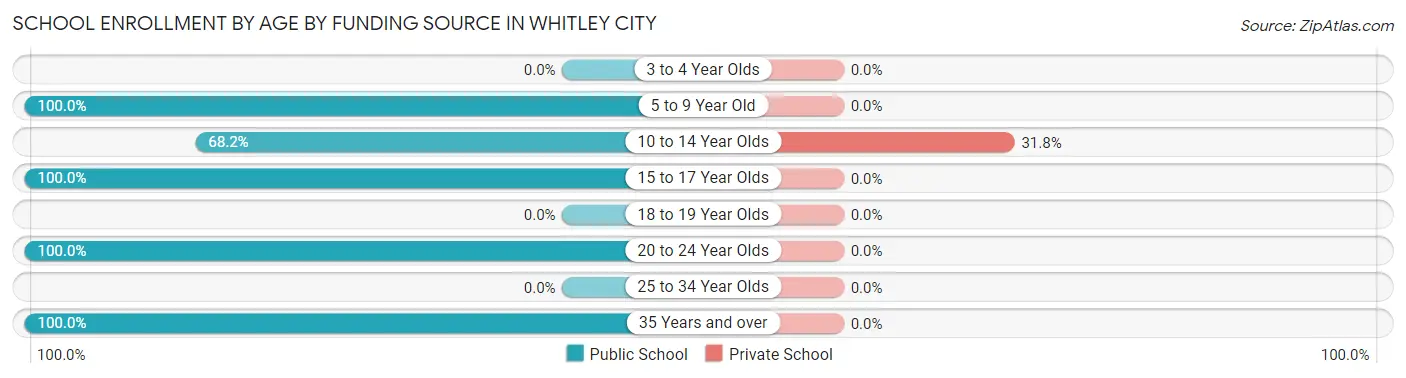
| Age Bracket | Public School | Private School |
| 3 to 4 Year Olds | 0 (0.0%) | 0 (0.0%) |
| 5 to 9 Year Old | 97 (100.0%) | 0 (0.0%) |
| 10 to 14 Year Olds | 30 (68.2%) | 14 (31.8%) |
| 15 to 17 Year Olds | 24 (100.0%) | 0 (0.0%) |
| 18 to 19 Year Olds | 0 (0.0%) | 0 (0.0%) |
| 20 to 24 Year Olds | 15 (100.0%) | 0 (0.0%) |
| 25 to 34 Year Olds | 0 (0.0%) | 0 (0.0%) |
| 35 Years and over | 9 (100.0%) | 0 (0.0%) |
| Total | 175 (92.6%) | 14 (7.4%) |
Educational Attainment by Field of Study in Whitley City
Education (15 | 83.3%), and business (3 | 16.7%) are the most common fields of study among 18 individuals in Whitley City who have obtained a bachelor's degree or higher.
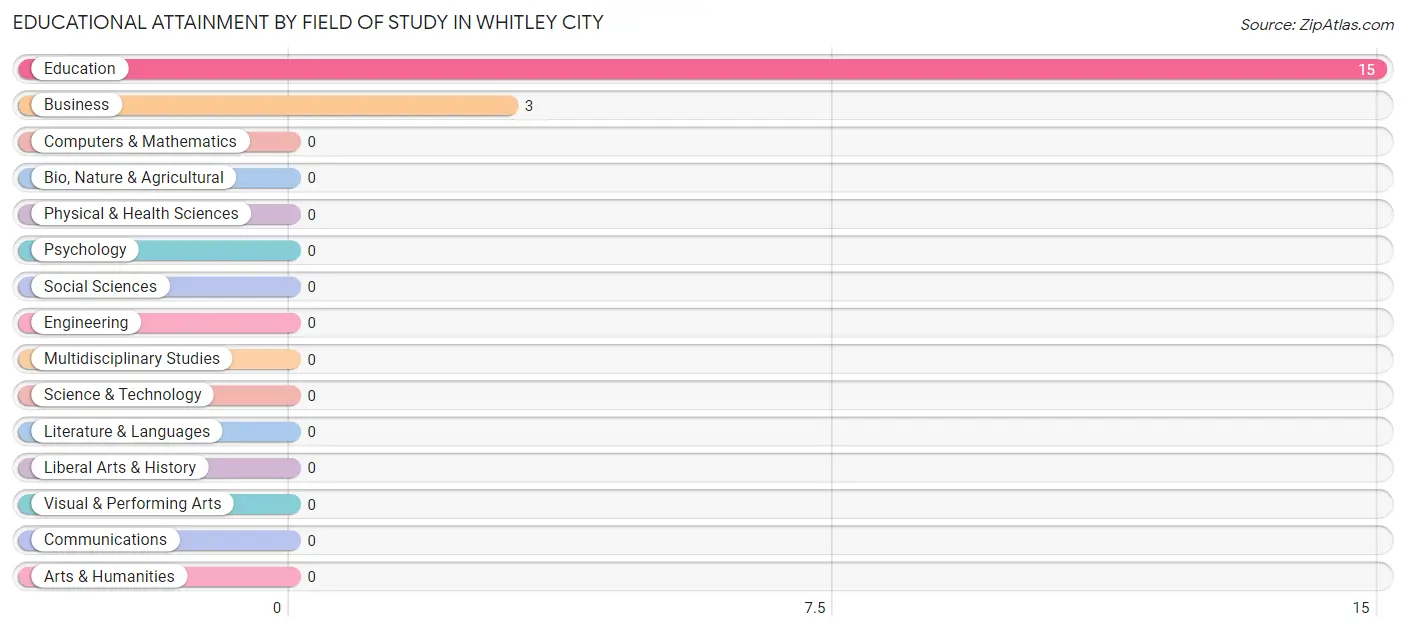
| Field of Study | # Graduates | % Graduates |
| Computers & Mathematics | 0 | 0.0% |
| Bio, Nature & Agricultural | 0 | 0.0% |
| Physical & Health Sciences | 0 | 0.0% |
| Psychology | 0 | 0.0% |
| Social Sciences | 0 | 0.0% |
| Engineering | 0 | 0.0% |
| Multidisciplinary Studies | 0 | 0.0% |
| Science & Technology | 0 | 0.0% |
| Business | 3 | 16.7% |
| Education | 15 | 83.3% |
| Literature & Languages | 0 | 0.0% |
| Liberal Arts & History | 0 | 0.0% |
| Visual & Performing Arts | 0 | 0.0% |
| Communications | 0 | 0.0% |
| Arts & Humanities | 0 | 0.0% |
| Total | 18 | 100.0% |
Transportation & Commute in Whitley City
Vehicle Availability by Sex in Whitley City
The most prevalent vehicle ownership categories in Whitley City are males with no vehicle (75, accounting for 29.3%) and females with no vehicle (0, making up 288.5%).
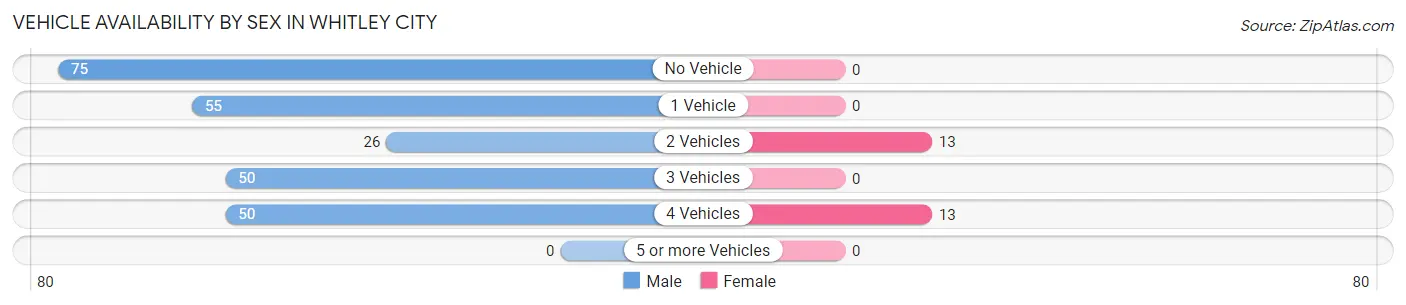
| Vehicles Available | Male | Female |
| No Vehicle | 75 (29.3%) | 0 (0.0%) |
| 1 Vehicle | 55 (21.5%) | 0 (0.0%) |
| 2 Vehicles | 26 (10.2%) | 13 (50.0%) |
| 3 Vehicles | 50 (19.5%) | 0 (0.0%) |
| 4 Vehicles | 50 (19.5%) | 13 (50.0%) |
| 5 or more Vehicles | 0 (0.0%) | 0 (0.0%) |
| Total | 256 (100.0%) | 26 (100.0%) |
Commute Time in Whitley City
The most frequently occuring commute durations in Whitley City are 45 to 59 minutes (108 commuters, 38.0%), 40 to 44 minutes (75 commuters, 26.4%), and 5 to 9 minutes (43 commuters, 15.1%).
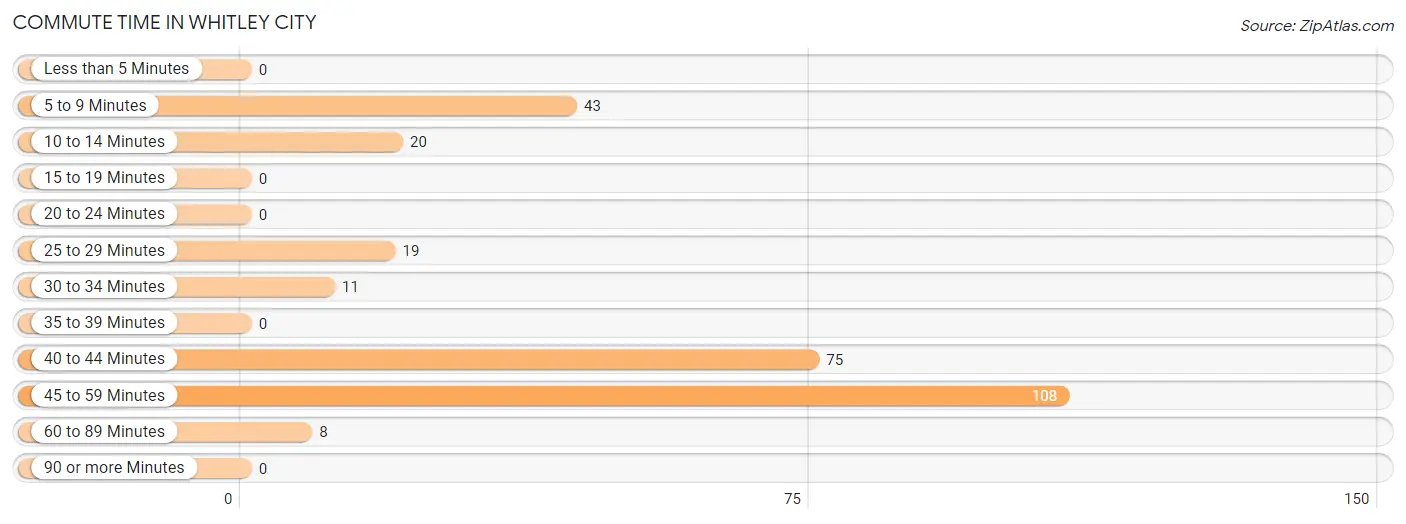
| Commute Time | # Commuters | % Commuters |
| Less than 5 Minutes | 0 | 0.0% |
| 5 to 9 Minutes | 43 | 15.1% |
| 10 to 14 Minutes | 20 | 7.0% |
| 15 to 19 Minutes | 0 | 0.0% |
| 20 to 24 Minutes | 0 | 0.0% |
| 25 to 29 Minutes | 19 | 6.7% |
| 30 to 34 Minutes | 11 | 3.9% |
| 35 to 39 Minutes | 0 | 0.0% |
| 40 to 44 Minutes | 75 | 26.4% |
| 45 to 59 Minutes | 108 | 38.0% |
| 60 to 89 Minutes | 8 | 2.8% |
| 90 or more Minutes | 0 | 0.0% |
Commute Time by Sex in Whitley City
The most common commute times in Whitley City are 45 to 59 minutes (108 commuters, 41.9%) for males and 5 to 9 minutes (26 commuters, 100.0%) for females.
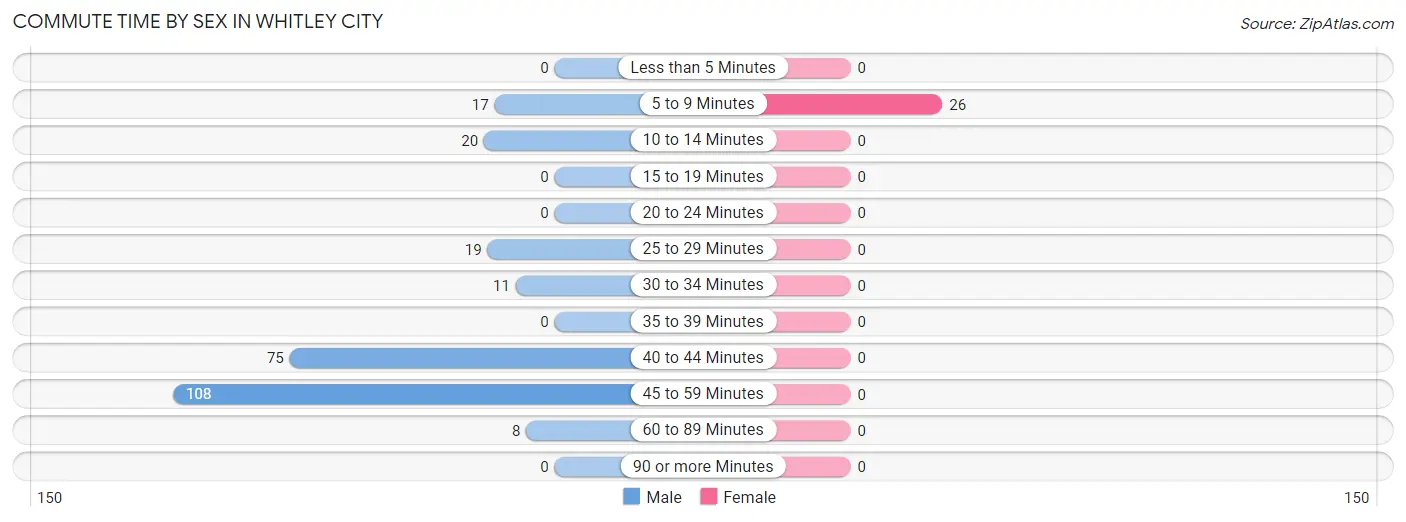
| Commute Time | Male | Female |
| Less than 5 Minutes | 0 (0.0%) | 0 (0.0%) |
| 5 to 9 Minutes | 17 (6.6%) | 26 (100.0%) |
| 10 to 14 Minutes | 20 (7.7%) | 0 (0.0%) |
| 15 to 19 Minutes | 0 (0.0%) | 0 (0.0%) |
| 20 to 24 Minutes | 0 (0.0%) | 0 (0.0%) |
| 25 to 29 Minutes | 19 (7.4%) | 0 (0.0%) |
| 30 to 34 Minutes | 11 (4.3%) | 0 (0.0%) |
| 35 to 39 Minutes | 0 (0.0%) | 0 (0.0%) |
| 40 to 44 Minutes | 75 (29.1%) | 0 (0.0%) |
| 45 to 59 Minutes | 108 (41.9%) | 0 (0.0%) |
| 60 to 89 Minutes | 8 (3.1%) | 0 (0.0%) |
| 90 or more Minutes | 0 (0.0%) | 0 (0.0%) |
Time of Departure to Work by Sex in Whitley City
The most frequent times of departure to work in Whitley City are 7:00 AM to 7:29 AM (94, 36.4%) for males and 8:00 AM to 8:29 AM (13, 50.0%) for females.
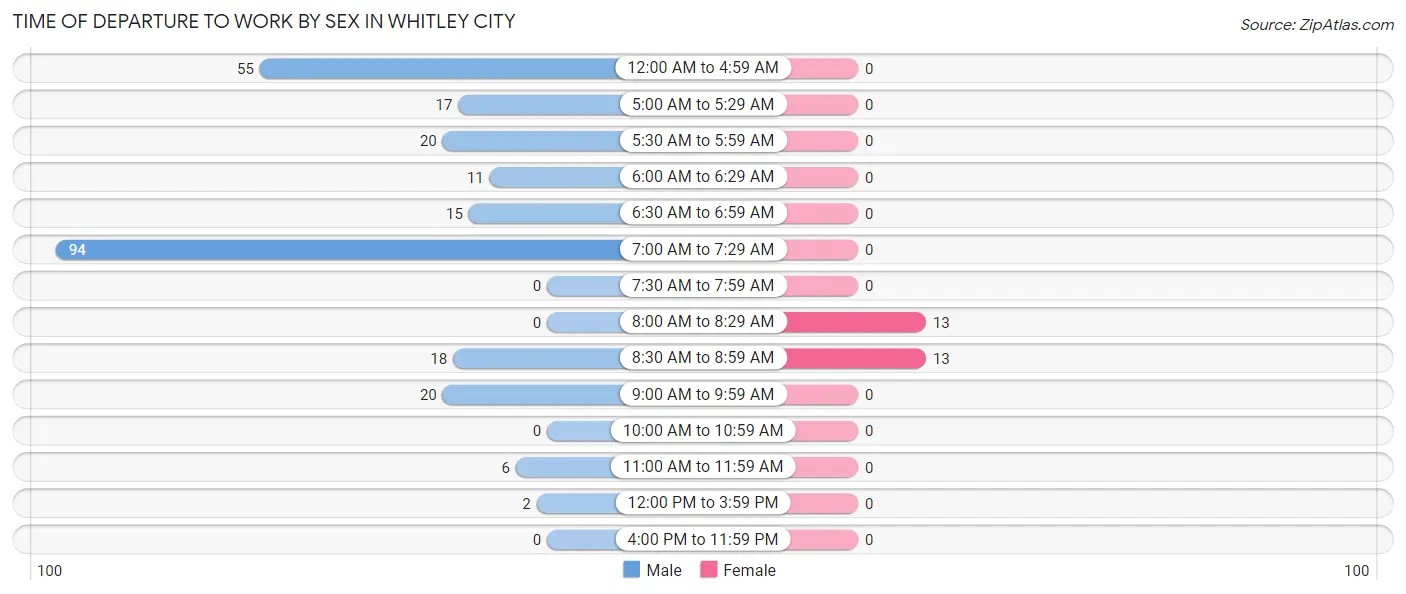
| Time of Departure | Male | Female |
| 12:00 AM to 4:59 AM | 55 (21.3%) | 0 (0.0%) |
| 5:00 AM to 5:29 AM | 17 (6.6%) | 0 (0.0%) |
| 5:30 AM to 5:59 AM | 20 (7.7%) | 0 (0.0%) |
| 6:00 AM to 6:29 AM | 11 (4.3%) | 0 (0.0%) |
| 6:30 AM to 6:59 AM | 15 (5.8%) | 0 (0.0%) |
| 7:00 AM to 7:29 AM | 94 (36.4%) | 0 (0.0%) |
| 7:30 AM to 7:59 AM | 0 (0.0%) | 0 (0.0%) |
| 8:00 AM to 8:29 AM | 0 (0.0%) | 13 (50.0%) |
| 8:30 AM to 8:59 AM | 18 (7.0%) | 13 (50.0%) |
| 9:00 AM to 9:59 AM | 20 (7.7%) | 0 (0.0%) |
| 10:00 AM to 10:59 AM | 0 (0.0%) | 0 (0.0%) |
| 11:00 AM to 11:59 AM | 6 (2.3%) | 0 (0.0%) |
| 12:00 PM to 3:59 PM | 2 (0.8%) | 0 (0.0%) |
| 4:00 PM to 11:59 PM | 0 (0.0%) | 0 (0.0%) |
| Total | 258 (100.0%) | 26 (100.0%) |
Housing Occupancy in Whitley City
Occupancy by Ownership in Whitley City
Of the total 405 dwellings in Whitley City, owner-occupied units account for 204 (50.4%), while renter-occupied units make up 201 (49.6%).
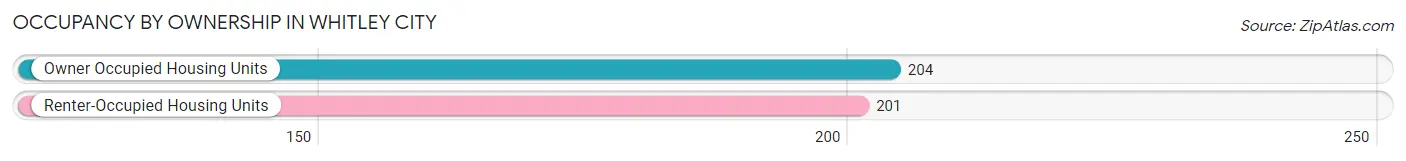
| Occupancy | # Housing Units | % Housing Units |
| Owner Occupied Housing Units | 204 | 50.4% |
| Renter-Occupied Housing Units | 201 | 49.6% |
| Total Occupied Housing Units | 405 | 100.0% |
Occupancy by Household Size in Whitley City
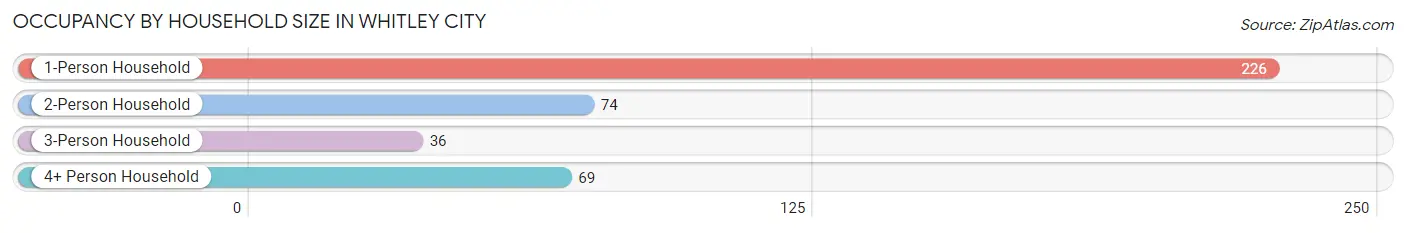
| Household Size | # Housing Units | % Housing Units |
| 1-Person Household | 226 | 55.8% |
| 2-Person Household | 74 | 18.3% |
| 3-Person Household | 36 | 8.9% |
| 4+ Person Household | 69 | 17.0% |
| Total Housing Units | 405 | 100.0% |
Occupancy by Ownership by Household Size in Whitley City
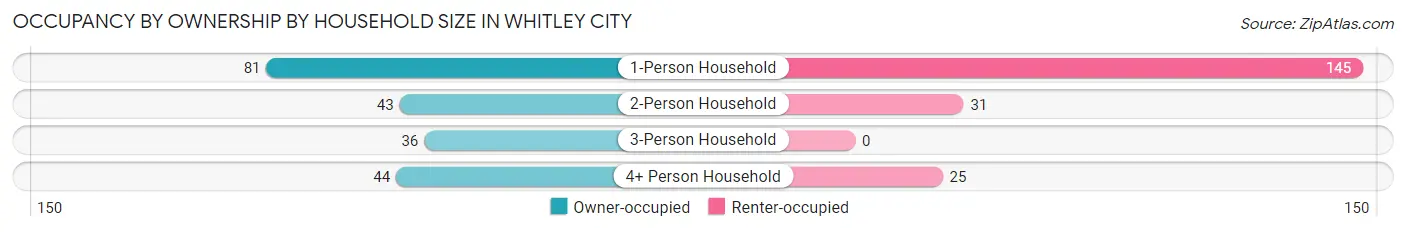
| Household Size | Owner-occupied | Renter-occupied |
| 1-Person Household | 81 (35.8%) | 145 (64.2%) |
| 2-Person Household | 43 (58.1%) | 31 (41.9%) |
| 3-Person Household | 36 (100.0%) | 0 (0.0%) |
| 4+ Person Household | 44 (63.8%) | 25 (36.2%) |
| Total Housing Units | 204 (50.4%) | 201 (49.6%) |
Occupancy by Educational Attainment in Whitley City
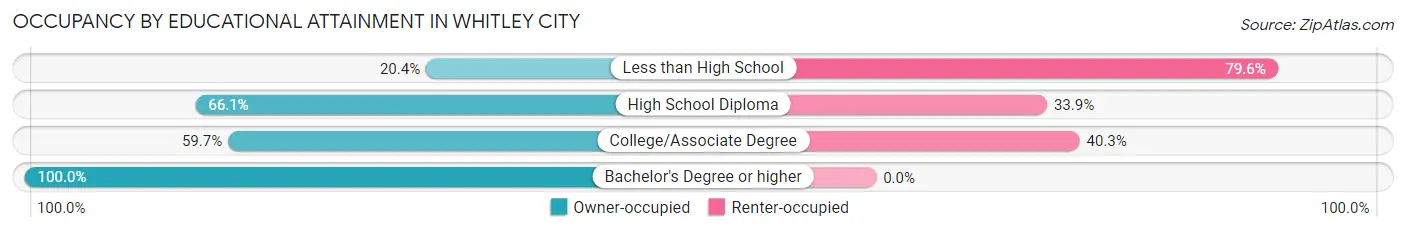
| Household Size | Owner-occupied | Renter-occupied |
| Less than High School | 29 (20.4%) | 113 (79.6%) |
| High School Diploma | 123 (66.1%) | 63 (33.9%) |
| College/Associate Degree | 37 (59.7%) | 25 (40.3%) |
| Bachelor's Degree or higher | 15 (100.0%) | 0 (0.0%) |
Occupancy by Age of Householder in Whitley City
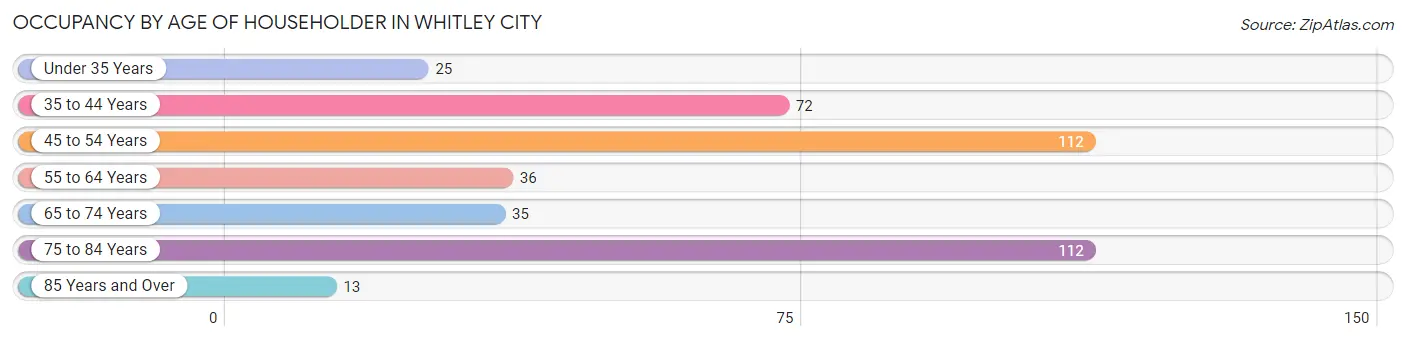
| Age Bracket | # Households | % Households |
| Under 35 Years | 25 | 6.2% |
| 35 to 44 Years | 72 | 17.8% |
| 45 to 54 Years | 112 | 27.7% |
| 55 to 64 Years | 36 | 8.9% |
| 65 to 74 Years | 35 | 8.6% |
| 75 to 84 Years | 112 | 27.7% |
| 85 Years and Over | 13 | 3.2% |
| Total | 405 | 100.0% |
Housing Finances in Whitley City
Median Income by Occupancy in Whitley City
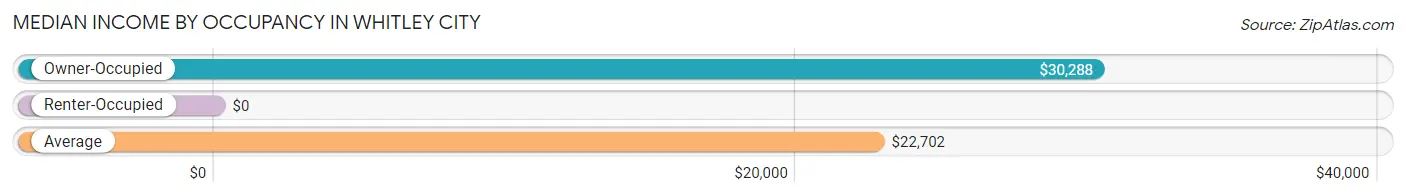
| Occupancy Type | # Households | Median Income |
| Owner-Occupied | 204 (50.4%) | $30,288 |
| Renter-Occupied | 201 (49.6%) | $0 |
| Average | 405 (100.0%) | $22,702 |
Occupancy by Householder Income Bracket in Whitley City
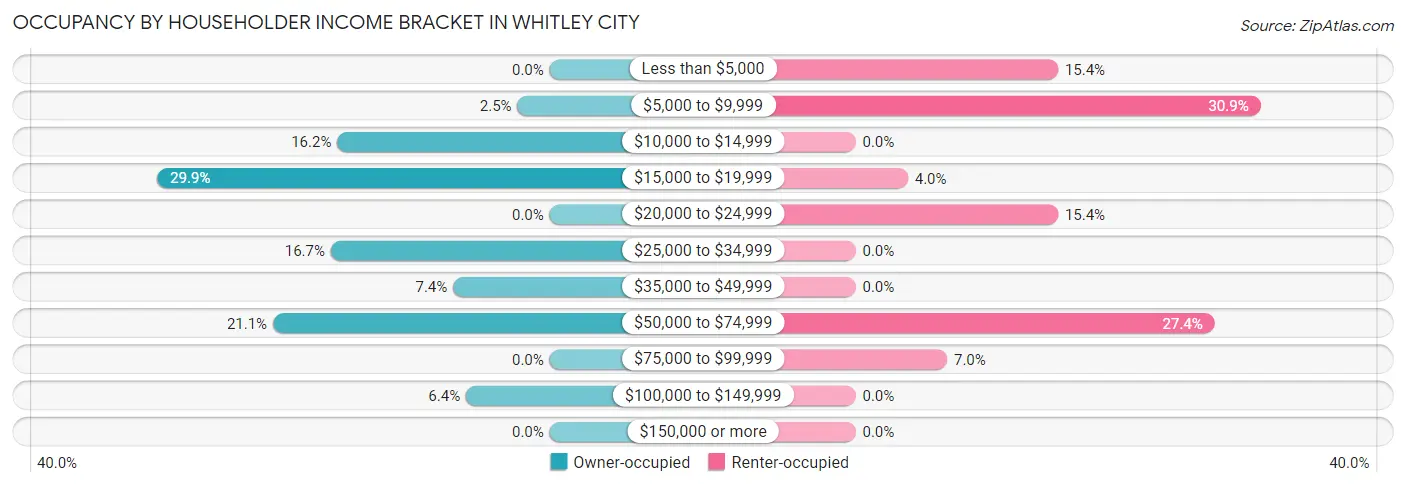
| Income Bracket | Owner-occupied | Renter-occupied |
| Less than $5,000 | 0 (0.0%) | 31 (15.4%) |
| $5,000 to $9,999 | 5 (2.5%) | 62 (30.8%) |
| $10,000 to $14,999 | 33 (16.2%) | 0 (0.0%) |
| $15,000 to $19,999 | 61 (29.9%) | 8 (4.0%) |
| $20,000 to $24,999 | 0 (0.0%) | 31 (15.4%) |
| $25,000 to $34,999 | 34 (16.7%) | 0 (0.0%) |
| $35,000 to $49,999 | 15 (7.3%) | 0 (0.0%) |
| $50,000 to $74,999 | 43 (21.1%) | 55 (27.4%) |
| $75,000 to $99,999 | 0 (0.0%) | 14 (7.0%) |
| $100,000 to $149,999 | 13 (6.4%) | 0 (0.0%) |
| $150,000 or more | 0 (0.0%) | 0 (0.0%) |
| Total | 204 (100.0%) | 201 (100.0%) |
Monthly Housing Cost Tiers in Whitley City
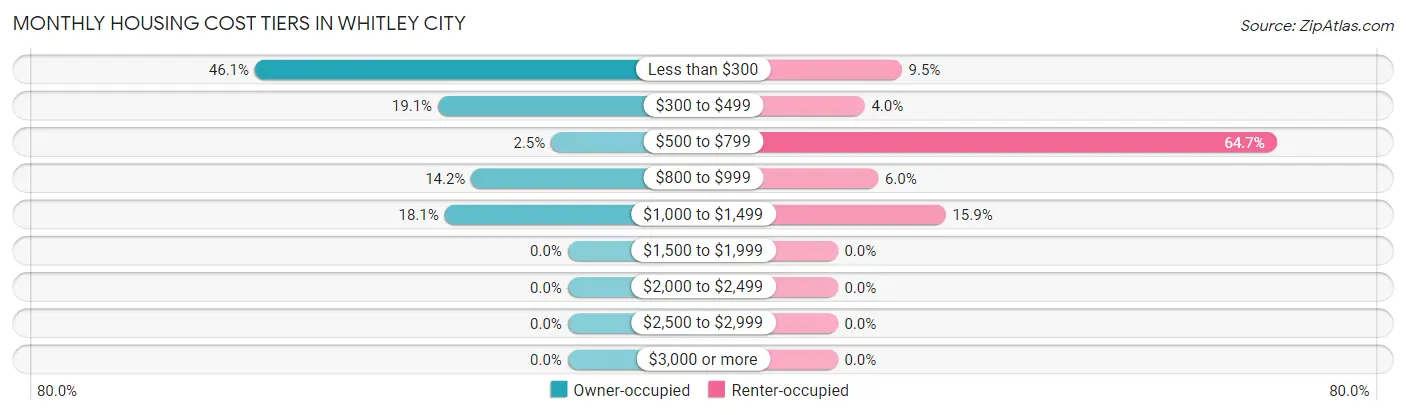
| Monthly Cost | Owner-occupied | Renter-occupied |
| Less than $300 | 94 (46.1%) | 19 (9.5%) |
| $300 to $499 | 39 (19.1%) | 8 (4.0%) |
| $500 to $799 | 5 (2.5%) | 130 (64.7%) |
| $800 to $999 | 29 (14.2%) | 12 (6.0%) |
| $1,000 to $1,499 | 37 (18.1%) | 32 (15.9%) |
| $1,500 to $1,999 | 0 (0.0%) | 0 (0.0%) |
| $2,000 to $2,499 | 0 (0.0%) | 0 (0.0%) |
| $2,500 to $2,999 | 0 (0.0%) | 0 (0.0%) |
| $3,000 or more | 0 (0.0%) | 0 (0.0%) |
| Total | 204 (100.0%) | 201 (100.0%) |
Physical Housing Characteristics in Whitley City
Housing Structures in Whitley City
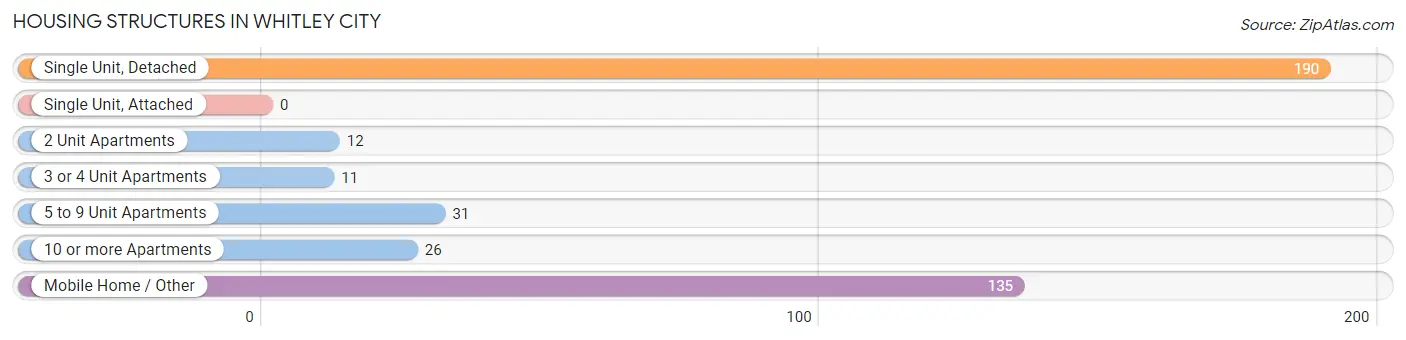
| Structure Type | # Housing Units | % Housing Units |
| Single Unit, Detached | 190 | 46.9% |
| Single Unit, Attached | 0 | 0.0% |
| 2 Unit Apartments | 12 | 3.0% |
| 3 or 4 Unit Apartments | 11 | 2.7% |
| 5 to 9 Unit Apartments | 31 | 7.6% |
| 10 or more Apartments | 26 | 6.4% |
| Mobile Home / Other | 135 | 33.3% |
| Total | 405 | 100.0% |
Housing Structures by Occupancy in Whitley City
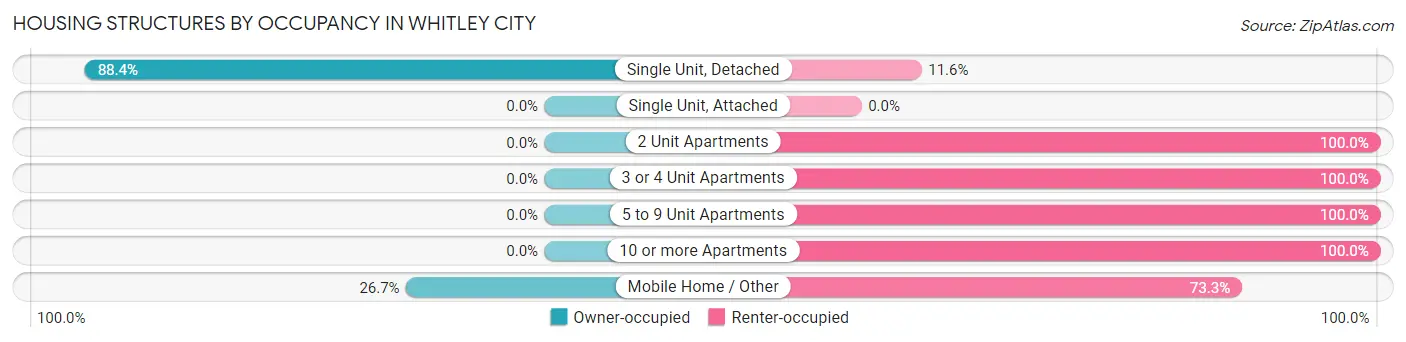
| Structure Type | Owner-occupied | Renter-occupied |
| Single Unit, Detached | 168 (88.4%) | 22 (11.6%) |
| Single Unit, Attached | 0 (0.0%) | 0 (0.0%) |
| 2 Unit Apartments | 0 (0.0%) | 12 (100.0%) |
| 3 or 4 Unit Apartments | 0 (0.0%) | 11 (100.0%) |
| 5 to 9 Unit Apartments | 0 (0.0%) | 31 (100.0%) |
| 10 or more Apartments | 0 (0.0%) | 26 (100.0%) |
| Mobile Home / Other | 36 (26.7%) | 99 (73.3%) |
| Total | 204 (50.4%) | 201 (49.6%) |
Housing Structures by Number of Rooms in Whitley City
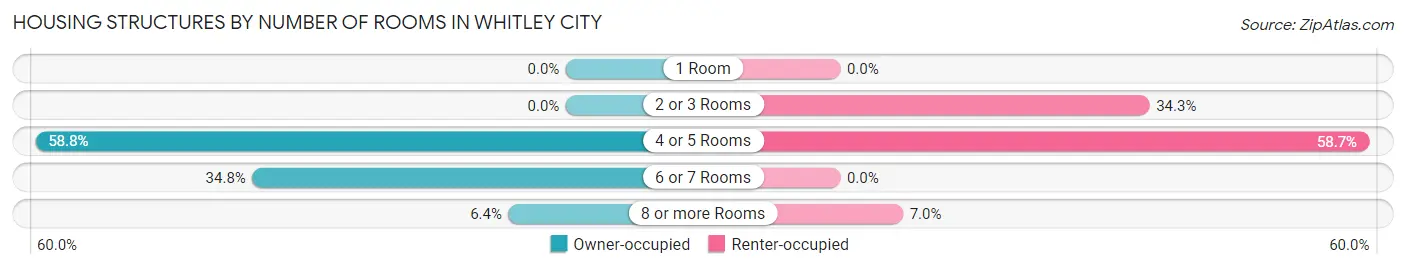
| Number of Rooms | Owner-occupied | Renter-occupied |
| 1 Room | 0 (0.0%) | 0 (0.0%) |
| 2 or 3 Rooms | 0 (0.0%) | 69 (34.3%) |
| 4 or 5 Rooms | 120 (58.8%) | 118 (58.7%) |
| 6 or 7 Rooms | 71 (34.8%) | 0 (0.0%) |
| 8 or more Rooms | 13 (6.4%) | 14 (7.0%) |
| Total | 204 (100.0%) | 201 (100.0%) |
Housing Structure by Heating Type in Whitley City
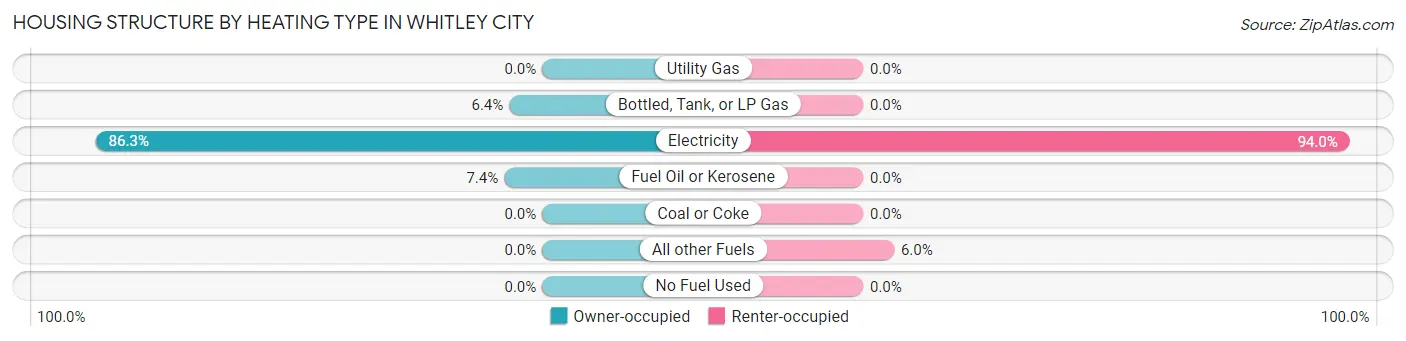
| Heating Type | Owner-occupied | Renter-occupied |
| Utility Gas | 0 (0.0%) | 0 (0.0%) |
| Bottled, Tank, or LP Gas | 13 (6.4%) | 0 (0.0%) |
| Electricity | 176 (86.3%) | 189 (94.0%) |
| Fuel Oil or Kerosene | 15 (7.3%) | 0 (0.0%) |
| Coal or Coke | 0 (0.0%) | 0 (0.0%) |
| All other Fuels | 0 (0.0%) | 12 (6.0%) |
| No Fuel Used | 0 (0.0%) | 0 (0.0%) |
| Total | 204 (100.0%) | 201 (100.0%) |
Household Vehicle Usage in Whitley City
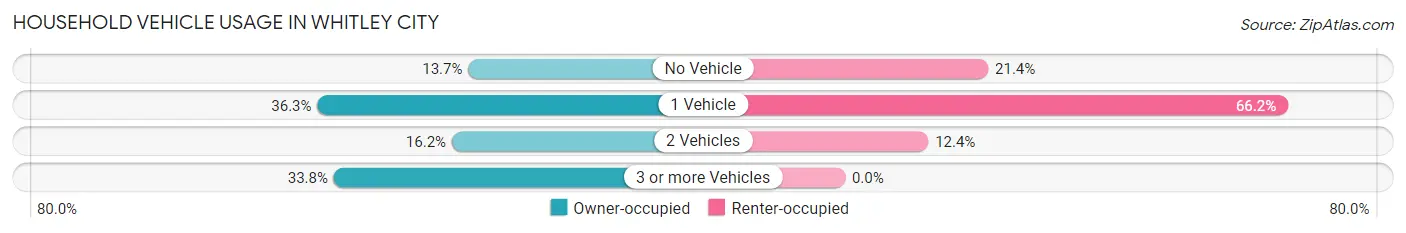
| Vehicles per Household | Owner-occupied | Renter-occupied |
| No Vehicle | 28 (13.7%) | 43 (21.4%) |
| 1 Vehicle | 74 (36.3%) | 133 (66.2%) |
| 2 Vehicles | 33 (16.2%) | 25 (12.4%) |
| 3 or more Vehicles | 69 (33.8%) | 0 (0.0%) |
| Total | 204 (100.0%) | 201 (100.0%) |
Real Estate & Mortgages in Whitley City
Real Estate and Mortgage Overview in Whitley City
| Characteristic | Without Mortgage | With Mortgage |
| Housing Units | 113 | 91 |
| Median Property Value | $74,600 | $77,100 |
| Median Household Income | - | - |
| Monthly Housing Costs | $235 | $0 |
| Real Estate Taxes | $199 | $5 |
Property Value by Mortgage Status in Whitley City
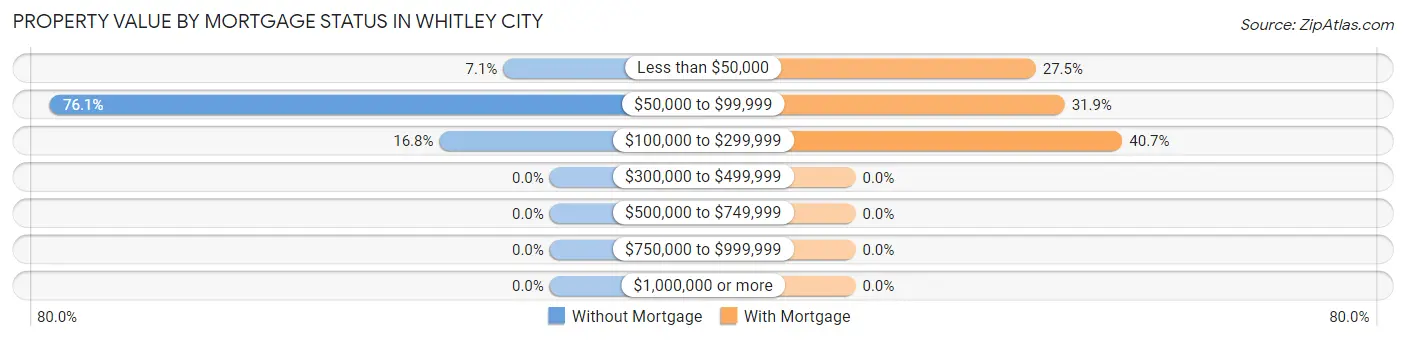
| Property Value | Without Mortgage | With Mortgage |
| Less than $50,000 | 8 (7.1%) | 25 (27.5%) |
| $50,000 to $99,999 | 86 (76.1%) | 29 (31.9%) |
| $100,000 to $299,999 | 19 (16.8%) | 37 (40.7%) |
| $300,000 to $499,999 | 0 (0.0%) | 0 (0.0%) |
| $500,000 to $749,999 | 0 (0.0%) | 0 (0.0%) |
| $750,000 to $999,999 | 0 (0.0%) | 0 (0.0%) |
| $1,000,000 or more | 0 (0.0%) | 0 (0.0%) |
| Total | 113 (100.0%) | 91 (100.0%) |
Household Income by Mortgage Status in Whitley City
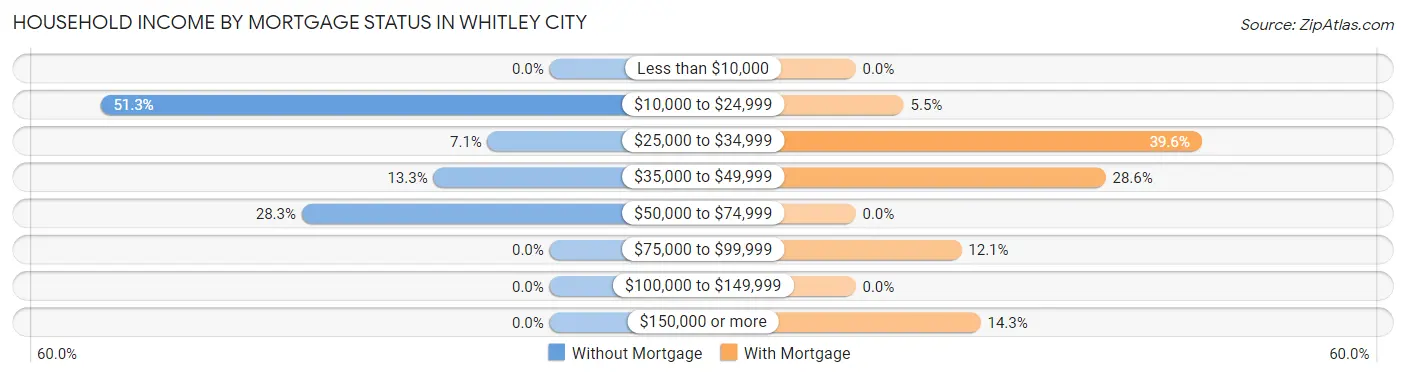
| Household Income | Without Mortgage | With Mortgage |
| Less than $10,000 | 0 (0.0%) | 0 (0.0%) |
| $10,000 to $24,999 | 58 (51.3%) | 5 (5.5%) |
| $25,000 to $34,999 | 8 (7.1%) | 36 (39.6%) |
| $35,000 to $49,999 | 15 (13.3%) | 26 (28.6%) |
| $50,000 to $74,999 | 32 (28.3%) | 0 (0.0%) |
| $75,000 to $99,999 | 0 (0.0%) | 11 (12.1%) |
| $100,000 to $149,999 | 0 (0.0%) | 0 (0.0%) |
| $150,000 or more | 0 (0.0%) | 13 (14.3%) |
| Total | 113 (100.0%) | 91 (100.0%) |
Property Value to Household Income Ratio in Whitley City
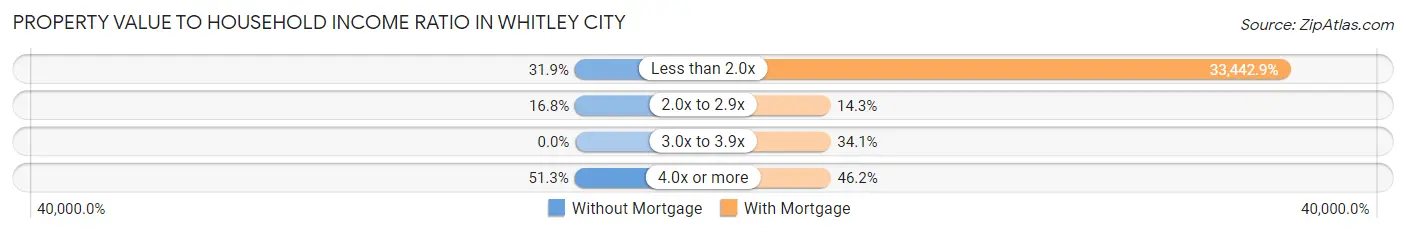
| Value-to-Income Ratio | Without Mortgage | With Mortgage |
| Less than 2.0x | 36 (31.9%) | 30,433 (33,442.9%) |
| 2.0x to 2.9x | 19 (16.8%) | 13 (14.3%) |
| 3.0x to 3.9x | 0 (0.0%) | 31 (34.1%) |
| 4.0x or more | 58 (51.3%) | 42 (46.2%) |
| Total | 113 (100.0%) | 91 (100.0%) |
Real Estate Taxes by Mortgage Status in Whitley City
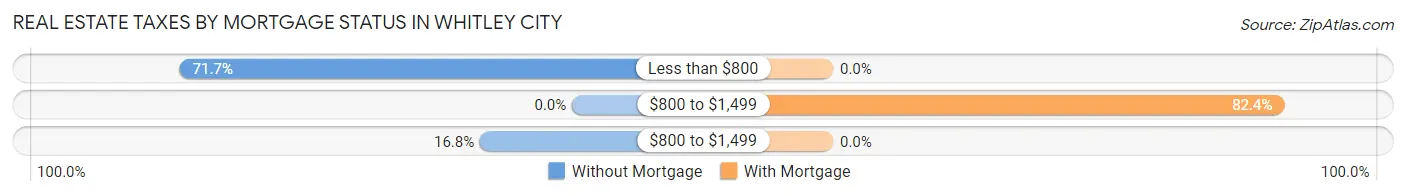
| Property Taxes | Without Mortgage | With Mortgage |
| Less than $800 | 81 (71.7%) | 0 (0.0%) |
| $800 to $1,499 | 0 (0.0%) | 75 (82.4%) |
| $800 to $1,499 | 19 (16.8%) | 0 (0.0%) |
| Total | 113 (100.0%) | 91 (100.0%) |
Health & Disability in Whitley City
Health Insurance Coverage by Age in Whitley City
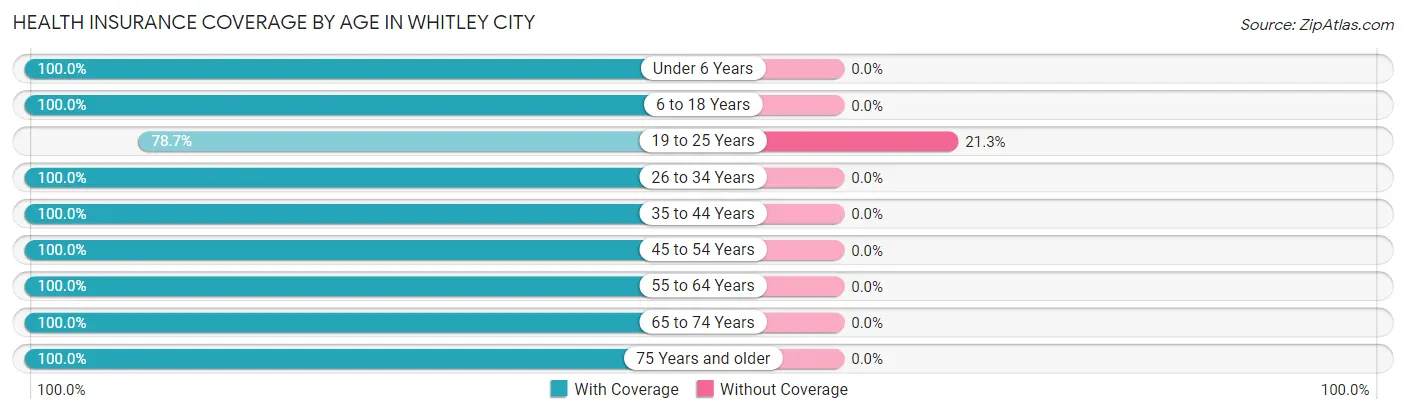
| Age Bracket | With Coverage | Without Coverage |
| Under 6 Years | 190 (100.0%) | 0 (0.0%) |
| 6 to 18 Years | 143 (100.0%) | 0 (0.0%) |
| 19 to 25 Years | 74 (78.7%) | 20 (21.3%) |
| 26 to 34 Years | 89 (100.0%) | 0 (0.0%) |
| 35 to 44 Years | 115 (100.0%) | 0 (0.0%) |
| 45 to 54 Years | 195 (100.0%) | 0 (0.0%) |
| 55 to 64 Years | 74 (100.0%) | 0 (0.0%) |
| 65 to 74 Years | 62 (100.0%) | 0 (0.0%) |
| 75 Years and older | 125 (100.0%) | 0 (0.0%) |
| Total | 1,067 (98.2%) | 20 (1.8%) |
Health Insurance Coverage by Citizenship Status in Whitley City
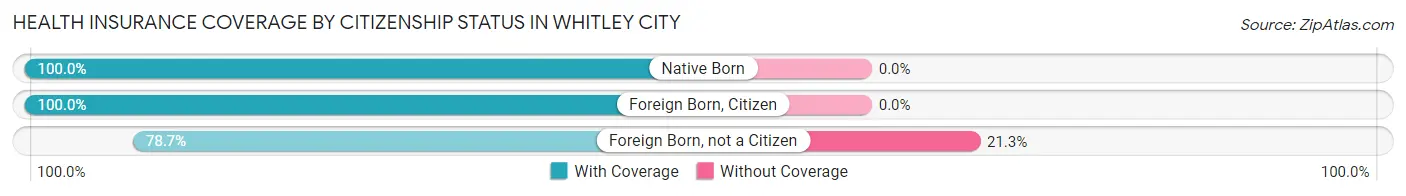
| Citizenship Status | With Coverage | Without Coverage |
| Native Born | 190 (100.0%) | 0 (0.0%) |
| Foreign Born, Citizen | 143 (100.0%) | 0 (0.0%) |
| Foreign Born, not a Citizen | 74 (78.7%) | 20 (21.3%) |
Health Insurance Coverage by Household Income in Whitley City
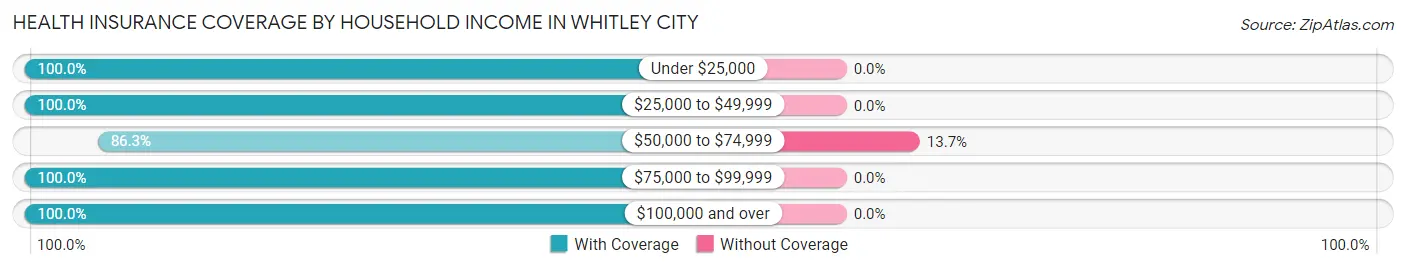
| Household Income | With Coverage | Without Coverage |
| Under $25,000 | 476 (100.0%) | 0 (0.0%) |
| $25,000 to $49,999 | 184 (100.0%) | 0 (0.0%) |
| $50,000 to $74,999 | 126 (86.3%) | 20 (13.7%) |
| $75,000 to $99,999 | 216 (100.0%) | 0 (0.0%) |
| $100,000 and over | 63 (100.0%) | 0 (0.0%) |
Public vs Private Health Insurance Coverage by Age in Whitley City
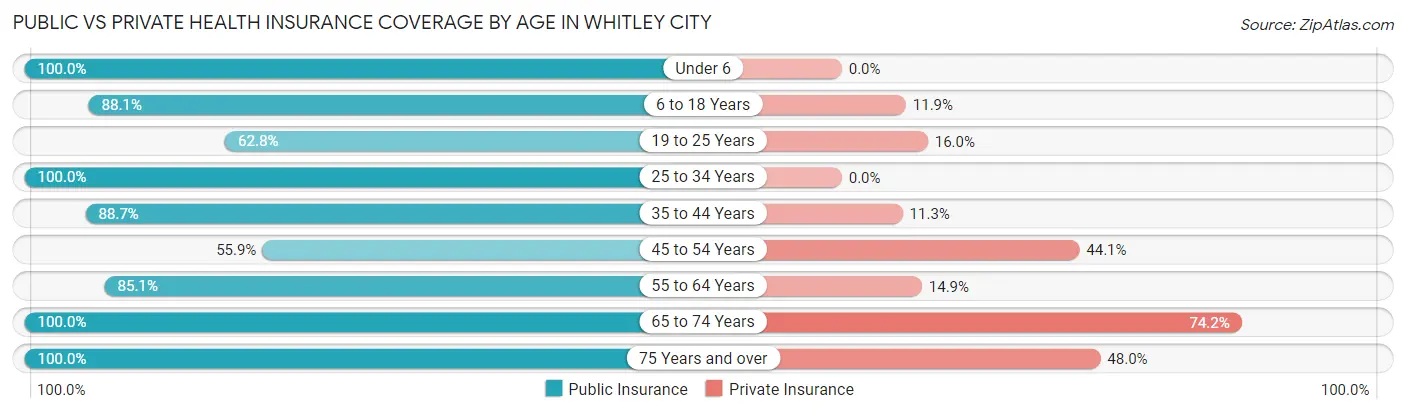
| Age Bracket | Public Insurance | Private Insurance |
| Under 6 | 190 (100.0%) | 0 (0.0%) |
| 6 to 18 Years | 126 (88.1%) | 17 (11.9%) |
| 19 to 25 Years | 59 (62.8%) | 15 (16.0%) |
| 25 to 34 Years | 89 (100.0%) | 0 (0.0%) |
| 35 to 44 Years | 102 (88.7%) | 13 (11.3%) |
| 45 to 54 Years | 109 (55.9%) | 86 (44.1%) |
| 55 to 64 Years | 63 (85.1%) | 11 (14.9%) |
| 65 to 74 Years | 62 (100.0%) | 46 (74.2%) |
| 75 Years and over | 125 (100.0%) | 60 (48.0%) |
| Total | 925 (85.1%) | 248 (22.8%) |
Disability Status by Sex by Age in Whitley City
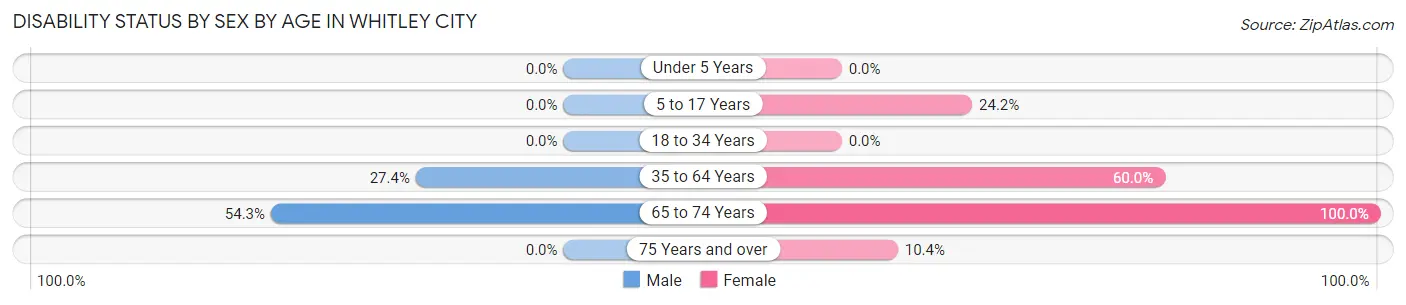
| Age Bracket | Male | Female |
| Under 5 Years | 0 (0.0%) | 0 (0.0%) |
| 5 to 17 Years | 0 (0.0%) | 15 (24.2%) |
| 18 to 34 Years | 0 (0.0%) | 0 (0.0%) |
| 35 to 64 Years | 60 (27.4%) | 99 (60.0%) |
| 65 to 74 Years | 19 (54.3%) | 27 (100.0%) |
| 75 Years and over | 0 (0.0%) | 13 (10.4%) |
Disability Class by Sex by Age in Whitley City
Disability Class: Hearing Difficulty
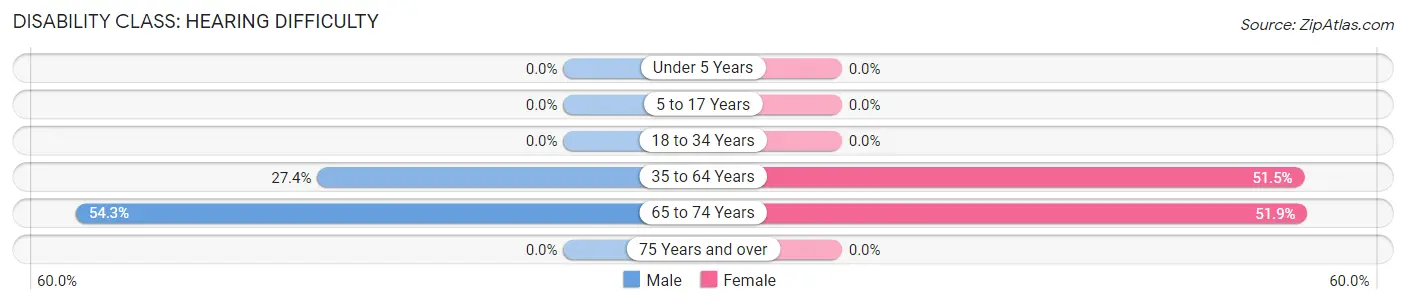
| Age Bracket | Male | Female |
| Under 5 Years | 0 (0.0%) | 0 (0.0%) |
| 5 to 17 Years | 0 (0.0%) | 0 (0.0%) |
| 18 to 34 Years | 0 (0.0%) | 0 (0.0%) |
| 35 to 64 Years | 60 (27.4%) | 85 (51.5%) |
| 65 to 74 Years | 19 (54.3%) | 14 (51.8%) |
| 75 Years and over | 0 (0.0%) | 0 (0.0%) |
Disability Class: Vision Difficulty
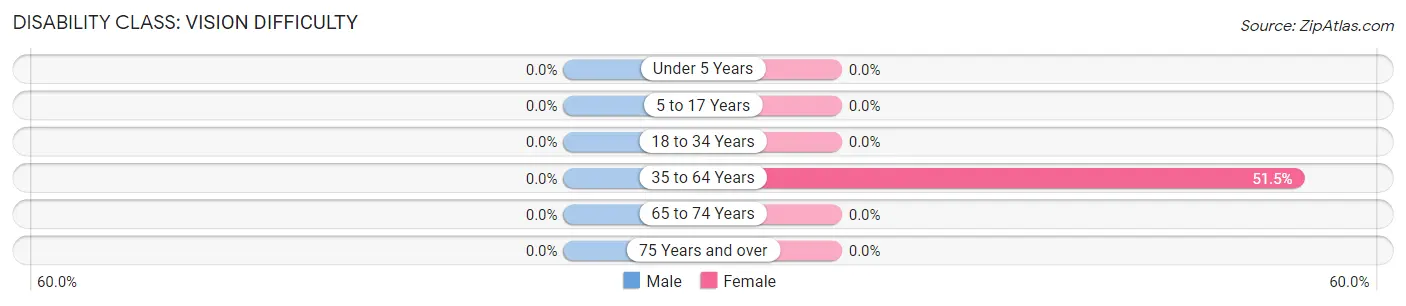
| Age Bracket | Male | Female |
| Under 5 Years | 0 (0.0%) | 0 (0.0%) |
| 5 to 17 Years | 0 (0.0%) | 0 (0.0%) |
| 18 to 34 Years | 0 (0.0%) | 0 (0.0%) |
| 35 to 64 Years | 0 (0.0%) | 85 (51.5%) |
| 65 to 74 Years | 0 (0.0%) | 0 (0.0%) |
| 75 Years and over | 0 (0.0%) | 0 (0.0%) |
Disability Class: Cognitive Difficulty
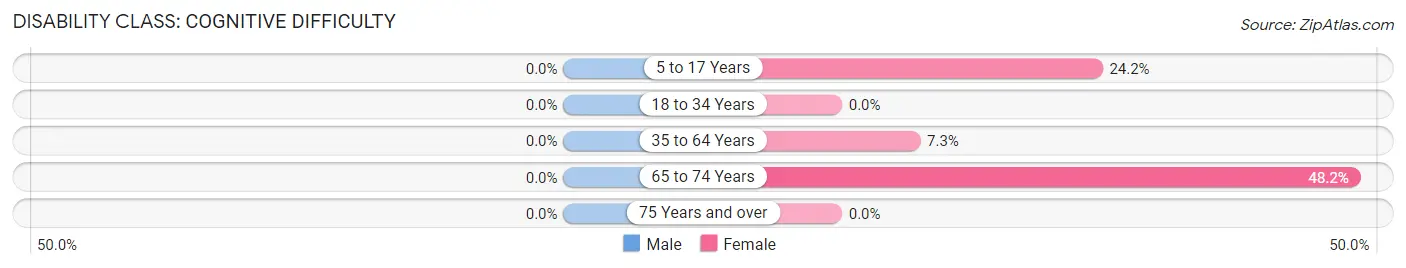
| Age Bracket | Male | Female |
| 5 to 17 Years | 0 (0.0%) | 15 (24.2%) |
| 18 to 34 Years | 0 (0.0%) | 0 (0.0%) |
| 35 to 64 Years | 0 (0.0%) | 12 (7.3%) |
| 65 to 74 Years | 0 (0.0%) | 13 (48.1%) |
| 75 Years and over | 0 (0.0%) | 0 (0.0%) |
Disability Class: Ambulatory Difficulty
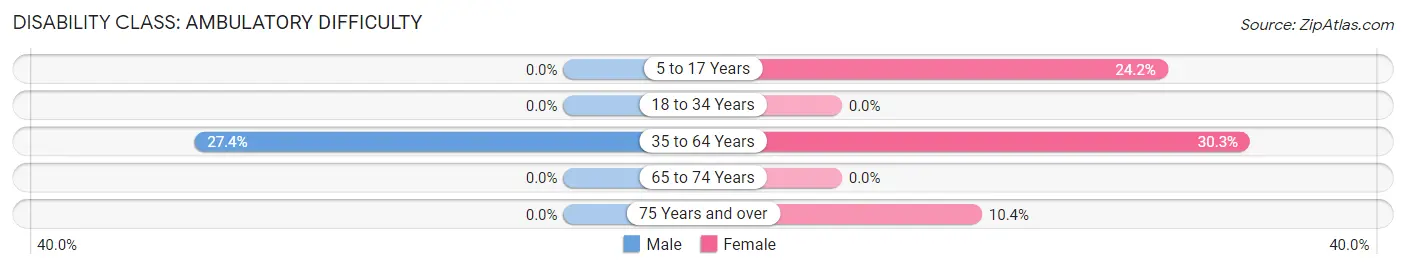
| Age Bracket | Male | Female |
| 5 to 17 Years | 0 (0.0%) | 15 (24.2%) |
| 18 to 34 Years | 0 (0.0%) | 0 (0.0%) |
| 35 to 64 Years | 60 (27.4%) | 50 (30.3%) |
| 65 to 74 Years | 0 (0.0%) | 0 (0.0%) |
| 75 Years and over | 0 (0.0%) | 13 (10.4%) |
Disability Class: Self-Care Difficulty
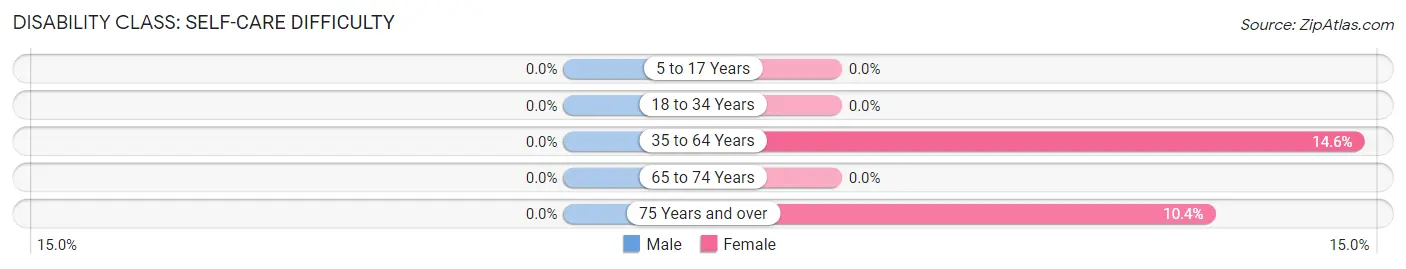
| Age Bracket | Male | Female |
| 5 to 17 Years | 0 (0.0%) | 0 (0.0%) |
| 18 to 34 Years | 0 (0.0%) | 0 (0.0%) |
| 35 to 64 Years | 0 (0.0%) | 24 (14.5%) |
| 65 to 74 Years | 0 (0.0%) | 0 (0.0%) |
| 75 Years and over | 0 (0.0%) | 13 (10.4%) |
Technology Access in Whitley City
Computing Device Access in Whitley City
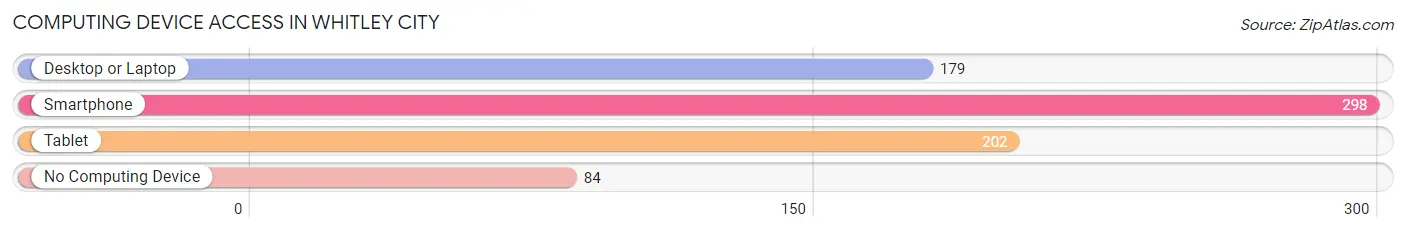
| Device Type | # Households | % Households |
| Desktop or Laptop | 179 | 44.2% |
| Smartphone | 298 | 73.6% |
| Tablet | 202 | 49.9% |
| No Computing Device | 84 | 20.7% |
| Total | 405 | 100.0% |
Internet Access in Whitley City
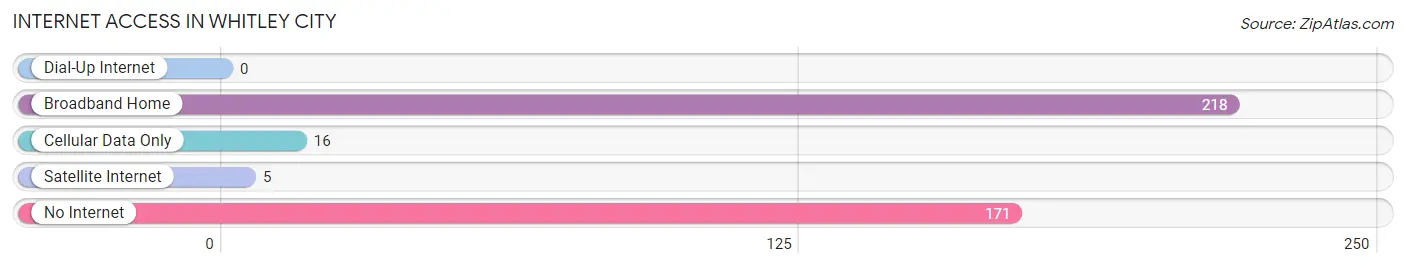
| Internet Type | # Households | % Households |
| Dial-Up Internet | 0 | 0.0% |
| Broadband Home | 218 | 53.8% |
| Cellular Data Only | 16 | 4.0% |
| Satellite Internet | 5 | 1.2% |
| No Internet | 171 | 42.2% |
| Total | 405 | 100.0% |
Whitley City Summary
Whitley City is a small town located in McCreary County, Kentucky. It is situated in the southeastern part of the state, near the Tennessee border. The town is part of the larger area known as the Cumberland Plateau, which is known for its rolling hills and lush forests. The population of Whitley City was 1,845 in the 2010 census, making it the largest town in McCreary County.
Geography
Whitley City is located in the southeastern part of Kentucky, near the Tennessee border. It is situated in the Cumberland Plateau, which is known for its rolling hills and lush forests. The town is located at the intersection of US 27 and KY 92. The town is surrounded by the Daniel Boone National Forest, which provides a variety of recreational activities. The town is also located near the Big South Fork National River and Recreation Area, which is a popular destination for camping, fishing, and hiking.
Climate
Whitley City has a humid subtropical climate, with hot summers and mild winters. The average high temperature in the summer is around 90 degrees Fahrenheit, while the average low temperature in the winter is around 30 degrees Fahrenheit. The town receives an average of 48 inches of precipitation per year, with most of it falling in the spring and summer months.
Demographics
As of the 2010 census, the population of Whitley City was 1,845. The racial makeup of the town was 95.2% White, 2.2% African American, 0.3% Native American, 0.2% Asian, 0.1% Pacific Islander, 0.7% from other races, and 1.3% from two or more races. Hispanic or Latino of any race were 1.7% of the population.
Economy
The economy of Whitley City is largely based on agriculture and tourism. The town is home to several farms, which produce a variety of crops, including corn, soybeans, and tobacco. The town is also home to several tourist attractions, including the Big South Fork National River and Recreation Area, which is a popular destination for camping, fishing, and hiking. The town is also home to several restaurants, shops, and other businesses.
History
Whitley City was founded in 1883 by a group of settlers from Whitley County, Kentucky. The town was named after the county, and was originally intended to be a trading post for the local farmers. The town quickly grew, and by the early 1900s, it had become a thriving community. The town was home to several businesses, including a general store, a blacksmith shop, and a post office.
In the early 1900s, the town was also home to several churches, including the First Baptist Church, which was founded in 1883. The town also had a school, which was established in 1884. The school was later replaced by a larger school, which was built in the 1920s.
In the late 1900s, the town began to decline, as many of the businesses and residents moved away. The town was eventually incorporated in 1972, and has since seen a resurgence in population and economic activity. Today, Whitley City is a small but vibrant town, with a variety of businesses and attractions.
Common Questions
What is Per Capita Income in Whitley City?
Per Capita income in Whitley City is $12,632.
What is the Median Household income in Whitley City?
Median Household Income in Whitley City is $22,702.
What is Family Income Deficit in Whitley City?
Family Income Deficit in Whitley City is $14,390.
Families that are below poverty line in Whitley City earn $14,390 less on average than the poverty threshold level.
What is Inequality or Gini Index in Whitley City?
Inequality or Gini Index in Whitley City is 0.47.
What is the Total Population of Whitley City?
Total Population of Whitley City is 1,148.
What is the Total Male Population of Whitley City?
Total Male Population of Whitley City is 664.
What is the Total Female Population of Whitley City?
Total Female Population of Whitley City is 484.
What is the Ratio of Males per 100 Females in Whitley City?
There are 137.19 Males per 100 Females in Whitley City.
What is the Ratio of Females per 100 Males in Whitley City?
There are 72.89 Females per 100 Males in Whitley City.
What is the Median Population Age in Whitley City?
Median Population Age in Whitley City is 37.9 Years.
What is the Average Family Size in Whitley City
Average Family Size in Whitley City is 4.7 People.
What is the Average Household Size in Whitley City
Average Household Size in Whitley City is 2.7 People.
How Large is the Labor Force in Whitley City?
There are 284 People in the Labor Forcein in Whitley City.
What is the Percentage of People in the Labor Force in Whitley City?
33.1% of People are in the Labor Force in Whitley City.