Irvine, KY Map & Demographics
Irvine Map
Irvine Overview
$19,277
PER CAPITA INCOME
$49,438
AVG FAMILY INCOME
$31,359
AVG HOUSEHOLD INCOME
13.0%
WAGE / INCOME GAP [ % ]
87.0¢/ $1
WAGE / INCOME GAP [ $ ]
0.46
INEQUALITY / GINI INDEX
2,785
TOTAL POPULATION
1,262
MALE POPULATION
1,523
FEMALE POPULATION
82.86
MALES / 100 FEMALES
120.68
FEMALES / 100 MALES
40.0
MEDIAN AGE
3.3
AVG FAMILY SIZE
2.3
AVG HOUSEHOLD SIZE
988
LABOR FORCE [ PEOPLE ]
46.1%
PERCENT IN LABOR FORCE
11.6%
UNEMPLOYMENT RATE
Irvine Zip Codes
Irvine Area Codes
Income in Irvine
Income Overview in Irvine
Per Capita Income in Irvine is $19,277, while median incomes of families and households are $49,438 and $31,359 respectively.
| Characteristic | Number | Measure |
| Per Capita Income | 2,785 | $19,277 |
| Median Family Income | 640 | $49,438 |
| Mean Family Income | 640 | $58,380 |
| Median Household Income | 1,186 | $31,359 |
| Mean Household Income | 1,186 | $44,823 |
| Income Deficit | 640 | $0 |
| Wage / Income Gap (%) | 2,785 | 12.95% |
| Wage / Income Gap ($) | 2,785 | 87.05¢ per $1 |
| Gini / Inequality Index | 2,785 | 0.46 |
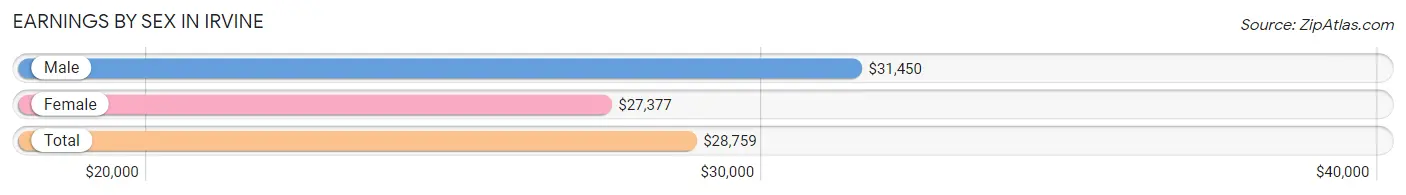
Earnings by Sex in Irvine
Average Earnings in Irvine are $28,759, $31,450 for men and $27,377 for women, a difference of 13.0%.
| Sex | Number | Average Earnings |
| Male | 395 (40.6%) | $31,450 |
| Female | 577 (59.4%) | $27,377 |
| Total | 972 (100.0%) | $28,759 |
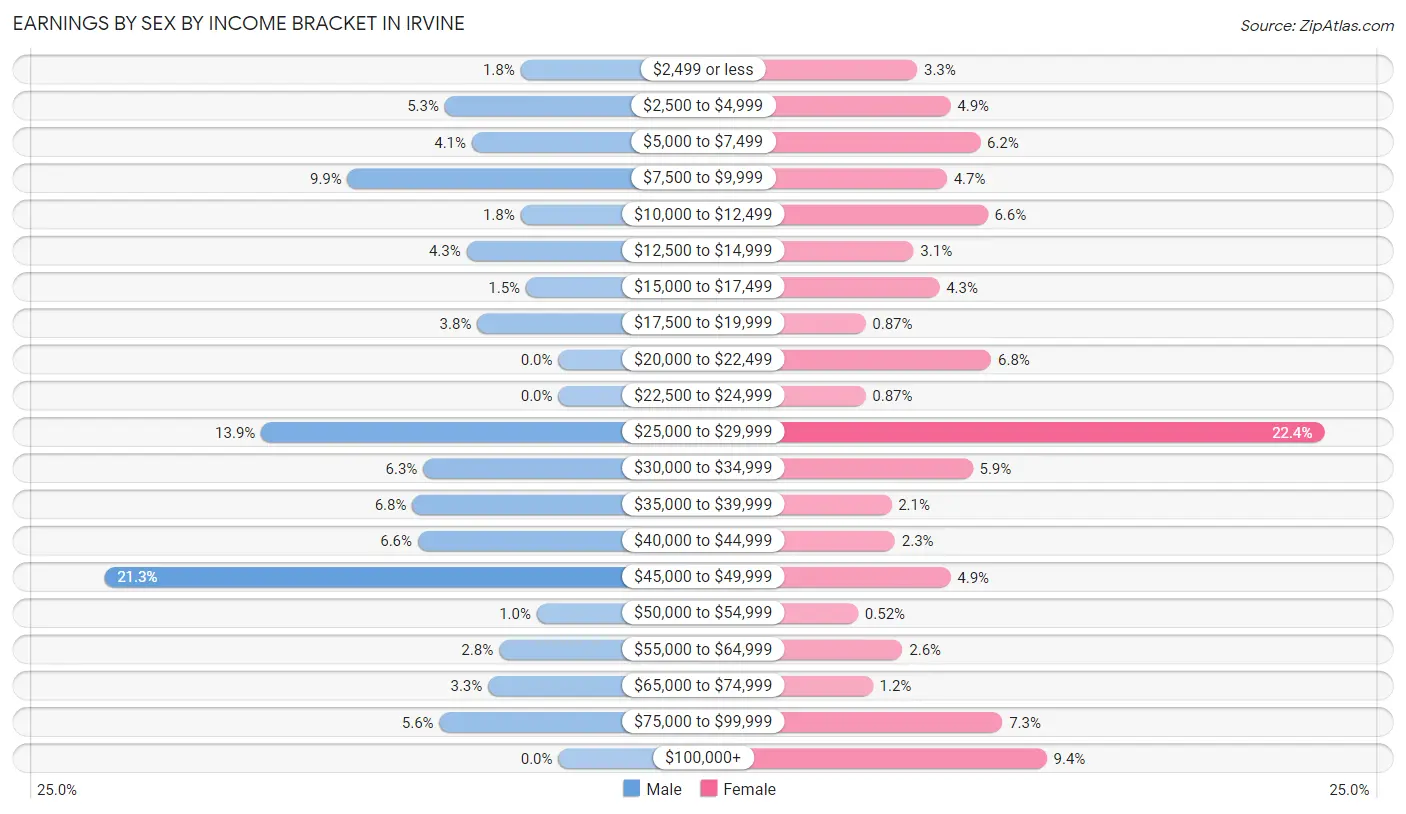
Earnings by Sex by Income Bracket in Irvine
The most common earnings brackets in Irvine are $45,000 to $49,999 for men (84 | 21.3%) and $25,000 to $29,999 for women (129 | 22.4%).
| Income | Male | Female |
| $2,499 or less | 7 (1.8%) | 19 (3.3%) |
| $2,500 to $4,999 | 21 (5.3%) | 28 (4.9%) |
| $5,000 to $7,499 | 16 (4.1%) | 36 (6.2%) |
| $7,500 to $9,999 | 39 (9.9%) | 27 (4.7%) |
| $10,000 to $12,499 | 7 (1.8%) | 38 (6.6%) |
| $12,500 to $14,999 | 17 (4.3%) | 18 (3.1%) |
| $15,000 to $17,499 | 6 (1.5%) | 25 (4.3%) |
| $17,500 to $19,999 | 15 (3.8%) | 5 (0.9%) |
| $20,000 to $22,499 | 0 (0.0%) | 39 (6.8%) |
| $22,500 to $24,999 | 0 (0.0%) | 5 (0.9%) |
| $25,000 to $29,999 | 55 (13.9%) | 129 (22.4%) |
| $30,000 to $34,999 | 25 (6.3%) | 34 (5.9%) |
| $35,000 to $39,999 | 27 (6.8%) | 12 (2.1%) |
| $40,000 to $44,999 | 26 (6.6%) | 13 (2.2%) |
| $45,000 to $49,999 | 84 (21.3%) | 28 (4.9%) |
| $50,000 to $54,999 | 4 (1.0%) | 3 (0.5%) |
| $55,000 to $64,999 | 11 (2.8%) | 15 (2.6%) |
| $65,000 to $74,999 | 13 (3.3%) | 7 (1.2%) |
| $75,000 to $99,999 | 22 (5.6%) | 42 (7.3%) |
| $100,000+ | 0 (0.0%) | 54 (9.4%) |
| Total | 395 (100.0%) | 577 (100.0%) |
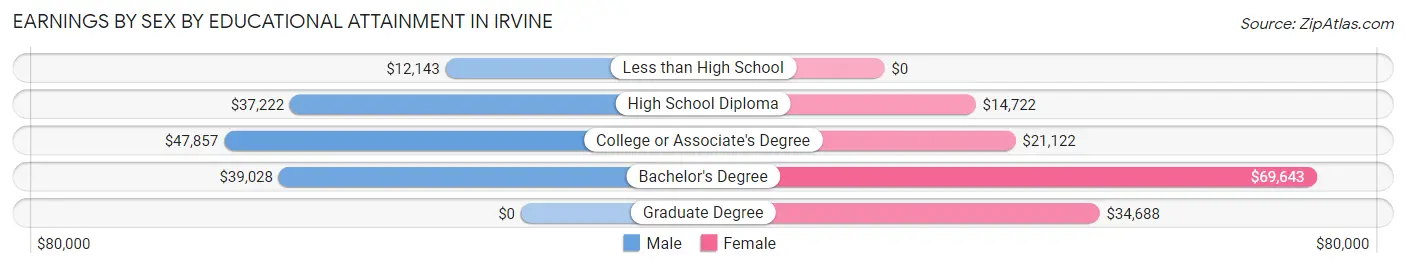
Earnings by Sex by Educational Attainment in Irvine
Average earnings in Irvine are $39,792 for men and $27,651 for women, a difference of 30.5%. Men with an educational attainment of college or associate's degree enjoy the highest average annual earnings of $47,857, while those with less than high school education earn the least with $12,143. Women with an educational attainment of bachelor's degree earn the most with the average annual earnings of $69,643, while those with high school diploma education have the smallest earnings of $14,722.
| Educational Attainment | Male Income | Female Income |
| Less than High School | $12,143 | $0 |
| High School Diploma | $37,222 | $14,722 |
| College or Associate's Degree | $47,857 | $21,122 |
| Bachelor's Degree | $39,028 | $69,643 |
| Graduate Degree | - | - |
| Total | $39,792 | $27,651 |
Family Income in Irvine
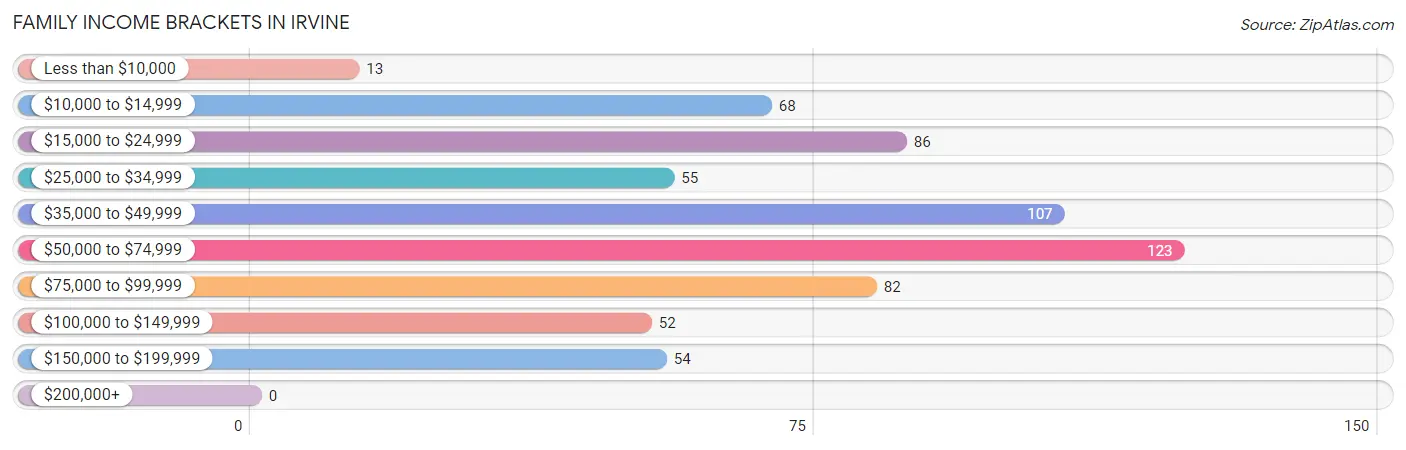
Family Income Brackets in Irvine
According to the Irvine family income data, there are 123 families falling into the $50,000 to $74,999 income range, which is the most common income bracket and makes up 19.2% of all families.
| Income Bracket | # Families | % Families |
| Less than $10,000 | 13 | 2.0% |
| $10,000 to $14,999 | 68 | 10.6% |
| $15,000 to $24,999 | 86 | 13.4% |
| $25,000 to $34,999 | 55 | 8.6% |
| $35,000 to $49,999 | 107 | 16.7% |
| $50,000 to $74,999 | 123 | 19.2% |
| $75,000 to $99,999 | 82 | 12.8% |
| $100,000 to $149,999 | 52 | 8.1% |
| $150,000 to $199,999 | 54 | 8.4% |
| $200,000+ | 0 | 0.0% |
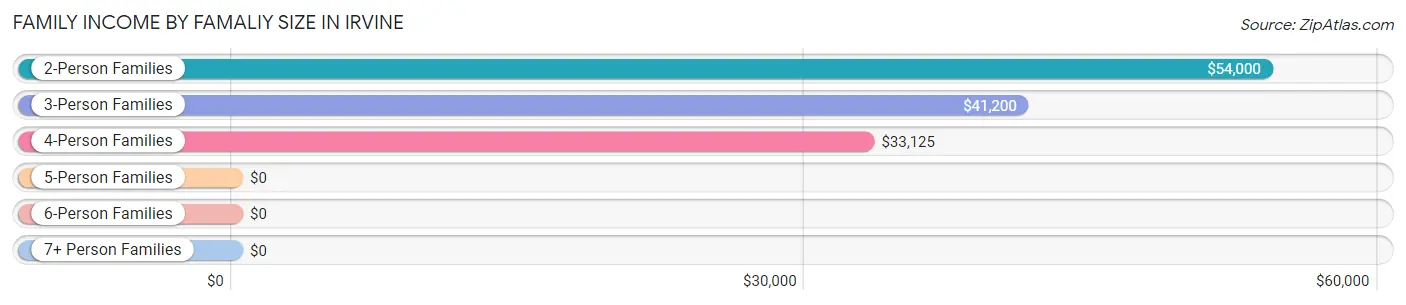
Family Income by Famaliy Size in Irvine
2-person families (314 | 49.1%) account for the highest median family income in Irvine with $54,000 per family, while 2-person families (314 | 49.1%) have the highest median income of $27,000 per family member.
| Income Bracket | # Families | Median Income |
| 2-Person Families | 314 (49.1%) | $54,000 |
| 3-Person Families | 110 (17.2%) | $41,200 |
| 4-Person Families | 89 (13.9%) | $33,125 |
| 5-Person Families | 95 (14.8%) | $0 |
| 6-Person Families | 32 (5.0%) | $0 |
| 7+ Person Families | 0 (0.0%) | $0 |
| Total | 640 (100.0%) | $49,438 |
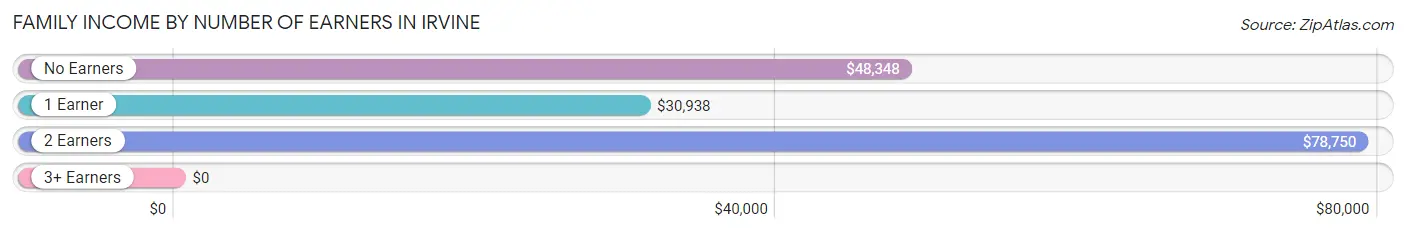
Family Income by Number of Earners in Irvine
| Number of Earners | # Families | Median Income |
| No Earners | 157 (24.5%) | $48,348 |
| 1 Earner | 274 (42.8%) | $30,938 |
| 2 Earners | 204 (31.9%) | $78,750 |
| 3+ Earners | 5 (0.8%) | $0 |
| Total | 640 (100.0%) | $49,438 |
Household Income in Irvine
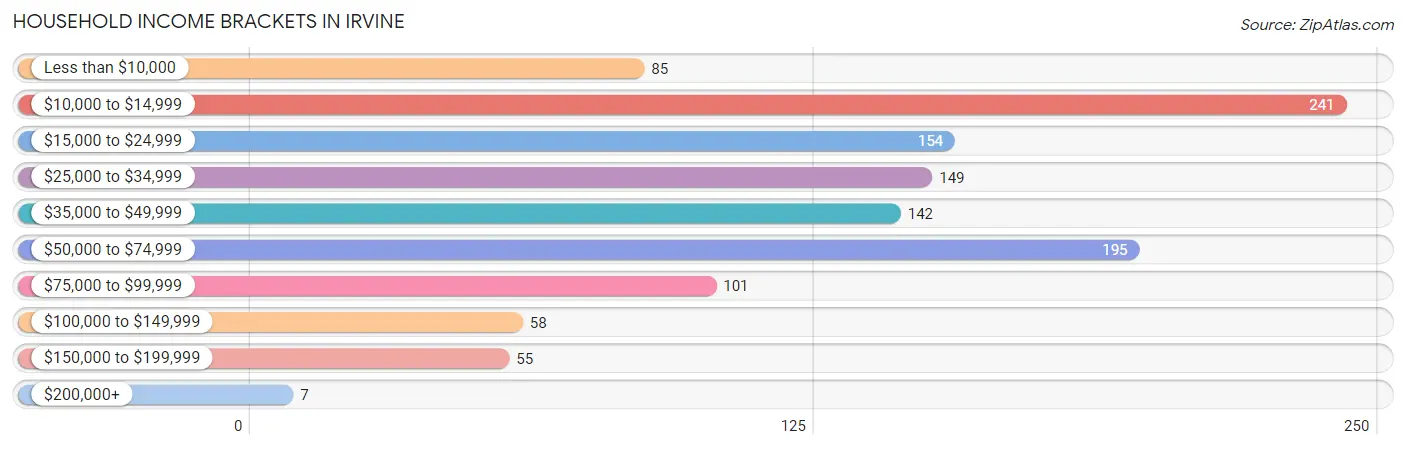
Household Income Brackets in Irvine
With 241 households falling in the category, the $10,000 to $14,999 income range is the most frequent in Irvine, accounting for 20.3% of all households. In contrast, only 7 households (0.6%) fall into the $200,000+ income bracket, making it the least populous group.
| Income Bracket | # Households | % Households |
| Less than $10,000 | 85 | 7.2% |
| $10,000 to $14,999 | 241 | 20.3% |
| $15,000 to $24,999 | 154 | 13.0% |
| $25,000 to $34,999 | 149 | 12.6% |
| $35,000 to $49,999 | 142 | 12.0% |
| $50,000 to $74,999 | 195 | 16.4% |
| $75,000 to $99,999 | 101 | 8.5% |
| $100,000 to $149,999 | 58 | 4.9% |
| $150,000 to $199,999 | 55 | 4.6% |
| $200,000+ | 7 | 0.6% |
Household Income by Householder Age in Irvine
The median household income in Irvine is $31,359, with the highest median household income of $55,208 found in the 25 to 44 years age bracket for the primary householder. A total of 338 households (28.5%) fall into this category. Meanwhile, the 15 to 24 years age bracket for the primary householder has the lowest median household income of $0, with 59 households (5.0%) in this group.
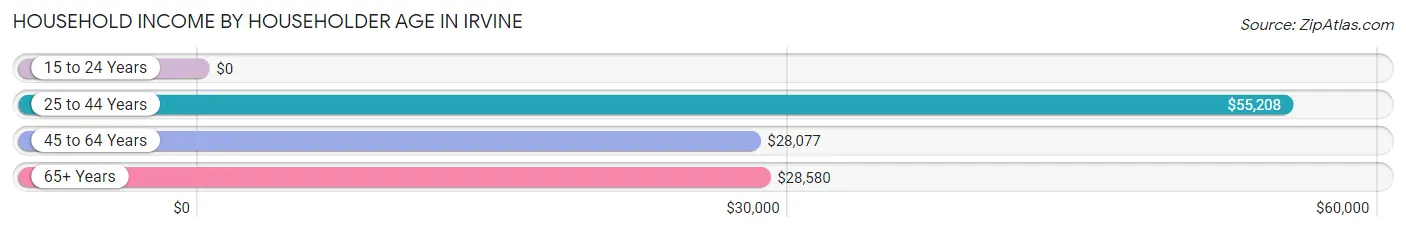
| Income Bracket | # Households | Median Income |
| 15 to 24 Years | 59 (5.0%) | $0 |
| 25 to 44 Years | 338 (28.5%) | $55,208 |
| 45 to 64 Years | 414 (34.9%) | $28,077 |
| 65+ Years | 375 (31.6%) | $28,580 |
| Total | 1,186 (100.0%) | $31,359 |
Poverty in Irvine
Income Below Poverty by Sex and Age in Irvine
With 28.5% poverty level for males and 35.7% for females among the residents of Irvine, 16 and 17 year old males and 16 and 17 year old females are the most vulnerable to poverty, with 36 males (56.2%) and 28 females (75.7%) in their respective age groups living below the poverty level.
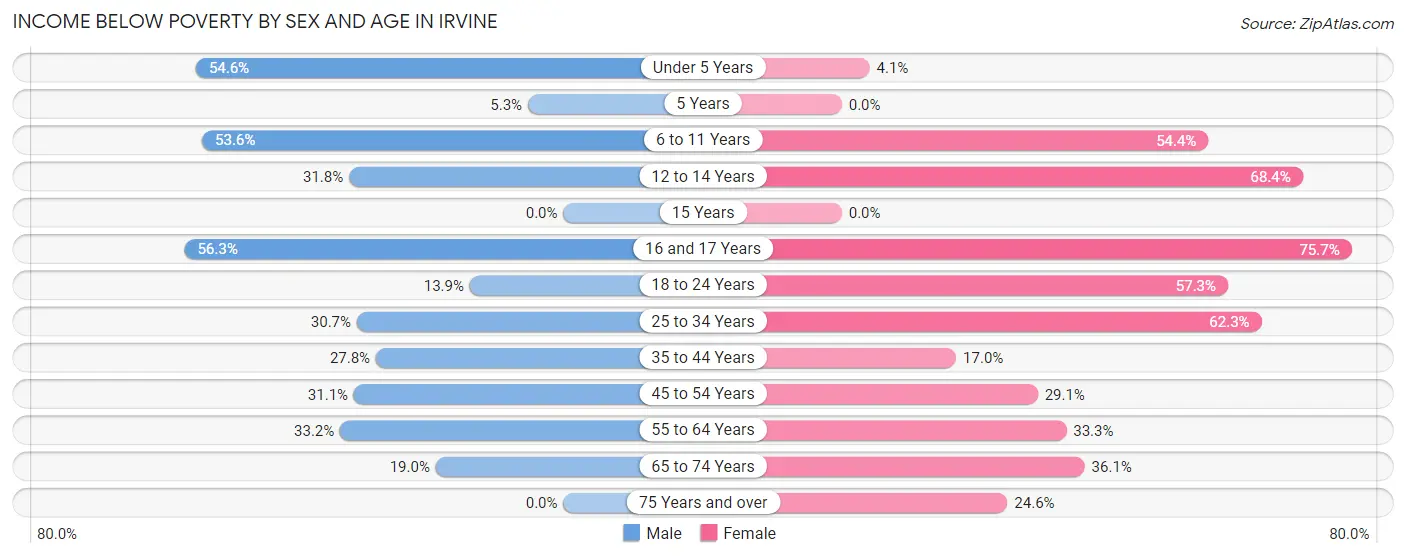
| Age Bracket | Male | Female |
| Under 5 Years | 30 (54.5%) | 5 (4.1%) |
| 5 Years | 8 (5.3%) | 0 (0.0%) |
| 6 to 11 Years | 59 (53.6%) | 68 (54.4%) |
| 12 to 14 Years | 7 (31.8%) | 26 (68.4%) |
| 15 Years | 0 (0.0%) | 0 (0.0%) |
| 16 and 17 Years | 36 (56.2%) | 28 (75.7%) |
| 18 to 24 Years | 10 (13.9%) | 47 (57.3%) |
| 25 to 34 Years | 42 (30.7%) | 114 (62.3%) |
| 35 to 44 Years | 32 (27.8%) | 45 (17.0%) |
| 45 to 54 Years | 51 (31.1%) | 32 (29.1%) |
| 55 to 64 Years | 60 (33.2%) | 74 (33.3%) |
| 65 to 74 Years | 18 (19.0%) | 75 (36.1%) |
| 75 Years and over | 0 (0.0%) | 30 (24.6%) |
| Total | 353 (28.5%) | 544 (35.7%) |
Income Above Poverty by Sex and Age in Irvine
According to the poverty statistics in Irvine, males aged 15 years and females aged 15 years are the age groups that are most secure financially, with 100.0% of males and 100.0% of females in these age groups living above the poverty line.
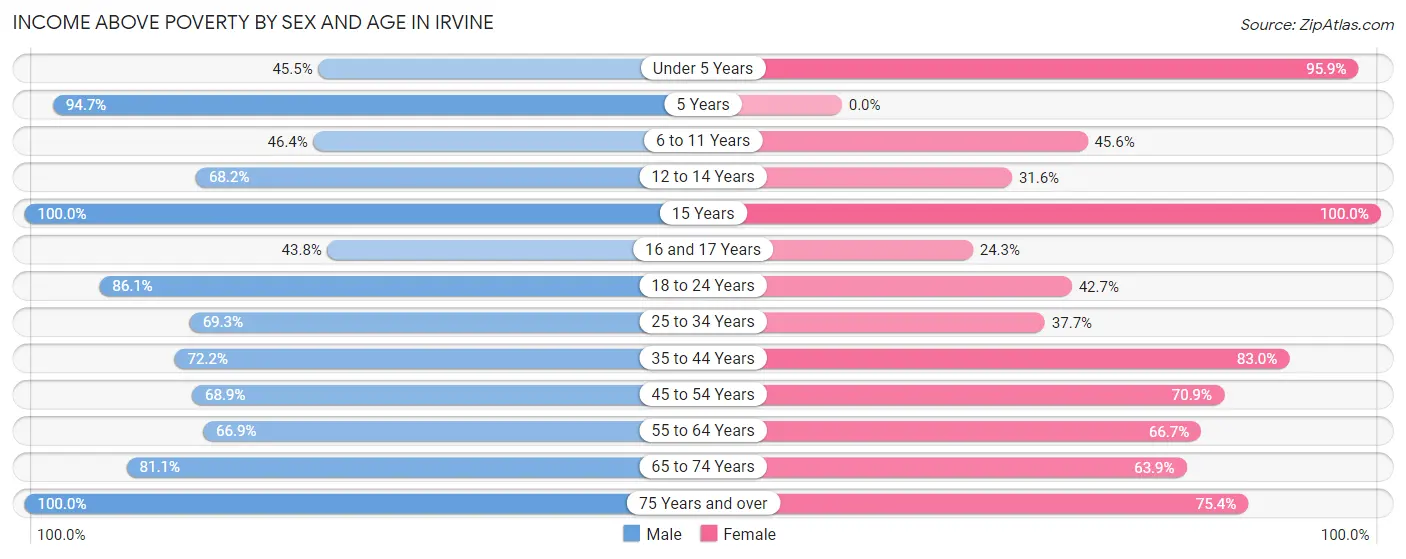
| Age Bracket | Male | Female |
| Under 5 Years | 25 (45.5%) | 116 (95.9%) |
| 5 Years | 144 (94.7%) | 0 (0.0%) |
| 6 to 11 Years | 51 (46.4%) | 57 (45.6%) |
| 12 to 14 Years | 15 (68.2%) | 12 (31.6%) |
| 15 Years | 8 (100.0%) | 10 (100.0%) |
| 16 and 17 Years | 28 (43.8%) | 9 (24.3%) |
| 18 to 24 Years | 62 (86.1%) | 35 (42.7%) |
| 25 to 34 Years | 95 (69.3%) | 69 (37.7%) |
| 35 to 44 Years | 83 (72.2%) | 220 (83.0%) |
| 45 to 54 Years | 113 (68.9%) | 78 (70.9%) |
| 55 to 64 Years | 121 (66.8%) | 148 (66.7%) |
| 65 to 74 Years | 77 (81.0%) | 133 (63.9%) |
| 75 Years and over | 62 (100.0%) | 92 (75.4%) |
| Total | 884 (71.5%) | 979 (64.3%) |
Income Below Poverty Among Married-Couple Families in Irvine
The poverty statistics for married-couple families in Irvine show that 18.2% or 79 of the total 433 families live below the poverty line. Families with 1 or 2 children have the highest poverty rate of 38.5%, comprising of 55 families. On the other hand, families with 3 or 4 children have the lowest poverty rate of 7.6%, which includes 5 families.
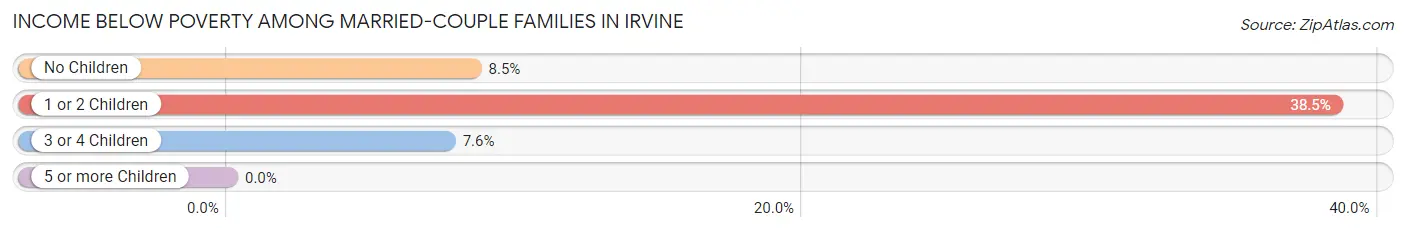
| Children | Above Poverty | Below Poverty |
| No Children | 205 (91.5%) | 19 (8.5%) |
| 1 or 2 Children | 88 (61.5%) | 55 (38.5%) |
| 3 or 4 Children | 61 (92.4%) | 5 (7.6%) |
| 5 or more Children | 0 (0.0%) | 0 (0.0%) |
| Total | 354 (81.8%) | 79 (18.2%) |
Income Below Poverty Among Single-Parent Households in Irvine
According to the poverty data in Irvine, 16.9% or 11 single-father households and 62.7% or 89 single-mother households are living below the poverty line. Among single-father households, those with 1 or 2 children have the highest poverty rate, with 11 households (24.4%) experiencing poverty. Likewise, among single-mother households, those with 3 or 4 children have the highest poverty rate, with 31 households (100.0%) falling below the poverty line.
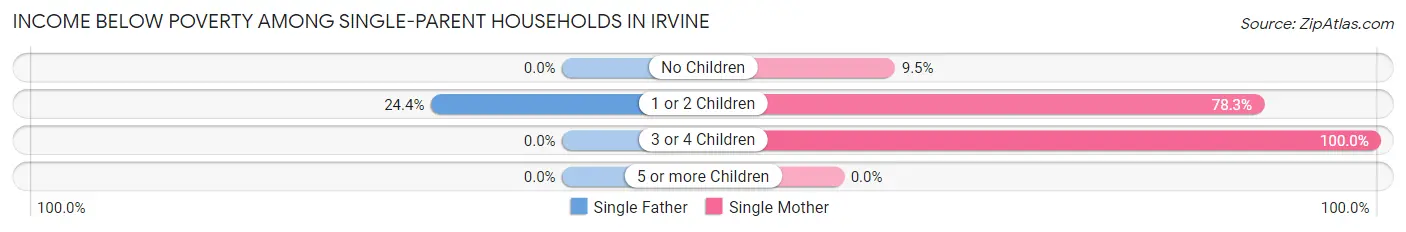
| Children | Single Father | Single Mother |
| No Children | 0 (0.0%) | 4 (9.5%) |
| 1 or 2 Children | 11 (24.4%) | 54 (78.3%) |
| 3 or 4 Children | 0 (0.0%) | 31 (100.0%) |
| 5 or more Children | 0 (0.0%) | 0 (0.0%) |
| Total | 11 (16.9%) | 89 (62.7%) |
Income Below Poverty Among Married-Couple vs Single-Parent Households in Irvine
The poverty data for Irvine shows that 79 of the married-couple family households (18.2%) and 100 of the single-parent households (48.3%) are living below the poverty level. Within the married-couple family households, those with 1 or 2 children have the highest poverty rate, with 55 households (38.5%) falling below the poverty line. Among the single-parent households, those with 3 or 4 children have the highest poverty rate, with 31 household (72.1%) living below poverty.
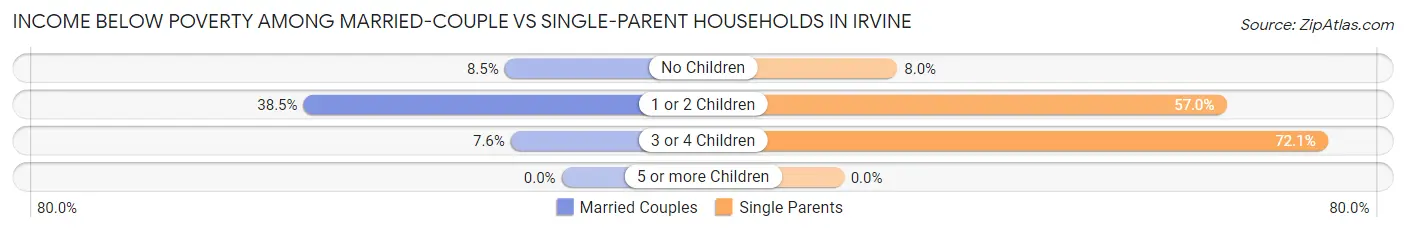
| Children | Married-Couple Families | Single-Parent Households |
| No Children | 19 (8.5%) | 4 (8.0%) |
| 1 or 2 Children | 55 (38.5%) | 65 (57.0%) |
| 3 or 4 Children | 5 (7.6%) | 31 (72.1%) |
| 5 or more Children | 0 (0.0%) | 0 (0.0%) |
| Total | 79 (18.2%) | 100 (48.3%) |
Race in Irvine
The most populous races in Irvine are White / Caucasian (2,665 | 95.7%), Hispanic or Latino (117 | 4.2%), and Two or more Races (103 | 3.7%).
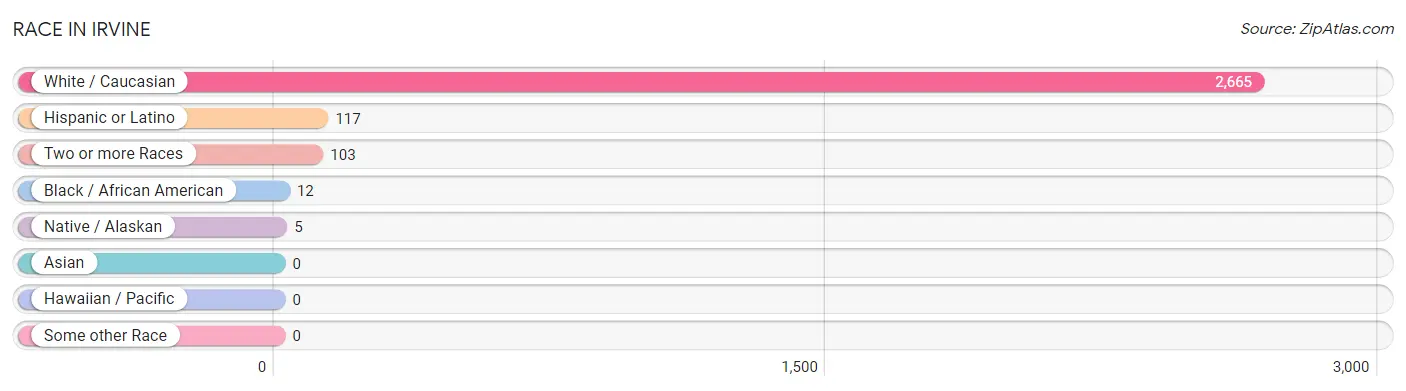
| Race | # Population | % Population |
| Asian | 0 | 0.0% |
| Black / African American | 12 | 0.4% |
| Hawaiian / Pacific | 0 | 0.0% |
| Hispanic or Latino | 117 | 4.2% |
| Native / Alaskan | 5 | 0.2% |
| White / Caucasian | 2,665 | 95.7% |
| Two or more Races | 103 | 3.7% |
| Some other Race | 0 | 0.0% |
| Total | 2,785 | 100.0% |
Ancestry in Irvine
The most populous ancestries reported in Irvine are American (390 | 14.0%), Irish (311 | 11.2%), German (279 | 10.0%), English (246 | 8.8%), and Cuban (98 | 3.5%), together accounting for 47.5% of all Irvine residents.
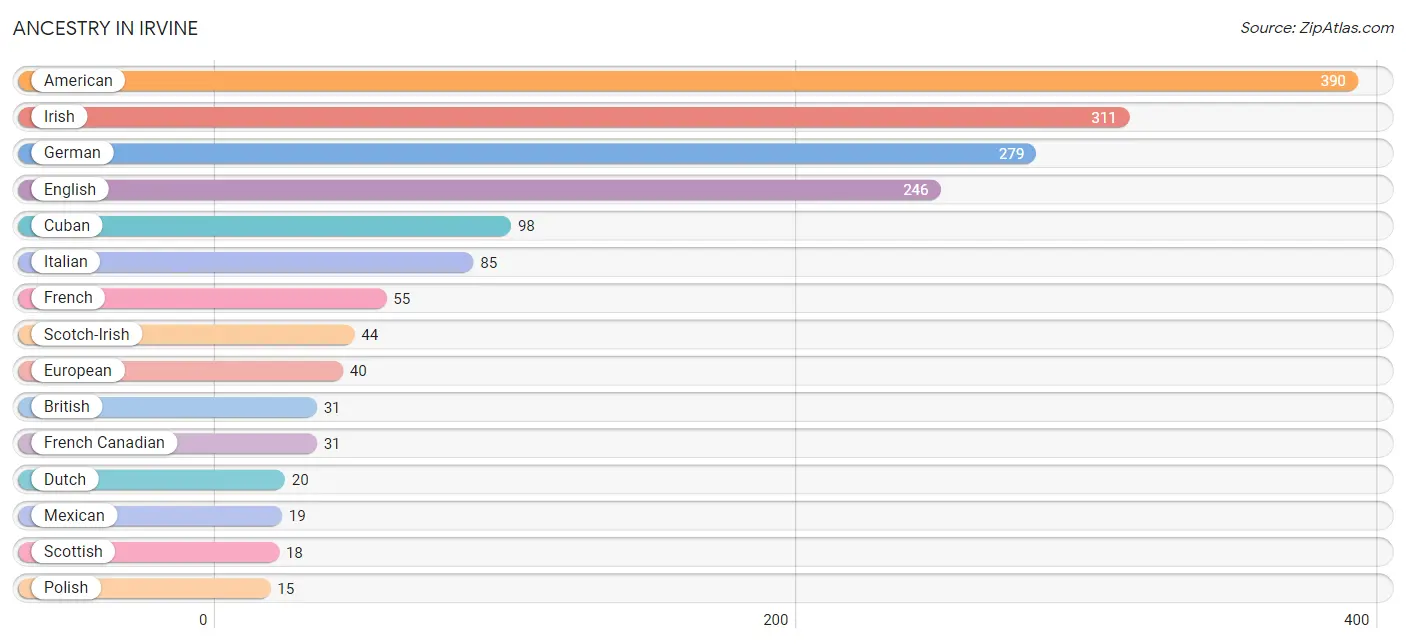
| Ancestry | # Population | % Population |
| American | 390 | 14.0% |
| British | 31 | 1.1% |
| Cherokee | 5 | 0.2% |
| Croatian | 8 | 0.3% |
| Cuban | 98 | 3.5% |
| Dutch | 20 | 0.7% |
| English | 246 | 8.8% |
| European | 40 | 1.4% |
| French | 55 | 2.0% |
| French Canadian | 31 | 1.1% |
| German | 279 | 10.0% |
| Irish | 311 | 11.2% |
| Italian | 85 | 3.0% |
| Mexican | 19 | 0.7% |
| Polish | 15 | 0.5% |
| Scotch-Irish | 44 | 1.6% |
| Scottish | 18 | 0.6% | View All 17 Rows |
Immigrants in Irvine
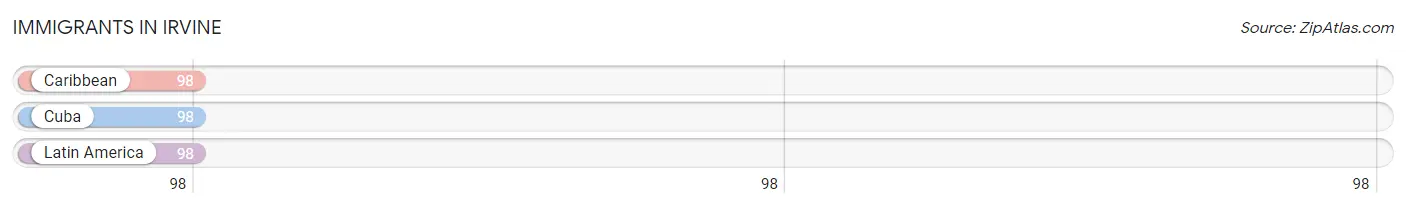
The most numerous immigrant groups reported in Irvine came from Caribbean (98 | 3.5%), Cuba (98 | 3.5%), and Latin America (98 | 3.5%), together accounting for 10.6% of all Irvine residents.
| Immigration Origin | # Population | % Population |
| Caribbean | 98 | 3.5% |
| Cuba | 98 | 3.5% |
| Latin America | 98 | 3.5% | View All 3 Rows |
Sex and Age in Irvine
Sex and Age in Irvine
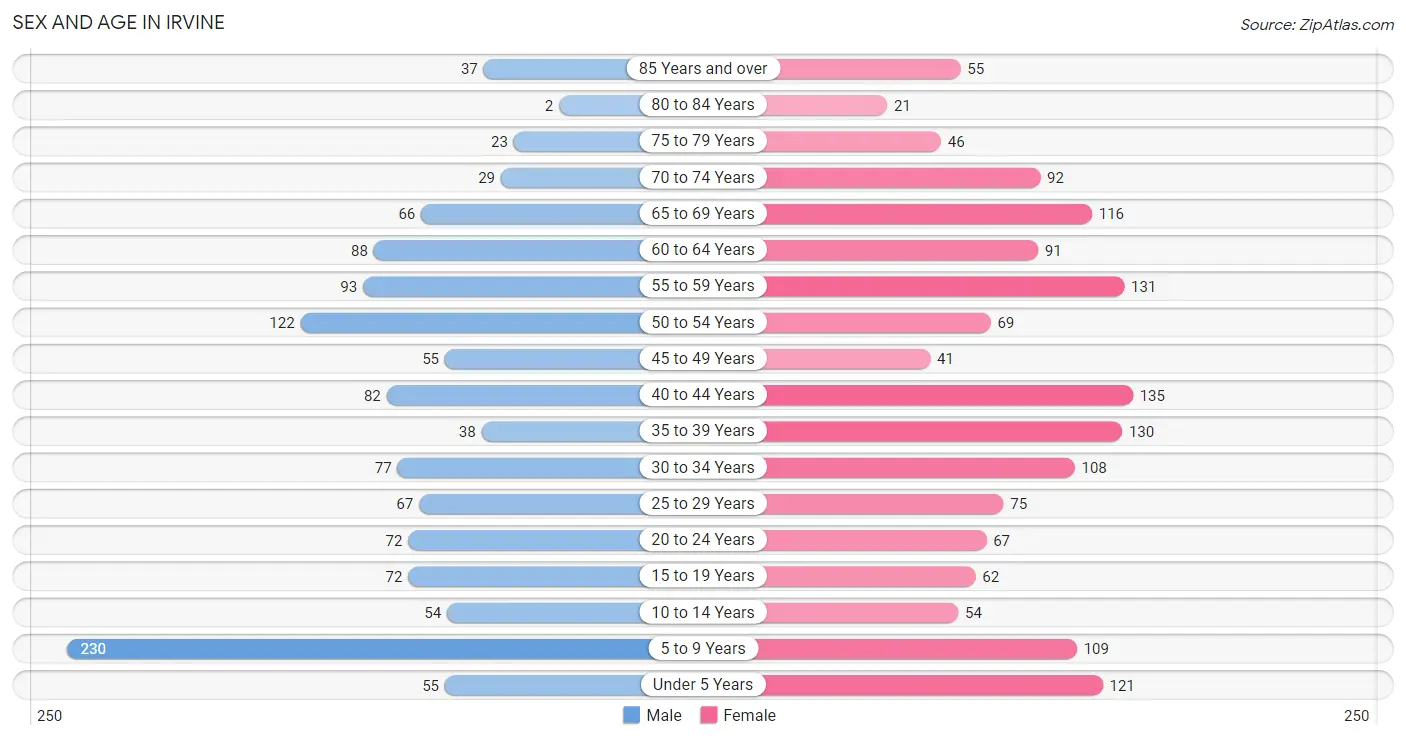
The most populous age groups in Irvine are 5 to 9 Years (230 | 18.2%) for men and 40 to 44 Years (135 | 8.9%) for women.
| Age Bracket | Male | Female |
| Under 5 Years | 55 (4.4%) | 121 (7.9%) |
| 5 to 9 Years | 230 (18.2%) | 109 (7.2%) |
| 10 to 14 Years | 54 (4.3%) | 54 (3.5%) |
| 15 to 19 Years | 72 (5.7%) | 62 (4.1%) |
| 20 to 24 Years | 72 (5.7%) | 67 (4.4%) |
| 25 to 29 Years | 67 (5.3%) | 75 (4.9%) |
| 30 to 34 Years | 77 (6.1%) | 108 (7.1%) |
| 35 to 39 Years | 38 (3.0%) | 130 (8.5%) |
| 40 to 44 Years | 82 (6.5%) | 135 (8.9%) |
| 45 to 49 Years | 55 (4.4%) | 41 (2.7%) |
| 50 to 54 Years | 122 (9.7%) | 69 (4.5%) |
| 55 to 59 Years | 93 (7.4%) | 131 (8.6%) |
| 60 to 64 Years | 88 (7.0%) | 91 (6.0%) |
| 65 to 69 Years | 66 (5.2%) | 116 (7.6%) |
| 70 to 74 Years | 29 (2.3%) | 92 (6.0%) |
| 75 to 79 Years | 23 (1.8%) | 46 (3.0%) |
| 80 to 84 Years | 2 (0.2%) | 21 (1.4%) |
| 85 Years and over | 37 (2.9%) | 55 (3.6%) |
| Total | 1,262 (100.0%) | 1,523 (100.0%) |
Families and Households in Irvine
Median Family Size in Irvine
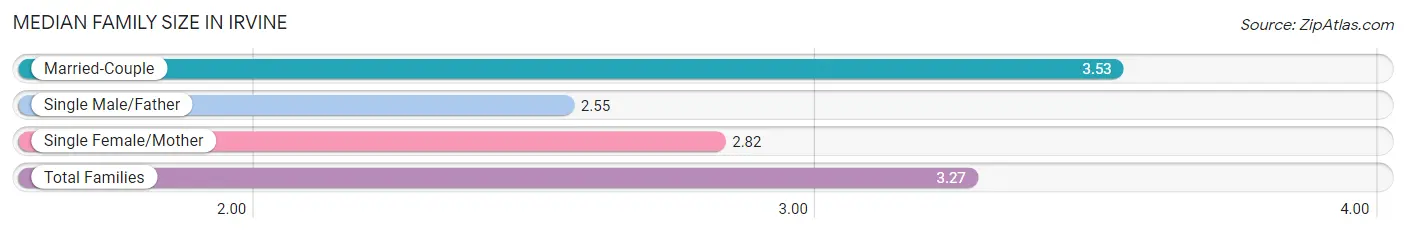
The median family size in Irvine is 3.27 persons per family, with married-couple families (433 | 67.7%) accounting for the largest median family size of 3.53 persons per family. On the other hand, single male/father families (65 | 10.2%) represent the smallest median family size with 2.55 persons per family.
| Family Type | # Families | Family Size |
| Married-Couple | 433 (67.7%) | 3.53 |
| Single Male/Father | 65 (10.2%) | 2.55 |
| Single Female/Mother | 142 (22.2%) | 2.82 |
| Total Families | 640 (100.0%) | 3.27 |
Median Household Size in Irvine
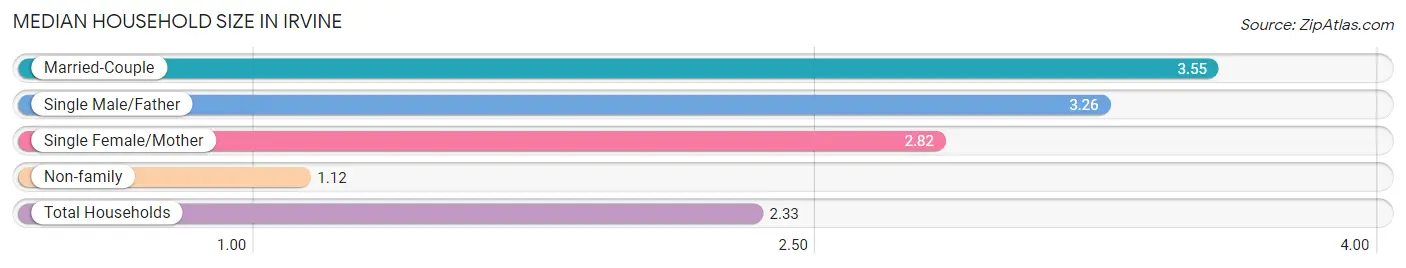
The median household size in Irvine is 2.33 persons per household, with married-couple households (433 | 36.5%) accounting for the largest median household size of 3.55 persons per household. non-family households (546 | 46.0%) represent the smallest median household size with 1.12 persons per household.
| Household Type | # Households | Household Size |
| Married-Couple | 433 (36.5%) | 3.55 |
| Single Male/Father | 65 (5.5%) | 3.26 |
| Single Female/Mother | 142 (12.0%) | 2.82 |
| Non-family | 546 (46.0%) | 1.12 |
| Total Households | 1,186 (100.0%) | 2.33 |
Household Size by Marriage Status in Irvine
Out of a total of 1,186 households in Irvine, 640 (54.0%) are family households, while 546 (46.0%) are nonfamily households. The most numerous type of family households are 2-person households, comprising 291, and the most common type of nonfamily households are 1-person households, comprising 482.
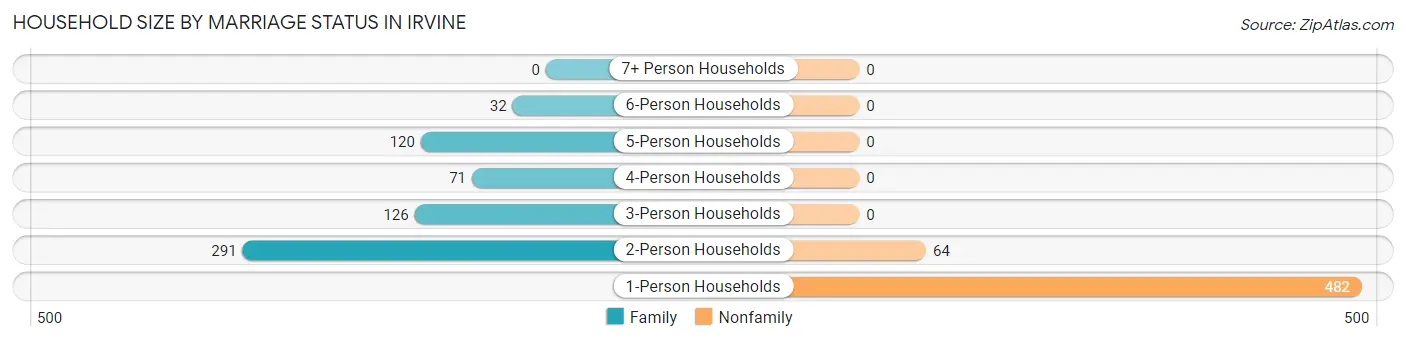
| Household Size | Family Households | Nonfamily Households |
| 1-Person Households | - | 482 (40.6%) |
| 2-Person Households | 291 (24.5%) | 64 (5.4%) |
| 3-Person Households | 126 (10.6%) | 0 (0.0%) |
| 4-Person Households | 71 (6.0%) | 0 (0.0%) |
| 5-Person Households | 120 (10.1%) | 0 (0.0%) |
| 6-Person Households | 32 (2.7%) | 0 (0.0%) |
| 7+ Person Households | 0 (0.0%) | 0 (0.0%) |
| Total | 640 (54.0%) | 546 (46.0%) |
Female Fertility in Irvine
Fertility by Age in Irvine
Average fertility rate in Irvine is 5.0 births per 1,000 women. Women in the age bracket of 20 to 34 years have the highest fertility rate with 12.0 births per 1,000 women. Women in the age bracket of 20 to 34 years acount for 100.0% of all women with births.
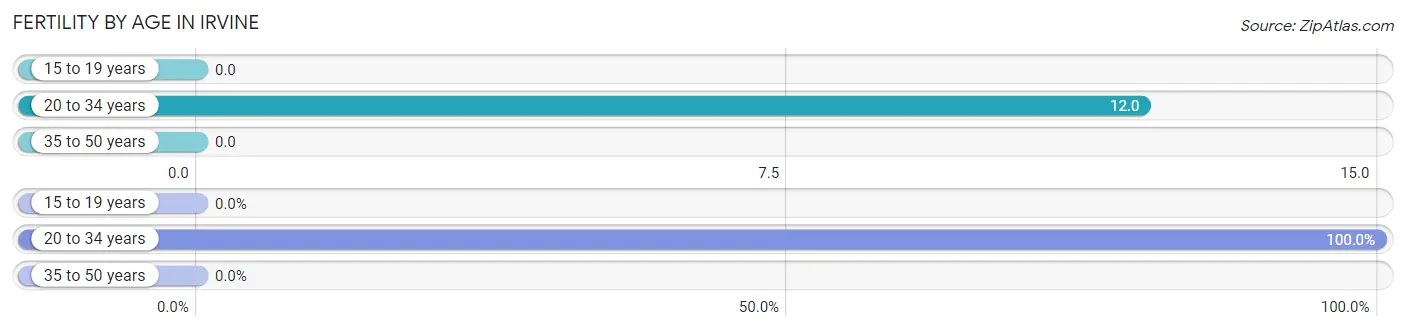
| Age Bracket | Women with Births | Births / 1,000 Women |
| 15 to 19 years | 0 (0.0%) | 0.0 |
| 20 to 34 years | 3 (100.0%) | 12.0 |
| 35 to 50 years | 0 (0.0%) | 0.0 |
| Total | 3 (100.0%) | 5.0 |
Fertility by Age by Marriage Status in Irvine
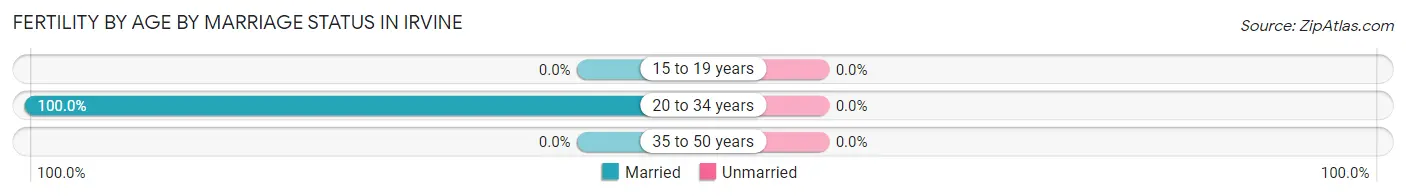
| Age Bracket | Married | Unmarried |
| 15 to 19 years | 0 (0.0%) | 0 (0.0%) |
| 20 to 34 years | 3 (100.0%) | 0 (0.0%) |
| 35 to 50 years | 0 (0.0%) | 0 (0.0%) |
| Total | 3 (100.0%) | 0 (0.0%) |
Fertility by Education in Irvine
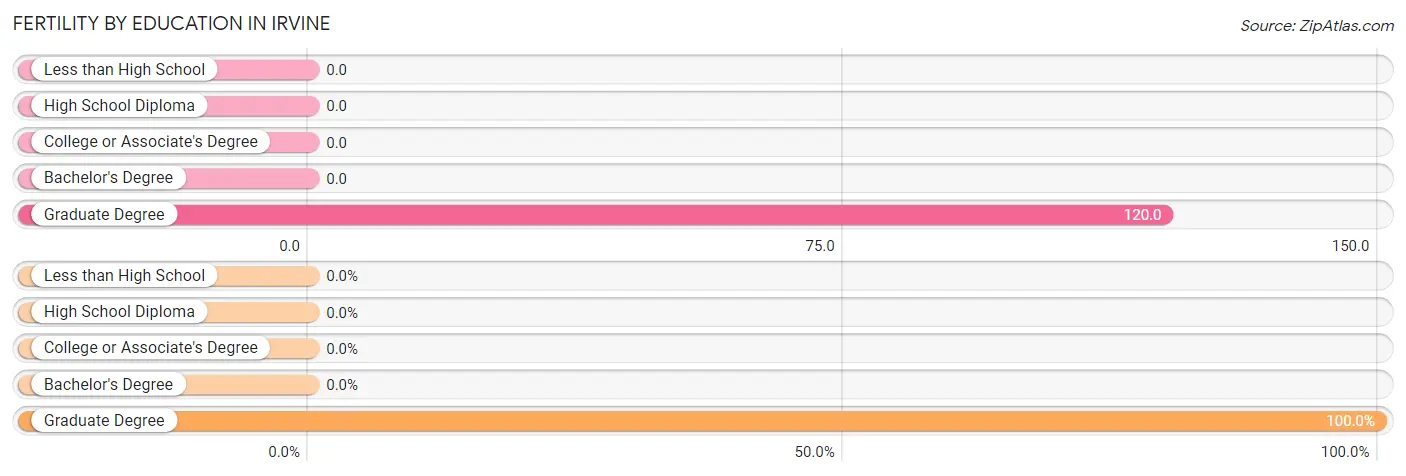
| Educational Attainment | Women with Births | Births / 1,000 Women |
| Less than High School | 0 (0.0%) | 0.0 |
| High School Diploma | 0 (0.0%) | 0.0 |
| College or Associate's Degree | 0 (0.0%) | 0.0 |
| Bachelor's Degree | 0 (0.0%) | 0.0 |
| Graduate Degree | 3 (100.0%) | 120.0 |
| Total | 3 (100.0%) | 5.0 |
Fertility by Education by Marriage Status in Irvine
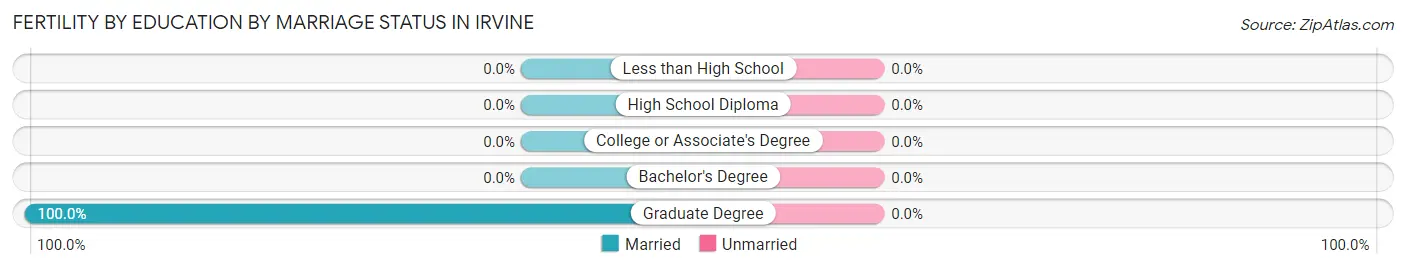
| Educational Attainment | Married | Unmarried |
| Less than High School | 0 (0.0%) | 0 (0.0%) |
| High School Diploma | 0 (0.0%) | 0 (0.0%) |
| College or Associate's Degree | 0 (0.0%) | 0 (0.0%) |
| Bachelor's Degree | 0 (0.0%) | 0 (0.0%) |
| Graduate Degree | 3 (100.0%) | 0 (0.0%) |
| Total | 3 (100.0%) | 0 (0.0%) |
Employment Characteristics in Irvine
Employment by Class of Employer in Irvine
Among the 850 employed individuals in Irvine, private company employees (498 | 58.6%), not-for-profit organizations (166 | 19.5%), and local government employees (116 | 13.7%) make up the most common classes of employment.
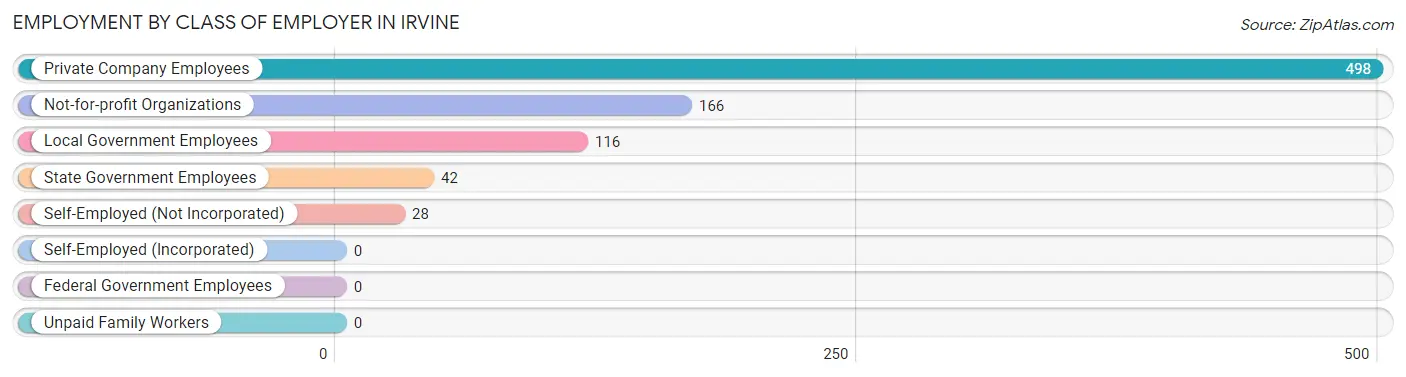
| Employer Class | # Employees | % Employees |
| Private Company Employees | 498 | 58.6% |
| Self-Employed (Incorporated) | 0 | 0.0% |
| Self-Employed (Not Incorporated) | 28 | 3.3% |
| Not-for-profit Organizations | 166 | 19.5% |
| Local Government Employees | 116 | 13.7% |
| State Government Employees | 42 | 4.9% |
| Federal Government Employees | 0 | 0.0% |
| Unpaid Family Workers | 0 | 0.0% |
| Total | 850 | 100.0% |
Employment Status by Age in Irvine
According to the labor force statistics for Irvine, out of the total population over 16 years of age (2,144), 46.1% or 988 individuals are in the labor force, with 11.6% or 115 of them unemployed. The age group with the highest labor force participation rate is 25 to 29 years, with 95.1% or 135 individuals in the labor force. Within the labor force, the 16 to 19 years age range has the highest percentage of unemployed individuals, with 100.0% or 35 of them being unemployed.
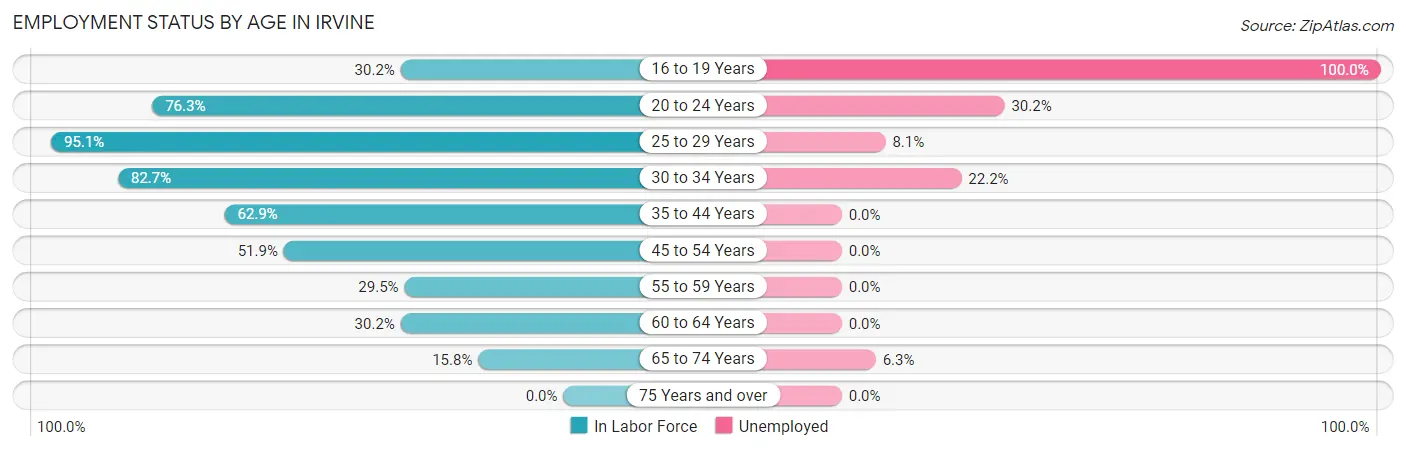
| Age Bracket | In Labor Force | Unemployed |
| 16 to 19 Years | 35 (30.2%) | 35 (100.0%) |
| 20 to 24 Years | 106 (76.3%) | 32 (30.2%) |
| 25 to 29 Years | 135 (95.1%) | 11 (8.1%) |
| 30 to 34 Years | 153 (82.7%) | 34 (22.2%) |
| 35 to 44 Years | 242 (62.9%) | 0 (0.0%) |
| 45 to 54 Years | 149 (51.9%) | 0 (0.0%) |
| 55 to 59 Years | 66 (29.5%) | 0 (0.0%) |
| 60 to 64 Years | 54 (30.2%) | 0 (0.0%) |
| 65 to 74 Years | 48 (15.8%) | 3 (6.3%) |
| 75 Years and over | 0 (0.0%) | 0 (0.0%) |
| Total | 988 (46.1%) | 115 (11.6%) |
Employment Status by Educational Attainment in Irvine
According to labor force statistics for Irvine, 57.0% of individuals (799) out of the total population between 25 and 64 years of age (1,402) are in the labor force, with 5.6% or 45 of them being unemployed. The group with the highest labor force participation rate are those with the educational attainment of bachelor's degree or higher, with 84.4% or 255 individuals in the labor force. Within the labor force, individuals with high school diploma education have the highest percentage of unemployment, with 9.5% or 27 of them being unemployed.
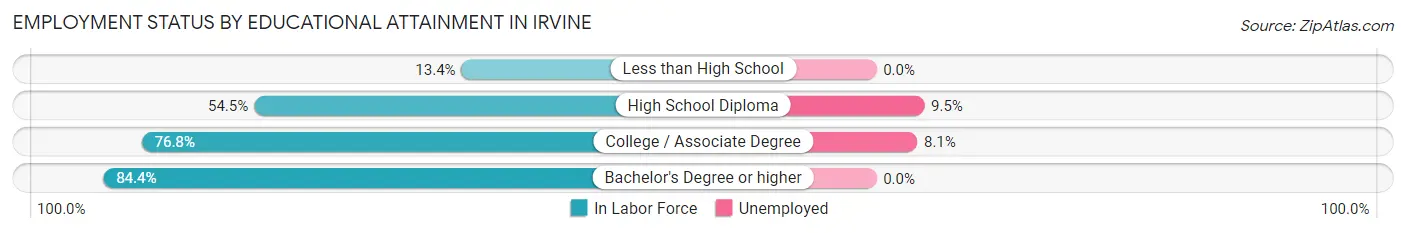
| Educational Attainment | In Labor Force | Unemployed |
| Less than High School | 39 (13.4%) | 0 (0.0%) |
| High School Diploma | 283 (54.5%) | 49 (9.5%) |
| College / Associate Degree | 222 (76.8%) | 23 (8.1%) |
| Bachelor's Degree or higher | 255 (84.4%) | 0 (0.0%) |
| Total | 799 (57.0%) | 79 (5.6%) |
Employment Occupations by Sex in Irvine
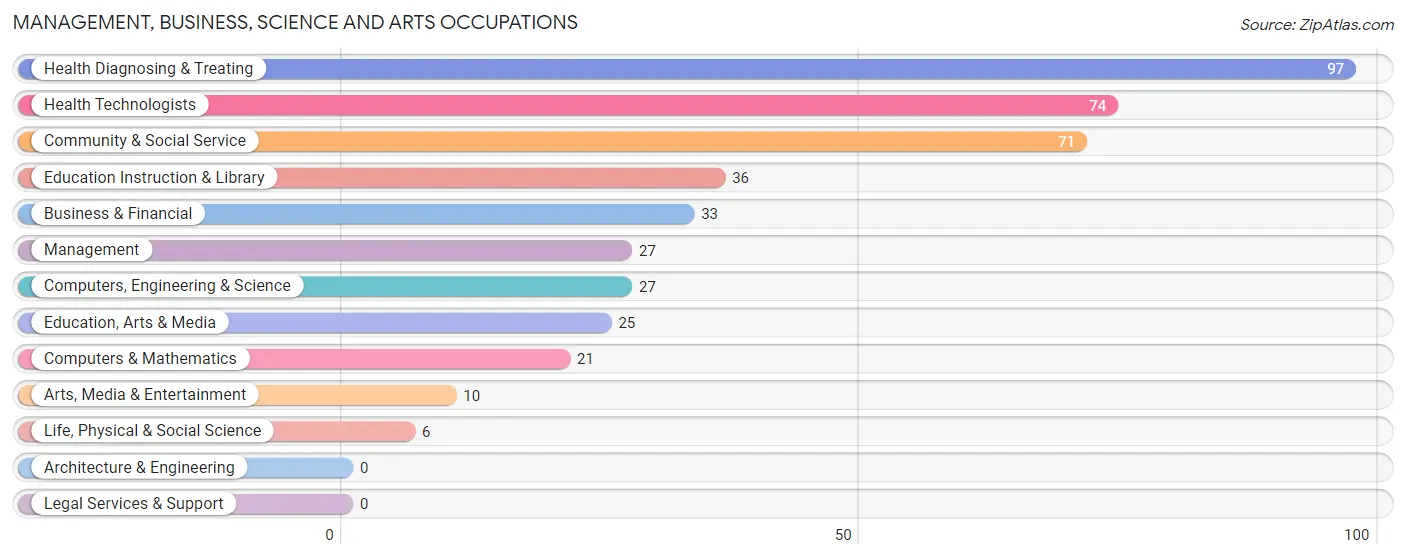
Management, Business, Science and Arts Occupations
The most common Management, Business, Science and Arts occupations in Irvine are Health Diagnosing & Treating (97 | 11.1%), Health Technologists (74 | 8.5%), Community & Social Service (71 | 8.1%), Education Instruction & Library (36 | 4.1%), and Business & Financial (33 | 3.8%).
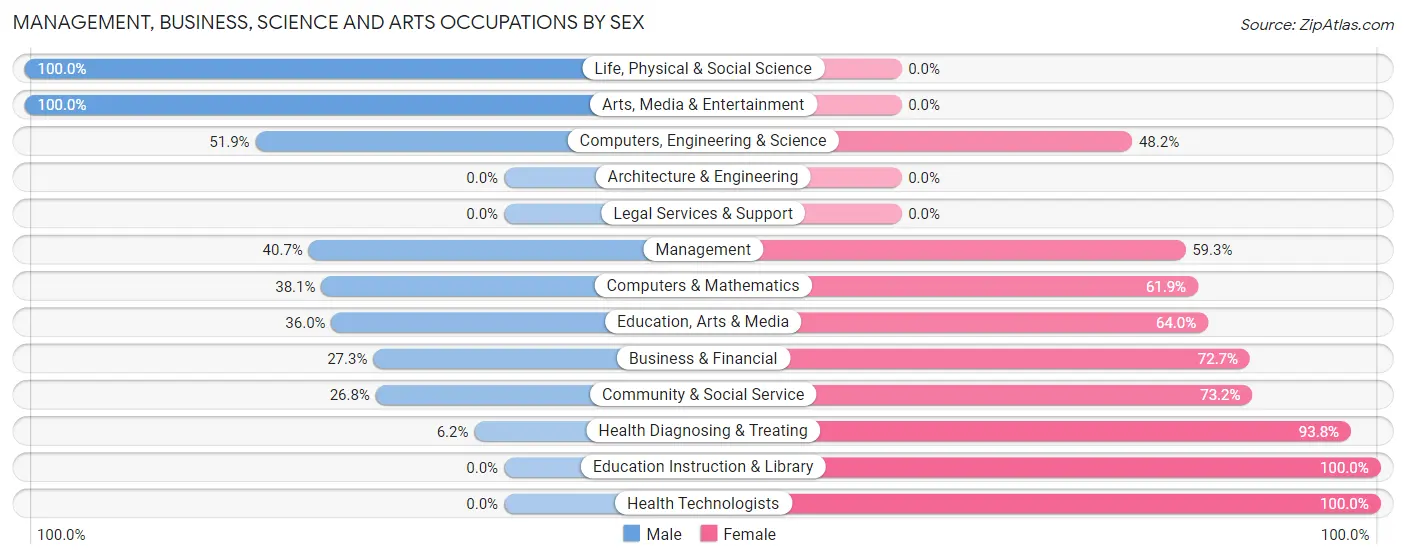
Management, Business, Science and Arts Occupations by Sex
Within the Management, Business, Science and Arts occupations in Irvine, the most male-oriented occupations are Life, Physical & Social Science (100.0%), Arts, Media & Entertainment (100.0%), and Computers, Engineering & Science (51.8%), while the most female-oriented occupations are Education Instruction & Library (100.0%), Health Technologists (100.0%), and Health Diagnosing & Treating (93.8%).
| Occupation | Male | Female |
| Management | 11 (40.7%) | 16 (59.3%) |
| Business & Financial | 9 (27.3%) | 24 (72.7%) |
| Computers, Engineering & Science | 14 (51.8%) | 13 (48.1%) |
| Computers & Mathematics | 8 (38.1%) | 13 (61.9%) |
| Architecture & Engineering | 0 (0.0%) | 0 (0.0%) |
| Life, Physical & Social Science | 6 (100.0%) | 0 (0.0%) |
| Community & Social Service | 19 (26.8%) | 52 (73.2%) |
| Education, Arts & Media | 9 (36.0%) | 16 (64.0%) |
| Legal Services & Support | 0 (0.0%) | 0 (0.0%) |
| Education Instruction & Library | 0 (0.0%) | 36 (100.0%) |
| Arts, Media & Entertainment | 10 (100.0%) | 0 (0.0%) |
| Health Diagnosing & Treating | 6 (6.2%) | 91 (93.8%) |
| Health Technologists | 0 (0.0%) | 74 (100.0%) |
| Total (Category) | 59 (23.1%) | 196 (76.9%) |
| Total (Overall) | 356 (40.8%) | 517 (59.2%) |
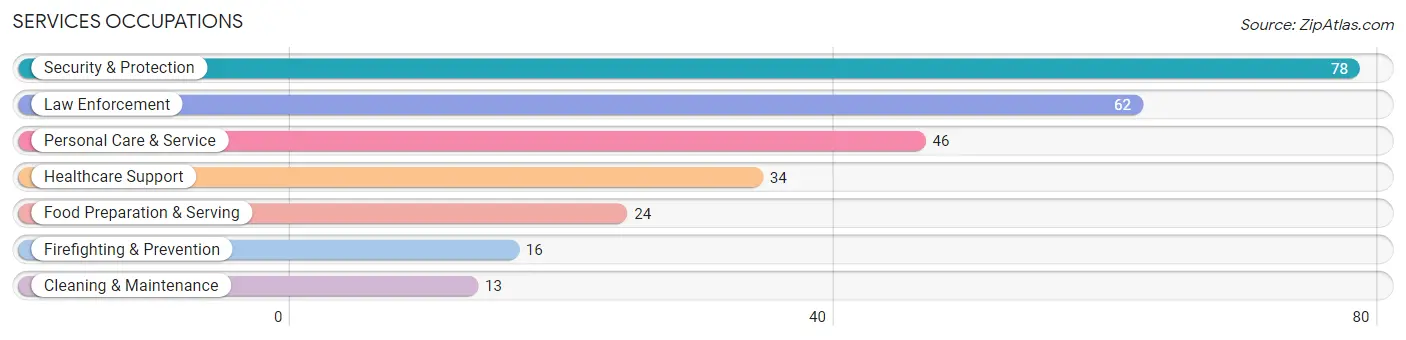
Services Occupations
The most common Services occupations in Irvine are Security & Protection (78 | 8.9%), Law Enforcement (62 | 7.1%), Personal Care & Service (46 | 5.3%), Healthcare Support (34 | 3.9%), and Food Preparation & Serving (24 | 2.8%).
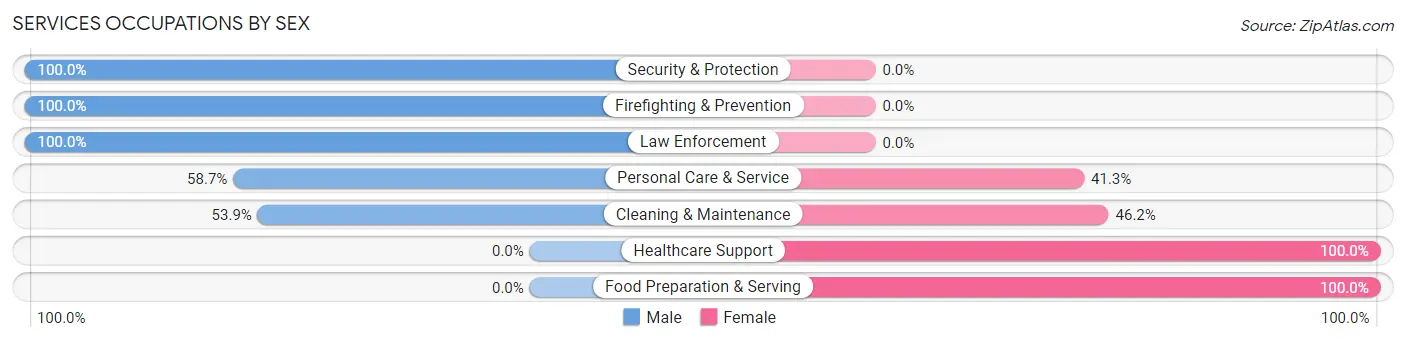
Services Occupations by Sex
Within the Services occupations in Irvine, the most male-oriented occupations are Security & Protection (100.0%), Firefighting & Prevention (100.0%), and Law Enforcement (100.0%), while the most female-oriented occupations are Healthcare Support (100.0%), Food Preparation & Serving (100.0%), and Cleaning & Maintenance (46.2%).
| Occupation | Male | Female |
| Healthcare Support | 0 (0.0%) | 34 (100.0%) |
| Security & Protection | 78 (100.0%) | 0 (0.0%) |
| Firefighting & Prevention | 16 (100.0%) | 0 (0.0%) |
| Law Enforcement | 62 (100.0%) | 0 (0.0%) |
| Food Preparation & Serving | 0 (0.0%) | 24 (100.0%) |
| Cleaning & Maintenance | 7 (53.8%) | 6 (46.2%) |
| Personal Care & Service | 27 (58.7%) | 19 (41.3%) |
| Total (Category) | 112 (57.4%) | 83 (42.6%) |
| Total (Overall) | 356 (40.8%) | 517 (59.2%) |
Sales and Office Occupations
The most common Sales and Office occupations in Irvine are Office & Administration (136 | 15.6%), and Sales & Related (46 | 5.3%).
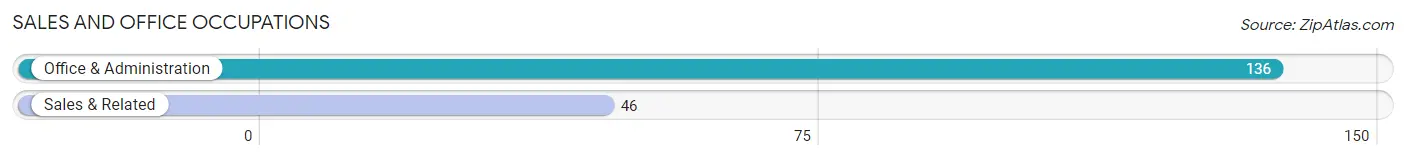
Sales and Office Occupations by Sex
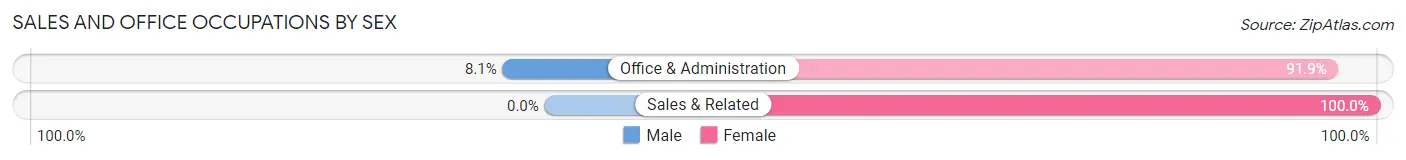
| Occupation | Male | Female |
| Sales & Related | 0 (0.0%) | 46 (100.0%) |
| Office & Administration | 11 (8.1%) | 125 (91.9%) |
| Total (Category) | 11 (6.0%) | 171 (94.0%) |
| Total (Overall) | 356 (40.8%) | 517 (59.2%) |
Natural Resources, Construction and Maintenance Occupations
The most common Natural Resources, Construction and Maintenance occupations in Irvine are Installation, Maintenance & Repair (37 | 4.2%), and Construction & Extraction (18 | 2.1%).
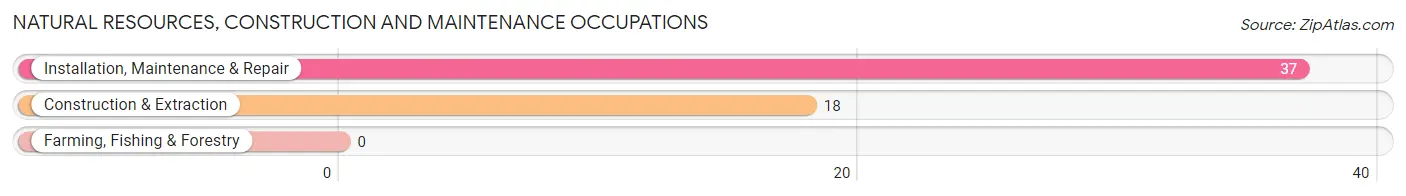
Natural Resources, Construction and Maintenance Occupations by Sex
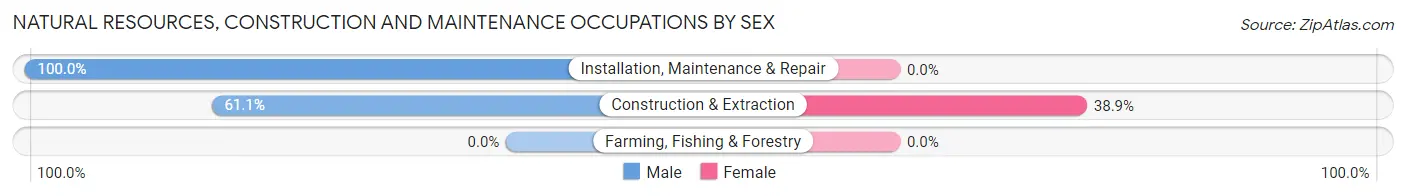
| Occupation | Male | Female |
| Farming, Fishing & Forestry | 0 (0.0%) | 0 (0.0%) |
| Construction & Extraction | 11 (61.1%) | 7 (38.9%) |
| Installation, Maintenance & Repair | 37 (100.0%) | 0 (0.0%) |
| Total (Category) | 48 (87.3%) | 7 (12.7%) |
| Total (Overall) | 356 (40.8%) | 517 (59.2%) |
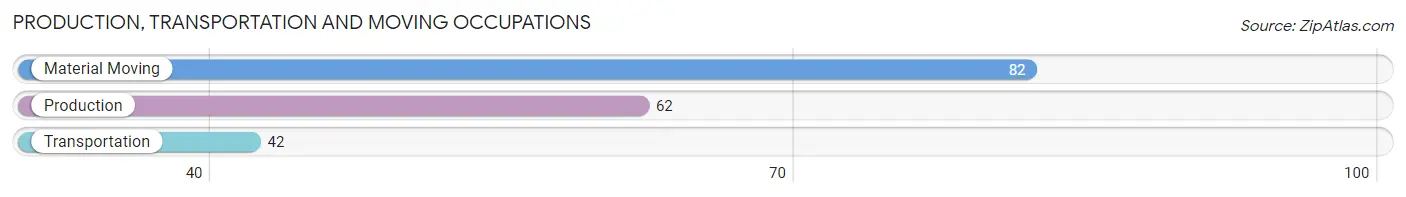
Production, Transportation and Moving Occupations
The most common Production, Transportation and Moving occupations in Irvine are Material Moving (82 | 9.4%), Production (62 | 7.1%), and Transportation (42 | 4.8%).
Production, Transportation and Moving Occupations by Sex
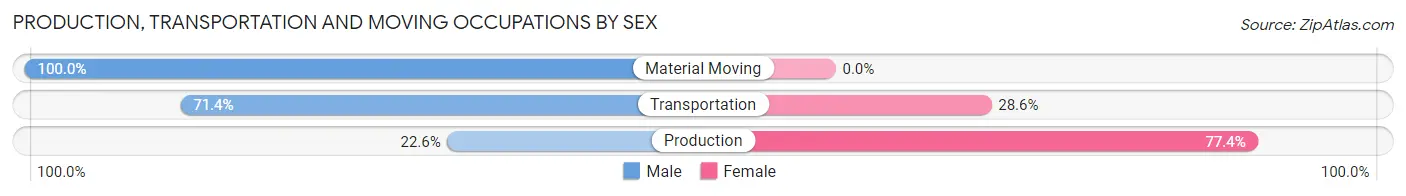
| Occupation | Male | Female |
| Production | 14 (22.6%) | 48 (77.4%) |
| Transportation | 30 (71.4%) | 12 (28.6%) |
| Material Moving | 82 (100.0%) | 0 (0.0%) |
| Total (Category) | 126 (67.7%) | 60 (32.3%) |
| Total (Overall) | 356 (40.8%) | 517 (59.2%) |
Employment Industries by Sex in Irvine
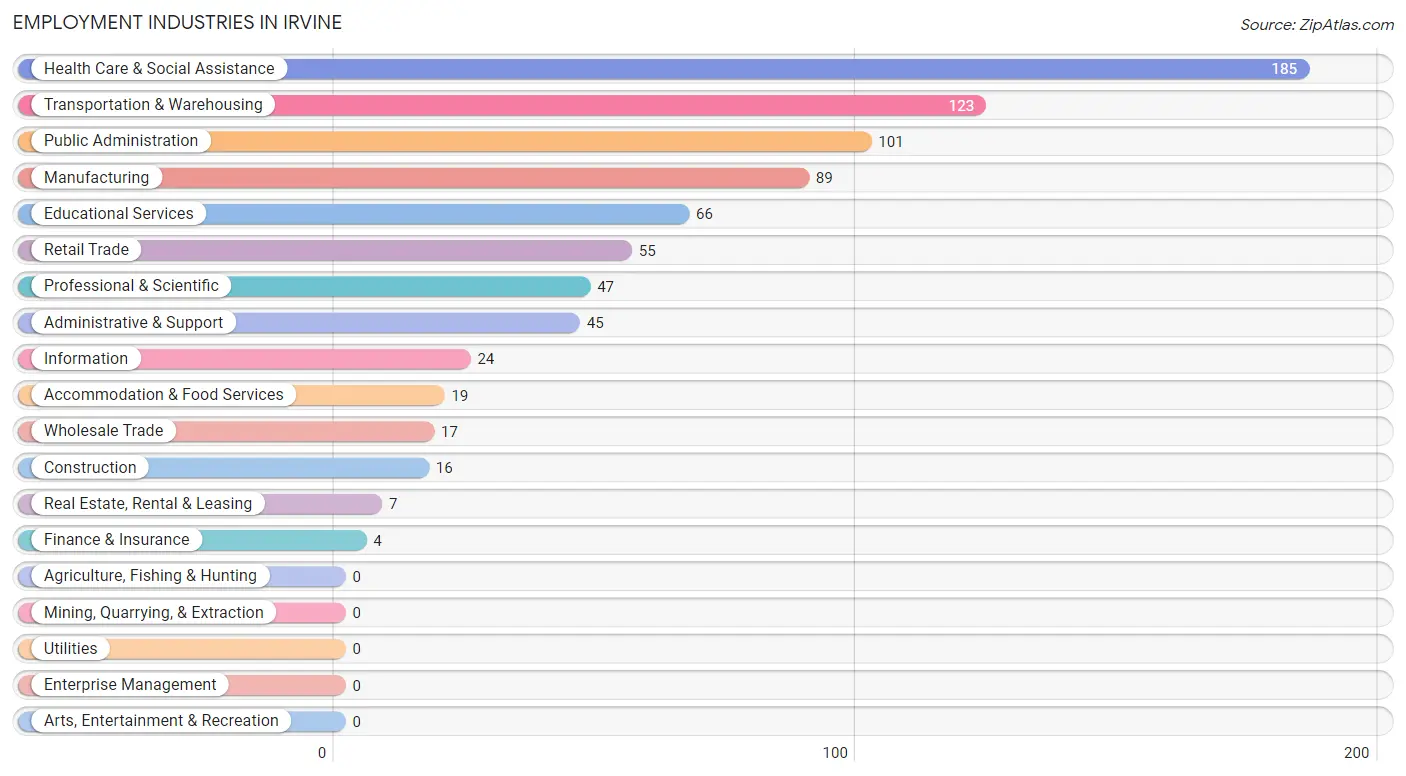
Employment Industries in Irvine
The major employment industries in Irvine include Health Care & Social Assistance (185 | 21.2%), Transportation & Warehousing (123 | 14.1%), Public Administration (101 | 11.6%), Manufacturing (89 | 10.2%), and Educational Services (66 | 7.6%).
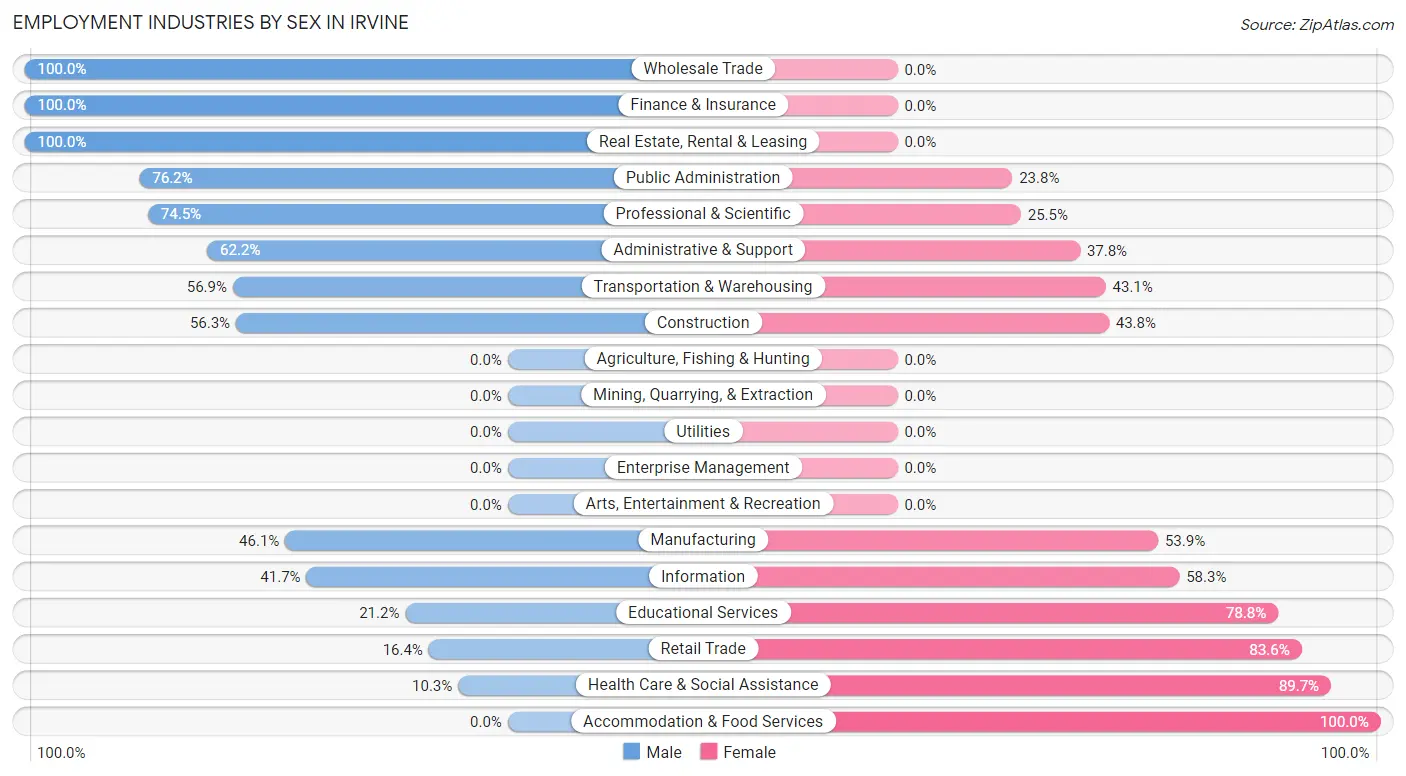
Employment Industries by Sex in Irvine
The Irvine industries that see more men than women are Wholesale Trade (100.0%), Finance & Insurance (100.0%), and Real Estate, Rental & Leasing (100.0%), whereas the industries that tend to have a higher number of women are Accommodation & Food Services (100.0%), Health Care & Social Assistance (89.7%), and Retail Trade (83.6%).
| Industry | Male | Female |
| Agriculture, Fishing & Hunting | 0 (0.0%) | 0 (0.0%) |
| Mining, Quarrying, & Extraction | 0 (0.0%) | 0 (0.0%) |
| Construction | 9 (56.2%) | 7 (43.8%) |
| Manufacturing | 41 (46.1%) | 48 (53.9%) |
| Wholesale Trade | 17 (100.0%) | 0 (0.0%) |
| Retail Trade | 9 (16.4%) | 46 (83.6%) |
| Transportation & Warehousing | 70 (56.9%) | 53 (43.1%) |
| Utilities | 0 (0.0%) | 0 (0.0%) |
| Information | 10 (41.7%) | 14 (58.3%) |
| Finance & Insurance | 4 (100.0%) | 0 (0.0%) |
| Real Estate, Rental & Leasing | 7 (100.0%) | 0 (0.0%) |
| Professional & Scientific | 35 (74.5%) | 12 (25.5%) |
| Enterprise Management | 0 (0.0%) | 0 (0.0%) |
| Administrative & Support | 28 (62.2%) | 17 (37.8%) |
| Educational Services | 14 (21.2%) | 52 (78.8%) |
| Health Care & Social Assistance | 19 (10.3%) | 166 (89.7%) |
| Arts, Entertainment & Recreation | 0 (0.0%) | 0 (0.0%) |
| Accommodation & Food Services | 0 (0.0%) | 19 (100.0%) |
| Public Administration | 77 (76.2%) | 24 (23.8%) |
| Total | 356 (40.8%) | 517 (59.2%) |
Education in Irvine
School Enrollment in Irvine
The most common levels of schooling among the 720 students in Irvine are elementary school (183 | 25.4%), nursery / preschool (151 | 21.0%), and high school (140 | 19.4%).
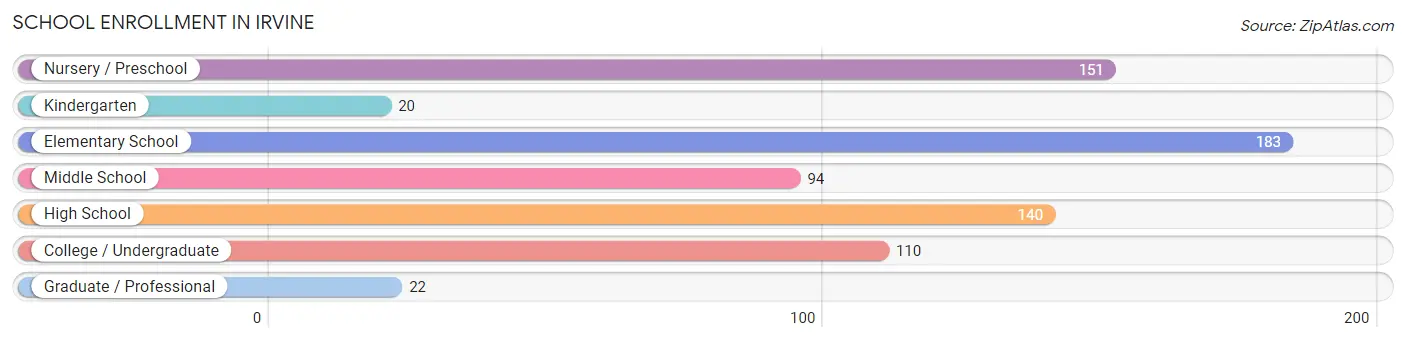
| School Level | # Students | % Students |
| Nursery / Preschool | 151 | 21.0% |
| Kindergarten | 20 | 2.8% |
| Elementary School | 183 | 25.4% |
| Middle School | 94 | 13.1% |
| High School | 140 | 19.4% |
| College / Undergraduate | 110 | 15.3% |
| Graduate / Professional | 22 | 3.1% |
| Total | 720 | 100.0% |
School Enrollment by Age by Funding Source in Irvine
Out of a total of 720 students who are enrolled in schools in Irvine, 69 (9.6%) attend a private institution, while the remaining 651 (90.4%) are enrolled in public schools. The age group of 10 to 14 year olds has the highest likelihood of being enrolled in private schools, with 28 (25.9% in the age bracket) enrolled. Conversely, the age group of 3 to 4 year olds has the lowest likelihood of being enrolled in a private school, with 7 (100.0% in the age bracket) attending a public institution.
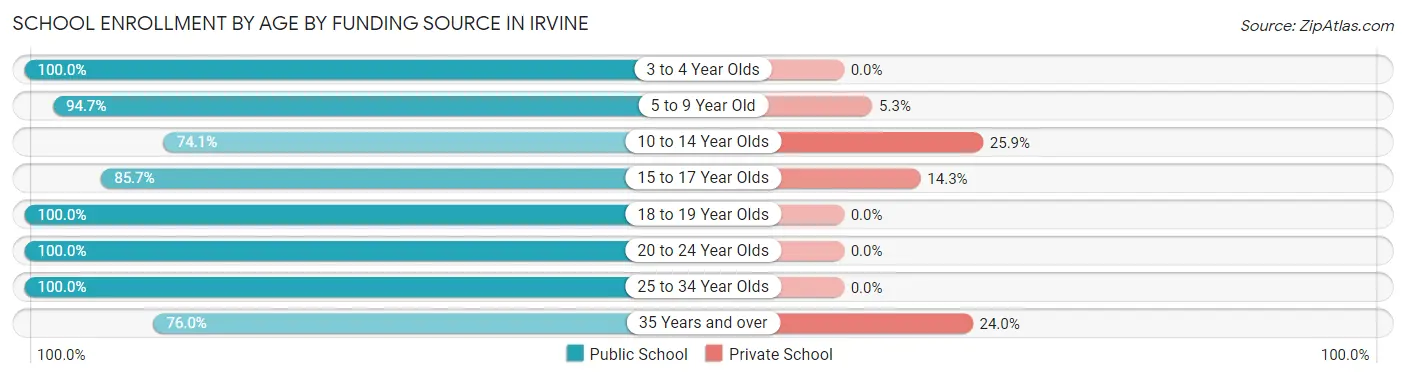
| Age Bracket | Public School | Private School |
| 3 to 4 Year Olds | 7 (100.0%) | 0 (0.0%) |
| 5 to 9 Year Old | 321 (94.7%) | 18 (5.3%) |
| 10 to 14 Year Olds | 80 (74.1%) | 28 (25.9%) |
| 15 to 17 Year Olds | 102 (85.7%) | 17 (14.3%) |
| 18 to 19 Year Olds | 15 (100.0%) | 0 (0.0%) |
| 20 to 24 Year Olds | 58 (100.0%) | 0 (0.0%) |
| 25 to 34 Year Olds | 49 (100.0%) | 0 (0.0%) |
| 35 Years and over | 19 (76.0%) | 6 (24.0%) |
| Total | 651 (90.4%) | 69 (9.6%) |
Educational Attainment by Field of Study in Irvine
Science & technology (183 | 41.5%), education (58 | 13.2%), business (52 | 11.8%), computers & mathematics (31 | 7.0%), and psychology (24 | 5.4%) are the most common fields of study among 441 individuals in Irvine who have obtained a bachelor's degree or higher.
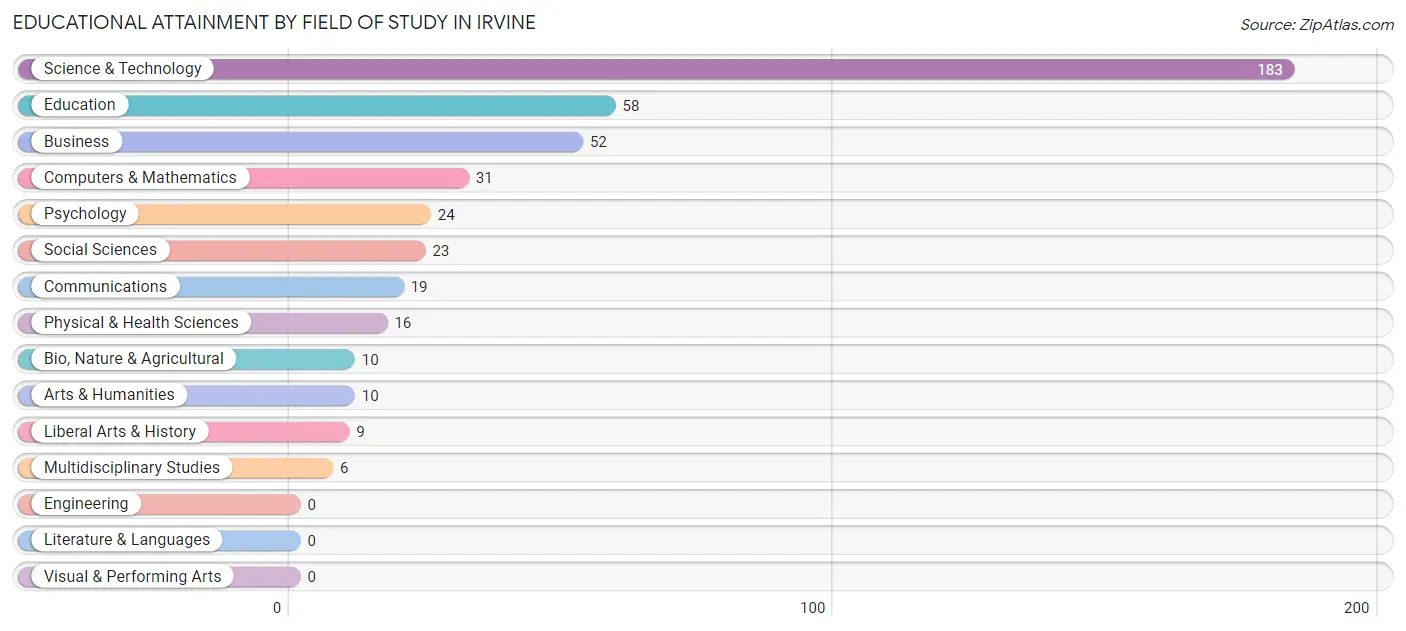
| Field of Study | # Graduates | % Graduates |
| Computers & Mathematics | 31 | 7.0% |
| Bio, Nature & Agricultural | 10 | 2.3% |
| Physical & Health Sciences | 16 | 3.6% |
| Psychology | 24 | 5.4% |
| Social Sciences | 23 | 5.2% |
| Engineering | 0 | 0.0% |
| Multidisciplinary Studies | 6 | 1.4% |
| Science & Technology | 183 | 41.5% |
| Business | 52 | 11.8% |
| Education | 58 | 13.2% |
| Literature & Languages | 0 | 0.0% |
| Liberal Arts & History | 9 | 2.0% |
| Visual & Performing Arts | 0 | 0.0% |
| Communications | 19 | 4.3% |
| Arts & Humanities | 10 | 2.3% |
| Total | 441 | 100.0% |
Transportation & Commute in Irvine
Vehicle Availability by Sex in Irvine
The most prevalent vehicle ownership categories in Irvine are males with 2 vehicles (223, accounting for 63.5%) and females with 2 vehicles (234, making up 44.7%).
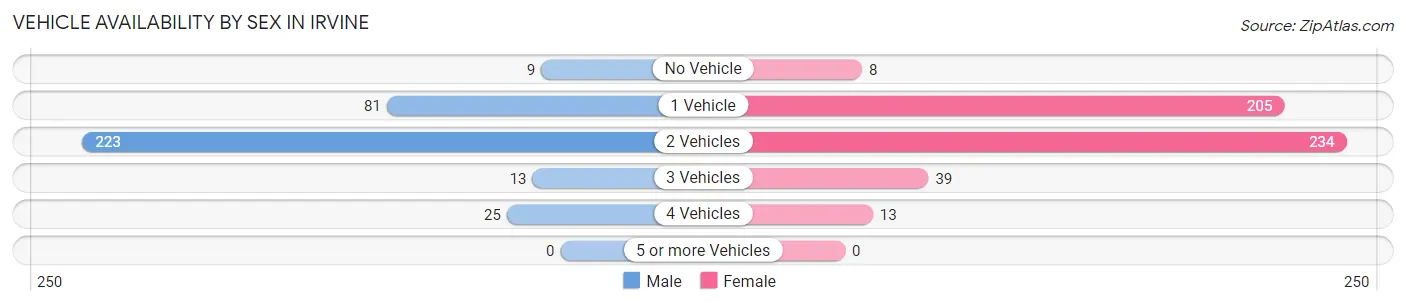
| Vehicles Available | Male | Female |
| No Vehicle | 9 (2.6%) | 8 (1.6%) |
| 1 Vehicle | 81 (23.1%) | 205 (41.1%) |
| 2 Vehicles | 223 (63.5%) | 234 (46.9%) |
| 3 Vehicles | 13 (3.7%) | 39 (7.8%) |
| 4 Vehicles | 25 (7.1%) | 13 (2.6%) |
| 5 or more Vehicles | 0 (0.0%) | 0 (0.0%) |
| Total | 351 (100.0%) | 499 (100.0%) |
Commute Time in Irvine
The most frequently occuring commute durations in Irvine are less than 5 minutes (227 commuters, 27.1%), 5 to 9 minutes (137 commuters, 16.4%), and 10 to 14 minutes (90 commuters, 10.7%).

| Commute Time | # Commuters | % Commuters |
| Less than 5 Minutes | 227 | 27.1% |
| 5 to 9 Minutes | 137 | 16.4% |
| 10 to 14 Minutes | 90 | 10.7% |
| 15 to 19 Minutes | 73 | 8.7% |
| 20 to 24 Minutes | 20 | 2.4% |
| 25 to 29 Minutes | 18 | 2.1% |
| 30 to 34 Minutes | 75 | 9.0% |
| 35 to 39 Minutes | 14 | 1.7% |
| 40 to 44 Minutes | 0 | 0.0% |
| 45 to 59 Minutes | 50 | 6.0% |
| 60 to 89 Minutes | 82 | 9.8% |
| 90 or more Minutes | 51 | 6.1% |
Commute Time by Sex in Irvine
The most common commute times in Irvine are 60 to 89 minutes (73 commuters, 20.8%) for males and less than 5 minutes (168 commuters, 34.6%) for females.
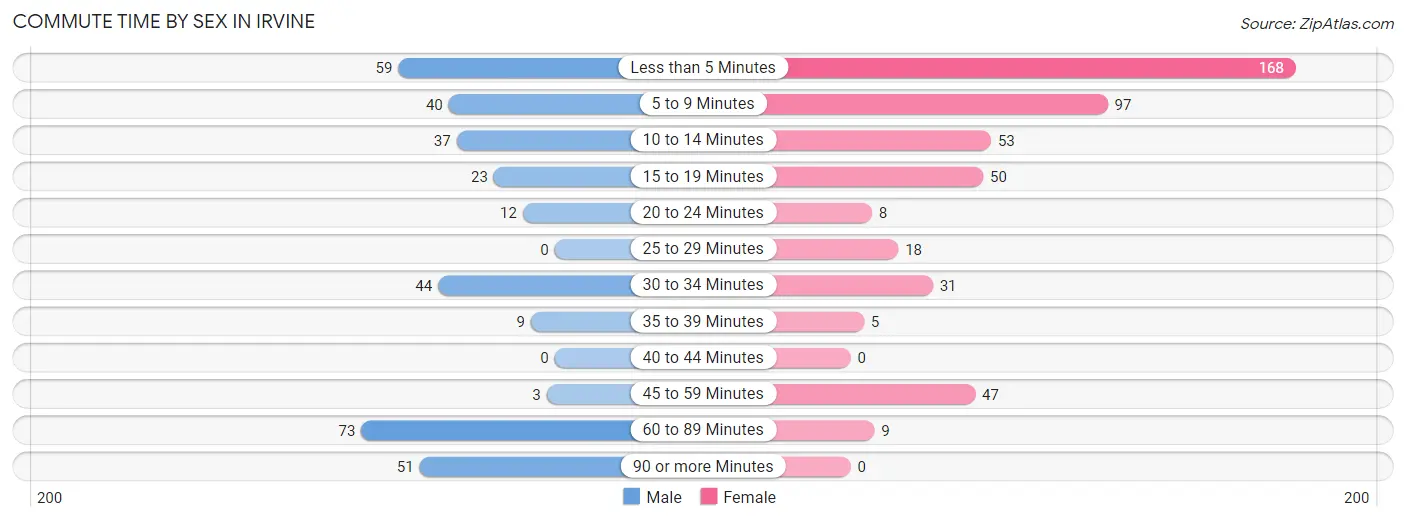
| Commute Time | Male | Female |
| Less than 5 Minutes | 59 (16.8%) | 168 (34.6%) |
| 5 to 9 Minutes | 40 (11.4%) | 97 (20.0%) |
| 10 to 14 Minutes | 37 (10.5%) | 53 (10.9%) |
| 15 to 19 Minutes | 23 (6.6%) | 50 (10.3%) |
| 20 to 24 Minutes | 12 (3.4%) | 8 (1.7%) |
| 25 to 29 Minutes | 0 (0.0%) | 18 (3.7%) |
| 30 to 34 Minutes | 44 (12.5%) | 31 (6.4%) |
| 35 to 39 Minutes | 9 (2.6%) | 5 (1.0%) |
| 40 to 44 Minutes | 0 (0.0%) | 0 (0.0%) |
| 45 to 59 Minutes | 3 (0.9%) | 47 (9.7%) |
| 60 to 89 Minutes | 73 (20.8%) | 9 (1.8%) |
| 90 or more Minutes | 51 (14.5%) | 0 (0.0%) |
Time of Departure to Work by Sex in Irvine
The most frequent times of departure to work in Irvine are 6:30 AM to 6:59 AM (75, 21.4%) for males and 7:30 AM to 7:59 AM (116, 23.9%) for females.
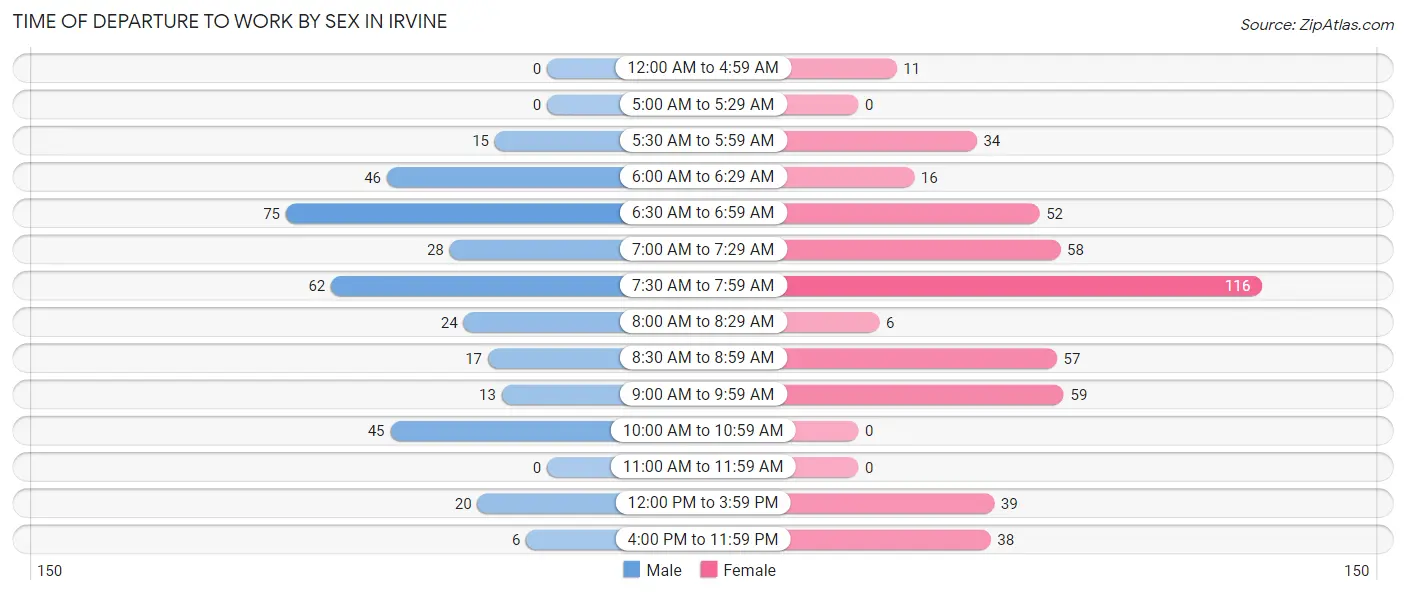
| Time of Departure | Male | Female |
| 12:00 AM to 4:59 AM | 0 (0.0%) | 11 (2.3%) |
| 5:00 AM to 5:29 AM | 0 (0.0%) | 0 (0.0%) |
| 5:30 AM to 5:59 AM | 15 (4.3%) | 34 (7.0%) |
| 6:00 AM to 6:29 AM | 46 (13.1%) | 16 (3.3%) |
| 6:30 AM to 6:59 AM | 75 (21.4%) | 52 (10.7%) |
| 7:00 AM to 7:29 AM | 28 (8.0%) | 58 (11.9%) |
| 7:30 AM to 7:59 AM | 62 (17.7%) | 116 (23.9%) |
| 8:00 AM to 8:29 AM | 24 (6.8%) | 6 (1.2%) |
| 8:30 AM to 8:59 AM | 17 (4.8%) | 57 (11.7%) |
| 9:00 AM to 9:59 AM | 13 (3.7%) | 59 (12.1%) |
| 10:00 AM to 10:59 AM | 45 (12.8%) | 0 (0.0%) |
| 11:00 AM to 11:59 AM | 0 (0.0%) | 0 (0.0%) |
| 12:00 PM to 3:59 PM | 20 (5.7%) | 39 (8.0%) |
| 4:00 PM to 11:59 PM | 6 (1.7%) | 38 (7.8%) |
| Total | 351 (100.0%) | 486 (100.0%) |
Housing Occupancy in Irvine
Occupancy by Ownership in Irvine
Of the total 1,186 dwellings in Irvine, owner-occupied units account for 534 (45.0%), while renter-occupied units make up 652 (55.0%).
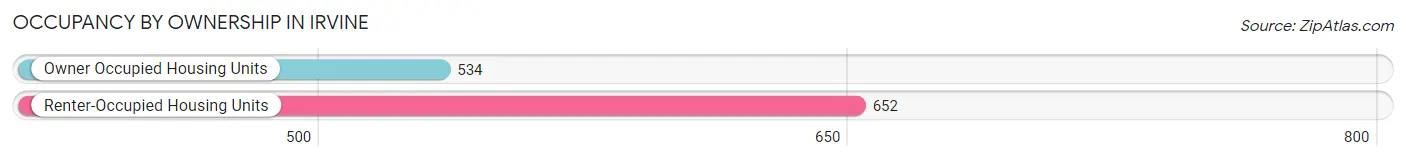
| Occupancy | # Housing Units | % Housing Units |
| Owner Occupied Housing Units | 534 | 45.0% |
| Renter-Occupied Housing Units | 652 | 55.0% |
| Total Occupied Housing Units | 1,186 | 100.0% |
Occupancy by Household Size in Irvine
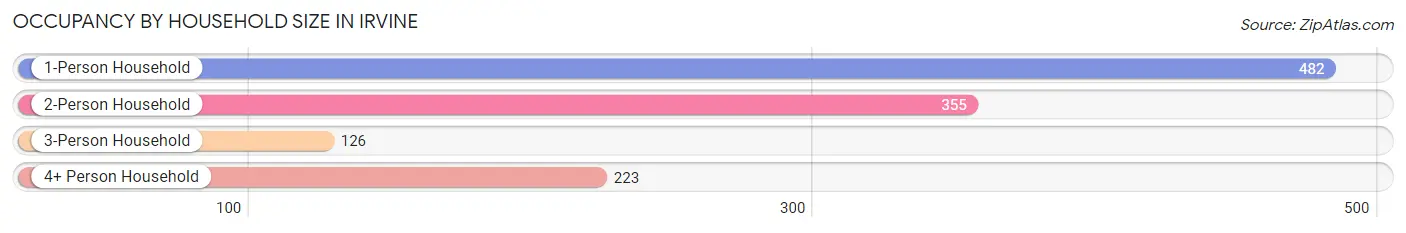
| Household Size | # Housing Units | % Housing Units |
| 1-Person Household | 482 | 40.6% |
| 2-Person Household | 355 | 29.9% |
| 3-Person Household | 126 | 10.6% |
| 4+ Person Household | 223 | 18.8% |
| Total Housing Units | 1,186 | 100.0% |
Occupancy by Ownership by Household Size in Irvine
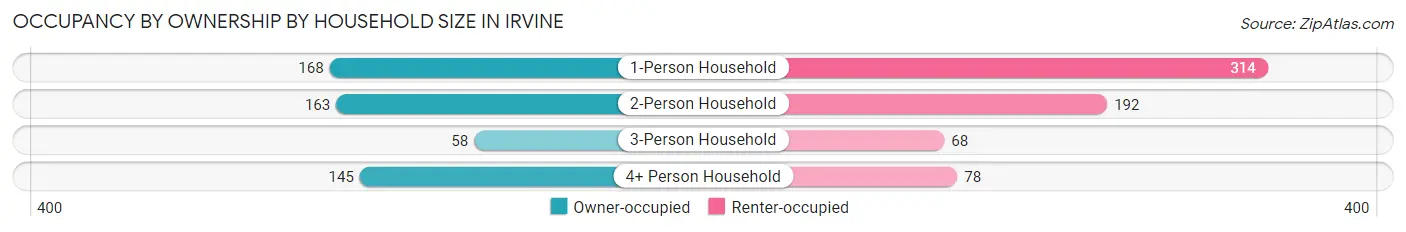
| Household Size | Owner-occupied | Renter-occupied |
| 1-Person Household | 168 (34.8%) | 314 (65.1%) |
| 2-Person Household | 163 (45.9%) | 192 (54.1%) |
| 3-Person Household | 58 (46.0%) | 68 (54.0%) |
| 4+ Person Household | 145 (65.0%) | 78 (35.0%) |
| Total Housing Units | 534 (45.0%) | 652 (55.0%) |
Occupancy by Educational Attainment in Irvine
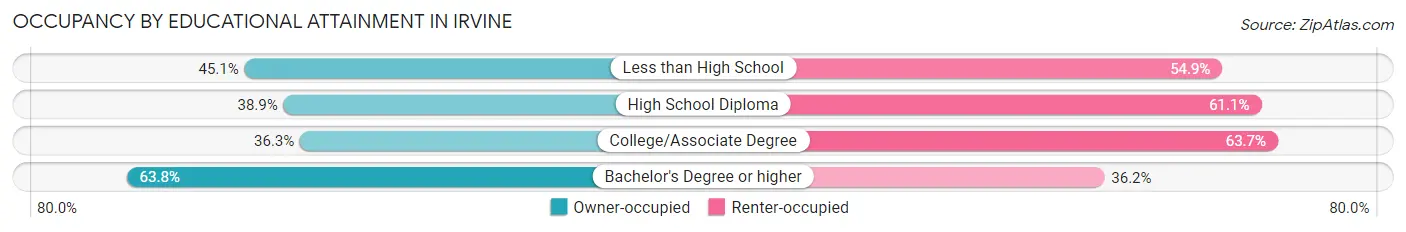
| Household Size | Owner-occupied | Renter-occupied |
| Less than High School | 97 (45.1%) | 118 (54.9%) |
| High School Diploma | 160 (38.9%) | 251 (61.1%) |
| College/Associate Degree | 106 (36.3%) | 186 (63.7%) |
| Bachelor's Degree or higher | 171 (63.8%) | 97 (36.2%) |
Occupancy by Age of Householder in Irvine
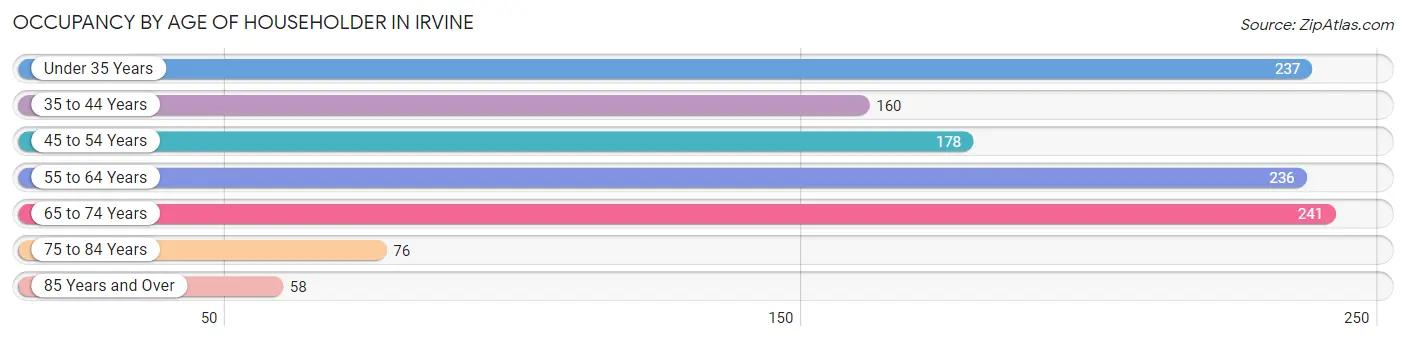
| Age Bracket | # Households | % Households |
| Under 35 Years | 237 | 20.0% |
| 35 to 44 Years | 160 | 13.5% |
| 45 to 54 Years | 178 | 15.0% |
| 55 to 64 Years | 236 | 19.9% |
| 65 to 74 Years | 241 | 20.3% |
| 75 to 84 Years | 76 | 6.4% |
| 85 Years and Over | 58 | 4.9% |
| Total | 1,186 | 100.0% |
Housing Finances in Irvine
Median Income by Occupancy in Irvine
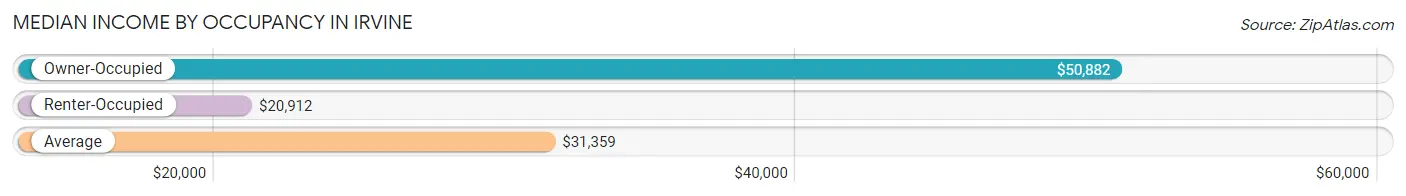
| Occupancy Type | # Households | Median Income |
| Owner-Occupied | 534 (45.0%) | $50,882 |
| Renter-Occupied | 652 (55.0%) | $20,912 |
| Average | 1,186 (100.0%) | $31,359 |
Occupancy by Householder Income Bracket in Irvine
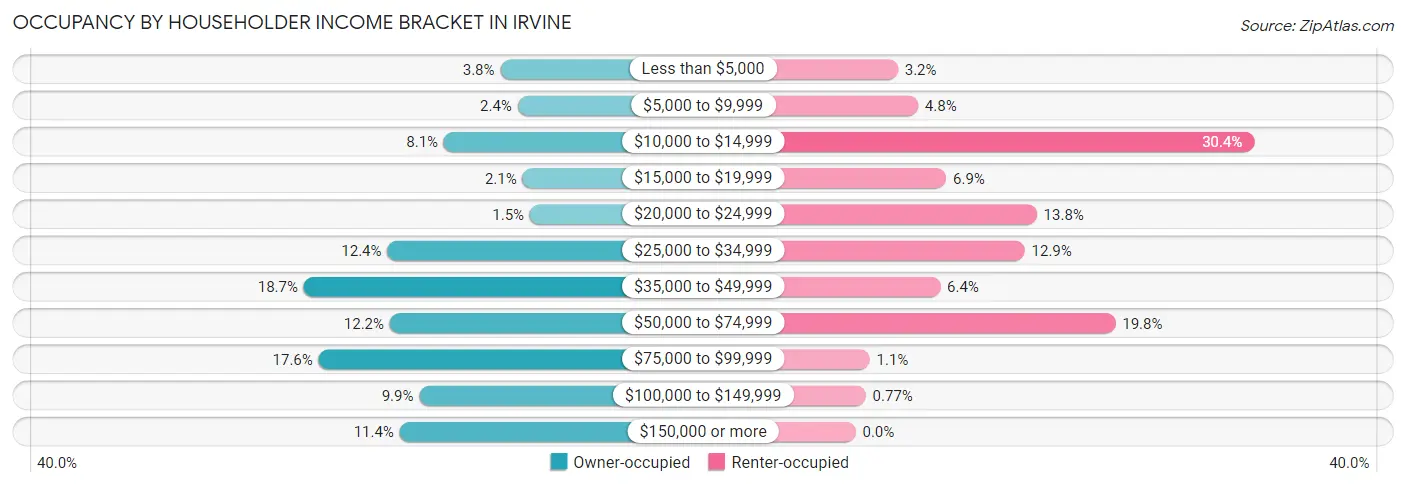
| Income Bracket | Owner-occupied | Renter-occupied |
| Less than $5,000 | 20 (3.7%) | 21 (3.2%) |
| $5,000 to $9,999 | 13 (2.4%) | 31 (4.8%) |
| $10,000 to $14,999 | 43 (8.1%) | 198 (30.4%) |
| $15,000 to $19,999 | 11 (2.1%) | 45 (6.9%) |
| $20,000 to $24,999 | 8 (1.5%) | 90 (13.8%) |
| $25,000 to $34,999 | 66 (12.4%) | 84 (12.9%) |
| $35,000 to $49,999 | 100 (18.7%) | 42 (6.4%) |
| $50,000 to $74,999 | 65 (12.2%) | 129 (19.8%) |
| $75,000 to $99,999 | 94 (17.6%) | 7 (1.1%) |
| $100,000 to $149,999 | 53 (9.9%) | 5 (0.8%) |
| $150,000 or more | 61 (11.4%) | 0 (0.0%) |
| Total | 534 (100.0%) | 652 (100.0%) |
Monthly Housing Cost Tiers in Irvine
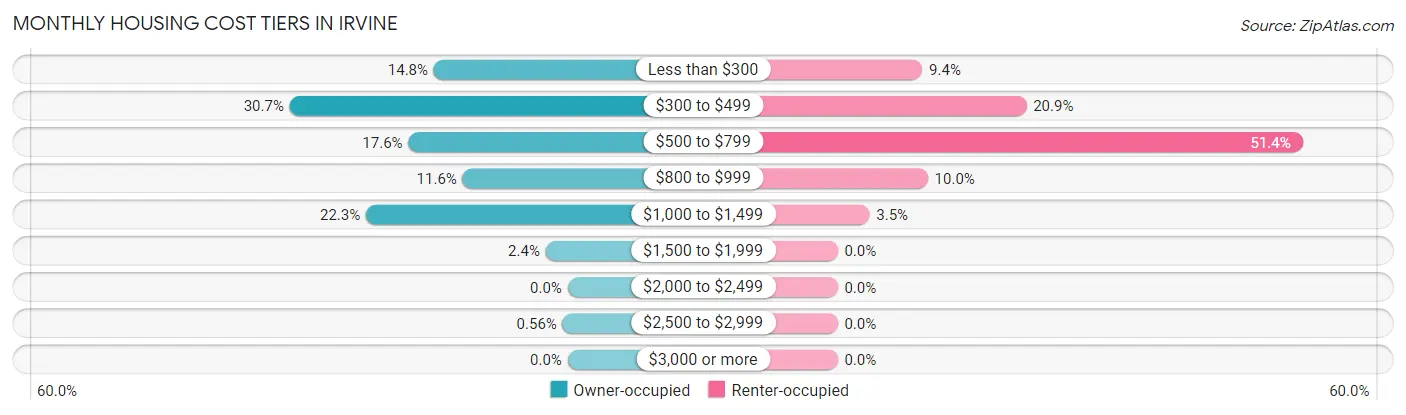
| Monthly Cost | Owner-occupied | Renter-occupied |
| Less than $300 | 79 (14.8%) | 61 (9.4%) |
| $300 to $499 | 164 (30.7%) | 136 (20.9%) |
| $500 to $799 | 94 (17.6%) | 335 (51.4%) |
| $800 to $999 | 62 (11.6%) | 65 (10.0%) |
| $1,000 to $1,499 | 119 (22.3%) | 23 (3.5%) |
| $1,500 to $1,999 | 13 (2.4%) | 0 (0.0%) |
| $2,000 to $2,499 | 0 (0.0%) | 0 (0.0%) |
| $2,500 to $2,999 | 3 (0.6%) | 0 (0.0%) |
| $3,000 or more | 0 (0.0%) | 0 (0.0%) |
| Total | 534 (100.0%) | 652 (100.0%) |
Physical Housing Characteristics in Irvine
Housing Structures in Irvine
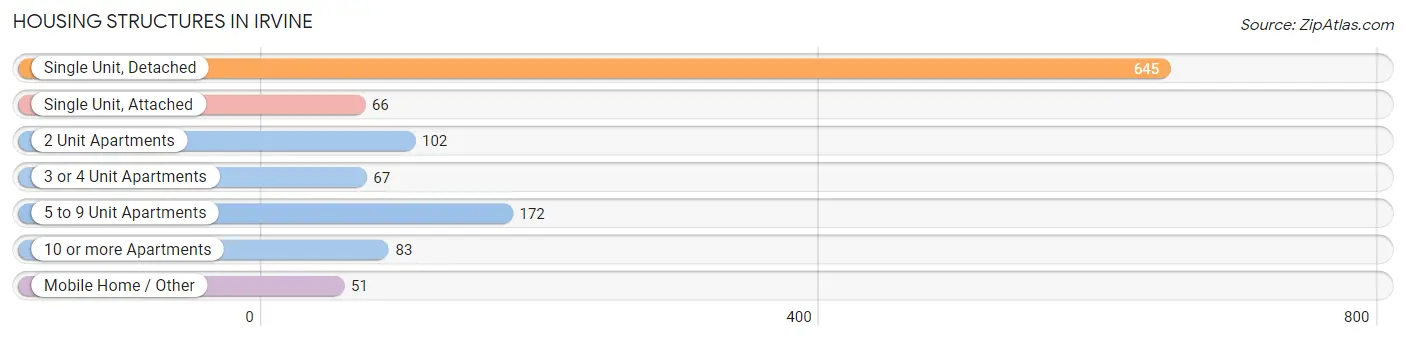
| Structure Type | # Housing Units | % Housing Units |
| Single Unit, Detached | 645 | 54.4% |
| Single Unit, Attached | 66 | 5.6% |
| 2 Unit Apartments | 102 | 8.6% |
| 3 or 4 Unit Apartments | 67 | 5.7% |
| 5 to 9 Unit Apartments | 172 | 14.5% |
| 10 or more Apartments | 83 | 7.0% |
| Mobile Home / Other | 51 | 4.3% |
| Total | 1,186 | 100.0% |
Housing Structures by Occupancy in Irvine
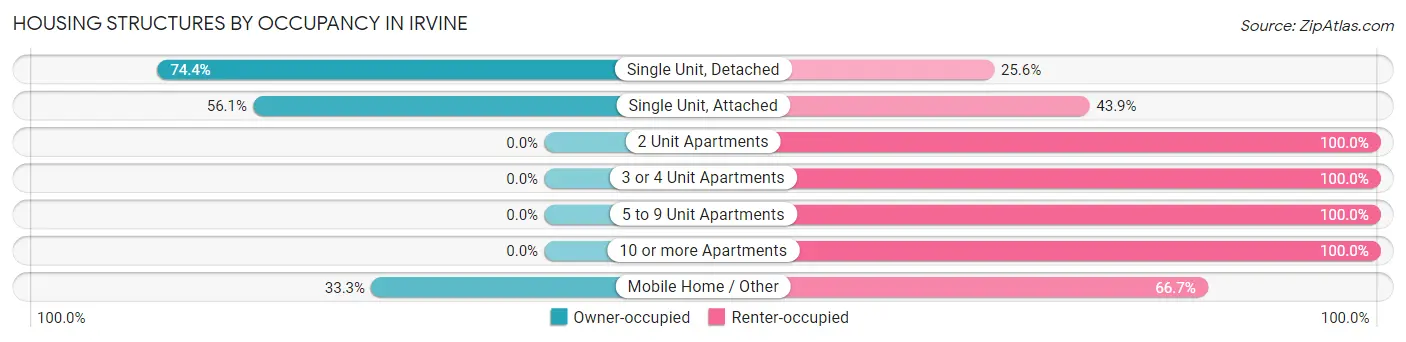
| Structure Type | Owner-occupied | Renter-occupied |
| Single Unit, Detached | 480 (74.4%) | 165 (25.6%) |
| Single Unit, Attached | 37 (56.1%) | 29 (43.9%) |
| 2 Unit Apartments | 0 (0.0%) | 102 (100.0%) |
| 3 or 4 Unit Apartments | 0 (0.0%) | 67 (100.0%) |
| 5 to 9 Unit Apartments | 0 (0.0%) | 172 (100.0%) |
| 10 or more Apartments | 0 (0.0%) | 83 (100.0%) |
| Mobile Home / Other | 17 (33.3%) | 34 (66.7%) |
| Total | 534 (45.0%) | 652 (55.0%) |
Housing Structures by Number of Rooms in Irvine
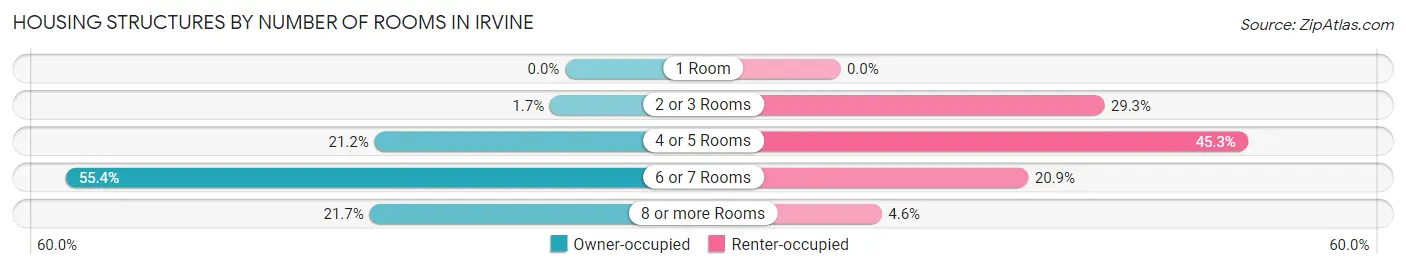
| Number of Rooms | Owner-occupied | Renter-occupied |
| 1 Room | 0 (0.0%) | 0 (0.0%) |
| 2 or 3 Rooms | 9 (1.7%) | 191 (29.3%) |
| 4 or 5 Rooms | 113 (21.2%) | 295 (45.3%) |
| 6 or 7 Rooms | 296 (55.4%) | 136 (20.9%) |
| 8 or more Rooms | 116 (21.7%) | 30 (4.6%) |
| Total | 534 (100.0%) | 652 (100.0%) |
Housing Structure by Heating Type in Irvine
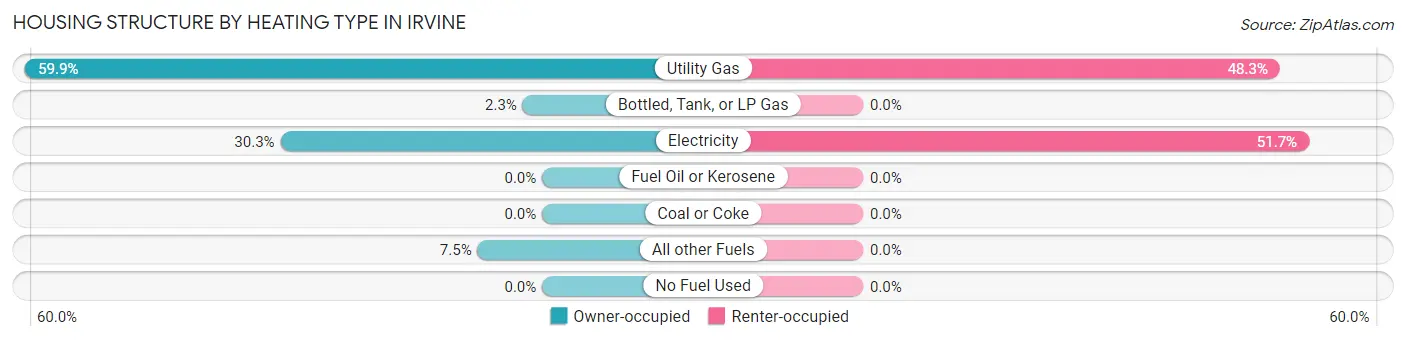
| Heating Type | Owner-occupied | Renter-occupied |
| Utility Gas | 320 (59.9%) | 315 (48.3%) |
| Bottled, Tank, or LP Gas | 12 (2.2%) | 0 (0.0%) |
| Electricity | 162 (30.3%) | 337 (51.7%) |
| Fuel Oil or Kerosene | 0 (0.0%) | 0 (0.0%) |
| Coal or Coke | 0 (0.0%) | 0 (0.0%) |
| All other Fuels | 40 (7.5%) | 0 (0.0%) |
| No Fuel Used | 0 (0.0%) | 0 (0.0%) |
| Total | 534 (100.0%) | 652 (100.0%) |
Household Vehicle Usage in Irvine
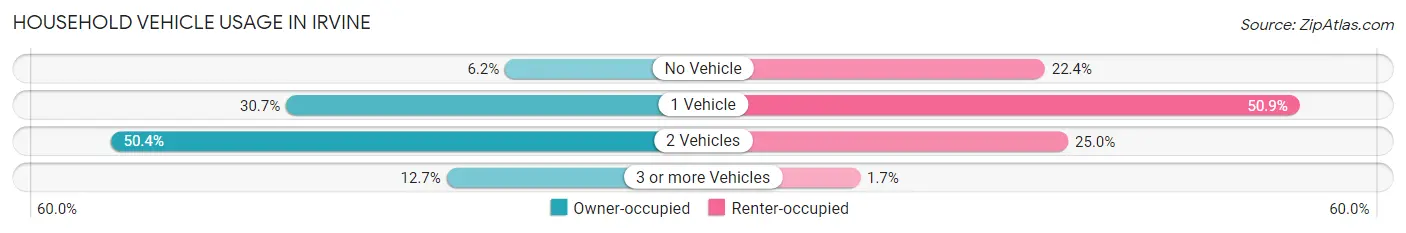
| Vehicles per Household | Owner-occupied | Renter-occupied |
| No Vehicle | 33 (6.2%) | 146 (22.4%) |
| 1 Vehicle | 164 (30.7%) | 332 (50.9%) |
| 2 Vehicles | 269 (50.4%) | 163 (25.0%) |
| 3 or more Vehicles | 68 (12.7%) | 11 (1.7%) |
| Total | 534 (100.0%) | 652 (100.0%) |
Real Estate & Mortgages in Irvine
Real Estate and Mortgage Overview in Irvine
| Characteristic | Without Mortgage | With Mortgage |
| Housing Units | 277 | 257 |
| Median Property Value | $75,400 | $126,600 |
| Median Household Income | $42,054 | $54 |
| Monthly Housing Costs | $381 | $0 |
| Real Estate Taxes | $616 | $21 |
Property Value by Mortgage Status in Irvine
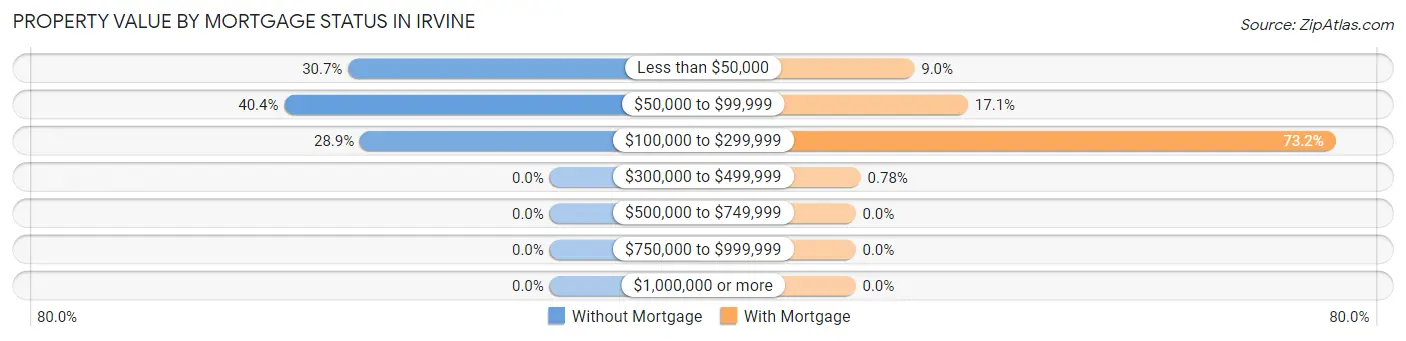
| Property Value | Without Mortgage | With Mortgage |
| Less than $50,000 | 85 (30.7%) | 23 (8.9%) |
| $50,000 to $99,999 | 112 (40.4%) | 44 (17.1%) |
| $100,000 to $299,999 | 80 (28.9%) | 188 (73.2%) |
| $300,000 to $499,999 | 0 (0.0%) | 2 (0.8%) |
| $500,000 to $749,999 | 0 (0.0%) | 0 (0.0%) |
| $750,000 to $999,999 | 0 (0.0%) | 0 (0.0%) |
| $1,000,000 or more | 0 (0.0%) | 0 (0.0%) |
| Total | 277 (100.0%) | 257 (100.0%) |
Household Income by Mortgage Status in Irvine
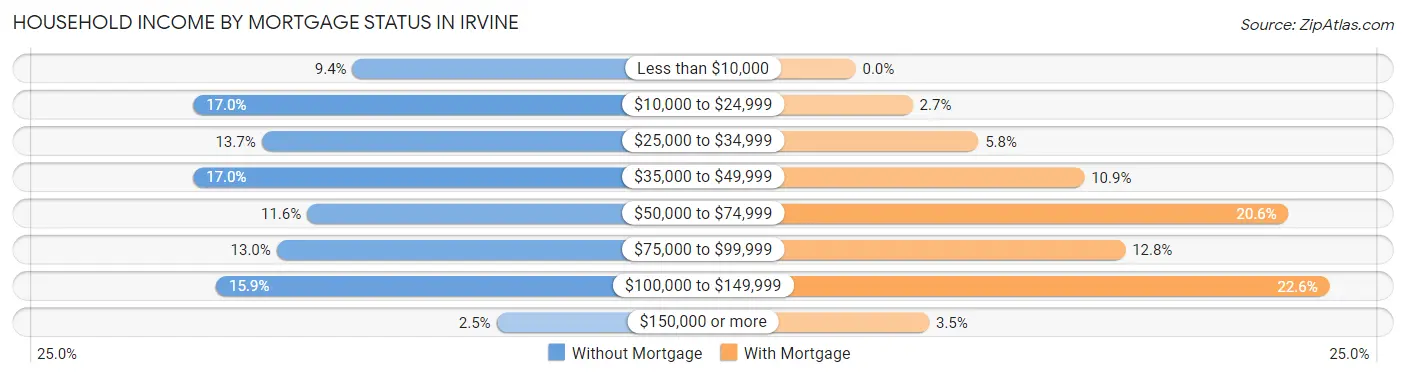
| Household Income | Without Mortgage | With Mortgage |
| Less than $10,000 | 26 (9.4%) | 0 (0.0%) |
| $10,000 to $24,999 | 47 (17.0%) | 7 (2.7%) |
| $25,000 to $34,999 | 38 (13.7%) | 15 (5.8%) |
| $35,000 to $49,999 | 47 (17.0%) | 28 (10.9%) |
| $50,000 to $74,999 | 32 (11.6%) | 53 (20.6%) |
| $75,000 to $99,999 | 36 (13.0%) | 33 (12.8%) |
| $100,000 to $149,999 | 44 (15.9%) | 58 (22.6%) |
| $150,000 or more | 7 (2.5%) | 9 (3.5%) |
| Total | 277 (100.0%) | 257 (100.0%) |
Property Value to Household Income Ratio in Irvine
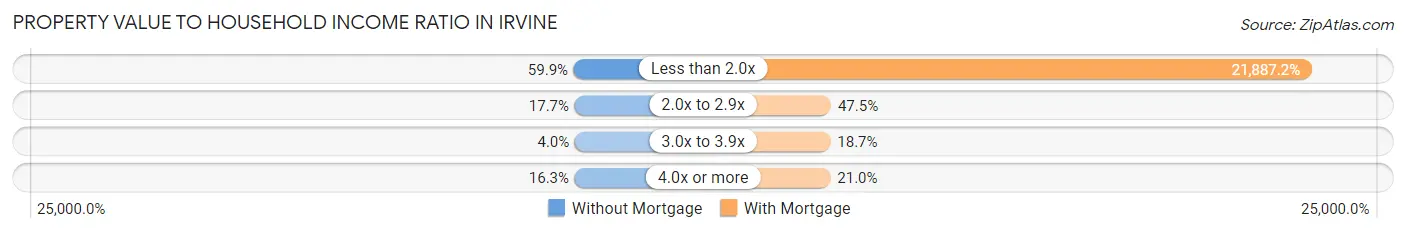
| Value-to-Income Ratio | Without Mortgage | With Mortgage |
| Less than 2.0x | 166 (59.9%) | 56,250 (21,887.2%) |
| 2.0x to 2.9x | 49 (17.7%) | 122 (47.5%) |
| 3.0x to 3.9x | 11 (4.0%) | 48 (18.7%) |
| 4.0x or more | 45 (16.3%) | 54 (21.0%) |
| Total | 277 (100.0%) | 257 (100.0%) |
Real Estate Taxes by Mortgage Status in Irvine
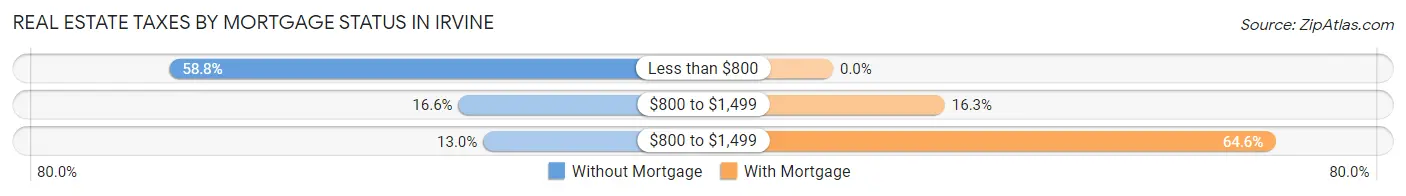
| Property Taxes | Without Mortgage | With Mortgage |
| Less than $800 | 163 (58.8%) | 0 (0.0%) |
| $800 to $1,499 | 46 (16.6%) | 42 (16.3%) |
| $800 to $1,499 | 36 (13.0%) | 166 (64.6%) |
| Total | 277 (100.0%) | 257 (100.0%) |
Health & Disability in Irvine
Health Insurance Coverage by Age in Irvine
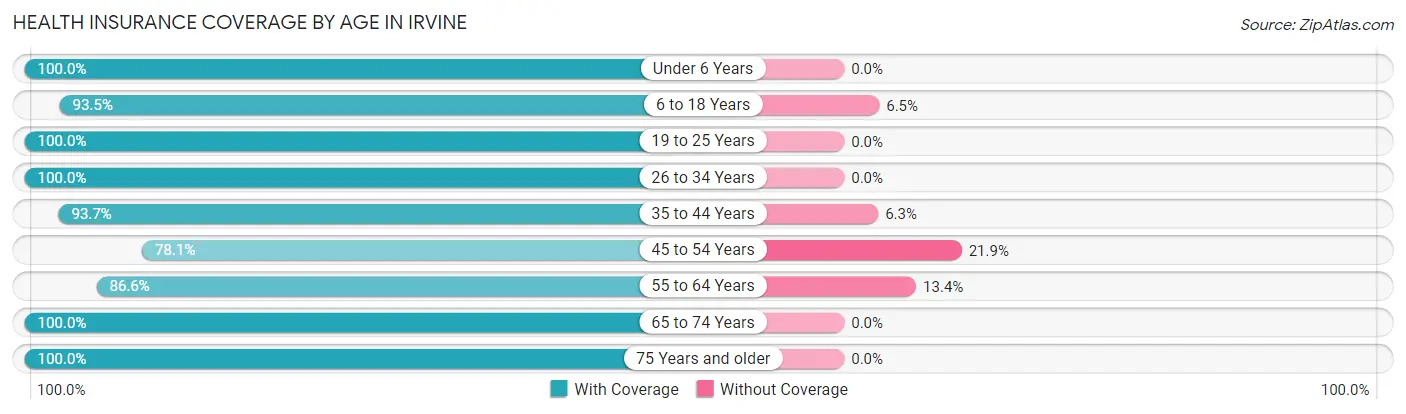
| Age Bracket | With Coverage | Without Coverage |
| Under 6 Years | 328 (100.0%) | 0 (0.0%) |
| 6 to 18 Years | 401 (93.5%) | 28 (6.5%) |
| 19 to 25 Years | 164 (100.0%) | 0 (0.0%) |
| 26 to 34 Years | 295 (100.0%) | 0 (0.0%) |
| 35 to 44 Years | 356 (93.7%) | 24 (6.3%) |
| 45 to 54 Years | 214 (78.1%) | 60 (21.9%) |
| 55 to 64 Years | 349 (86.6%) | 54 (13.4%) |
| 65 to 74 Years | 303 (100.0%) | 0 (0.0%) |
| 75 Years and older | 184 (100.0%) | 0 (0.0%) |
| Total | 2,594 (94.0%) | 166 (6.0%) |
Health Insurance Coverage by Citizenship Status in Irvine
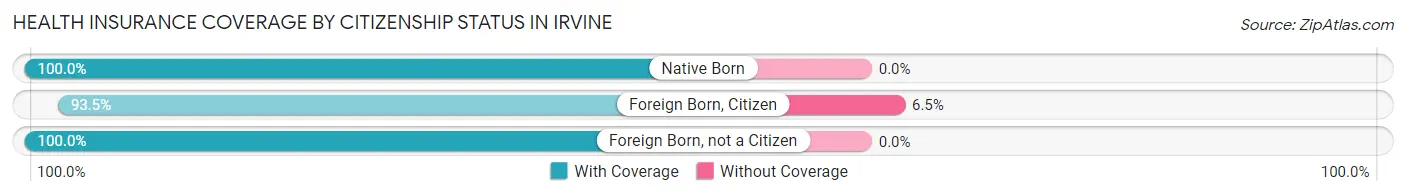
| Citizenship Status | With Coverage | Without Coverage |
| Native Born | 328 (100.0%) | 0 (0.0%) |
| Foreign Born, Citizen | 401 (93.5%) | 28 (6.5%) |
| Foreign Born, not a Citizen | 164 (100.0%) | 0 (0.0%) |
Health Insurance Coverage by Household Income in Irvine
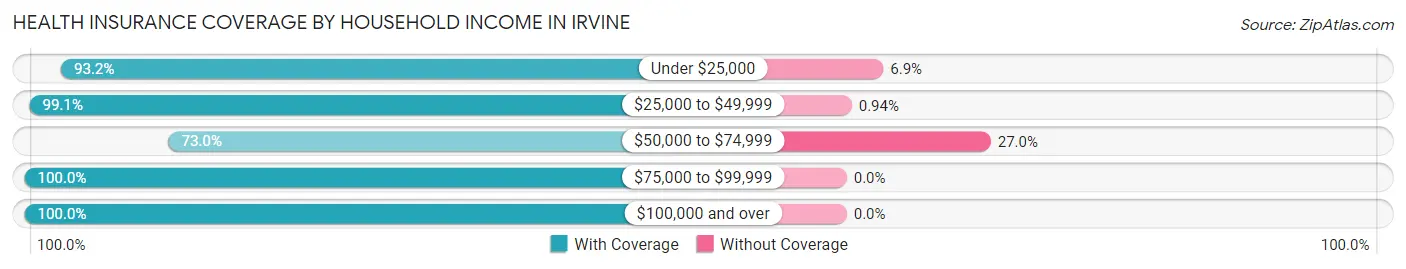
| Household Income | With Coverage | Without Coverage |
| Under $25,000 | 802 (93.1%) | 59 (6.9%) |
| $25,000 to $49,999 | 847 (99.1%) | 8 (0.9%) |
| $50,000 to $74,999 | 268 (73.0%) | 99 (27.0%) |
| $75,000 to $99,999 | 275 (100.0%) | 0 (0.0%) |
| $100,000 and over | 402 (100.0%) | 0 (0.0%) |
Public vs Private Health Insurance Coverage by Age in Irvine
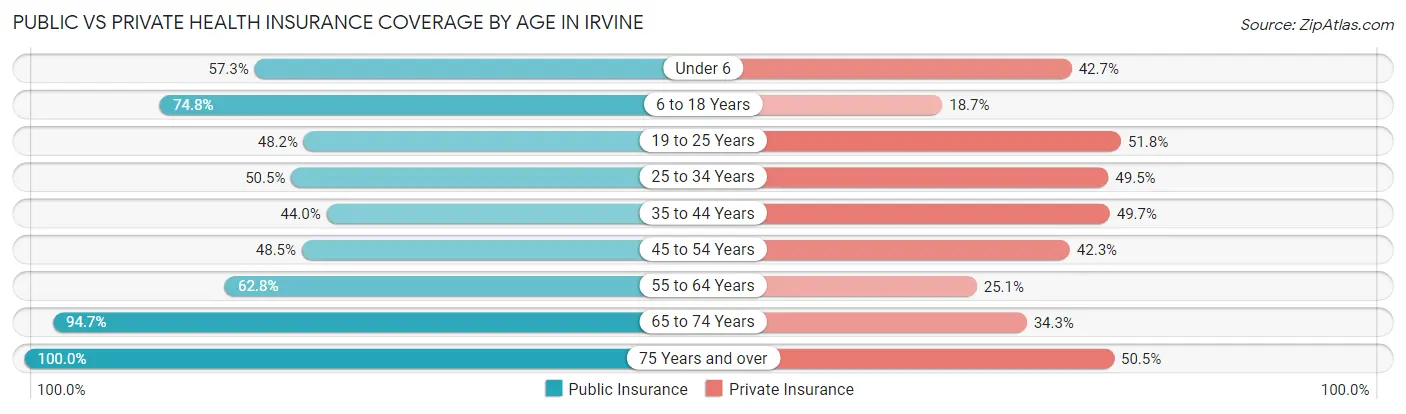
| Age Bracket | Public Insurance | Private Insurance |
| Under 6 | 188 (57.3%) | 140 (42.7%) |
| 6 to 18 Years | 321 (74.8%) | 80 (18.6%) |
| 19 to 25 Years | 79 (48.2%) | 85 (51.8%) |
| 25 to 34 Years | 149 (50.5%) | 146 (49.5%) |
| 35 to 44 Years | 167 (44.0%) | 189 (49.7%) |
| 45 to 54 Years | 133 (48.5%) | 116 (42.3%) |
| 55 to 64 Years | 253 (62.8%) | 101 (25.1%) |
| 65 to 74 Years | 287 (94.7%) | 104 (34.3%) |
| 75 Years and over | 184 (100.0%) | 93 (50.5%) |
| Total | 1,761 (63.8%) | 1,054 (38.2%) |
Disability Status by Sex by Age in Irvine
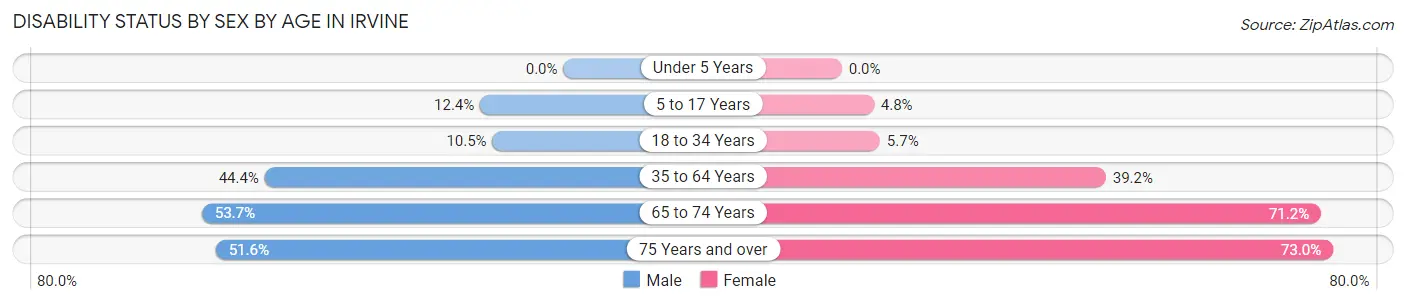
| Age Bracket | Male | Female |
| Under 5 Years | 0 (0.0%) | 0 (0.0%) |
| 5 to 17 Years | 44 (12.4%) | 10 (4.8%) |
| 18 to 34 Years | 22 (10.5%) | 15 (5.7%) |
| 35 to 64 Years | 204 (44.4%) | 234 (39.2%) |
| 65 to 74 Years | 51 (53.7%) | 148 (71.2%) |
| 75 Years and over | 32 (51.6%) | 89 (73.0%) |
Disability Class by Sex by Age in Irvine
Disability Class: Hearing Difficulty
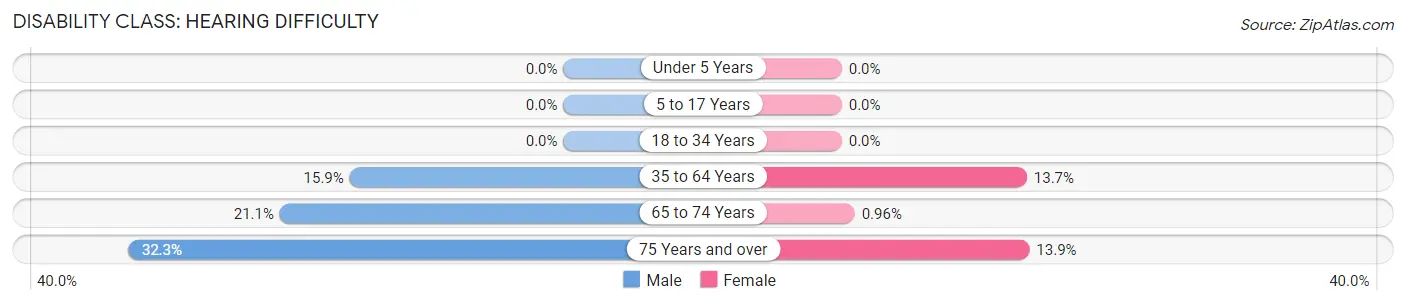
| Age Bracket | Male | Female |
| Under 5 Years | 0 (0.0%) | 0 (0.0%) |
| 5 to 17 Years | 0 (0.0%) | 0 (0.0%) |
| 18 to 34 Years | 0 (0.0%) | 0 (0.0%) |
| 35 to 64 Years | 73 (15.9%) | 82 (13.7%) |
| 65 to 74 Years | 20 (21.0%) | 2 (1.0%) |
| 75 Years and over | 20 (32.3%) | 17 (13.9%) |
Disability Class: Vision Difficulty
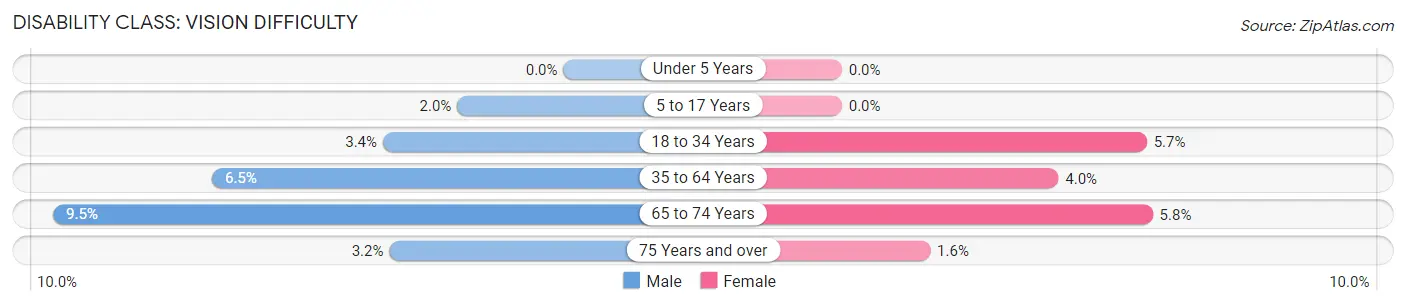
| Age Bracket | Male | Female |
| Under 5 Years | 0 (0.0%) | 0 (0.0%) |
| 5 to 17 Years | 7 (2.0%) | 0 (0.0%) |
| 18 to 34 Years | 7 (3.4%) | 15 (5.7%) |
| 35 to 64 Years | 30 (6.5%) | 24 (4.0%) |
| 65 to 74 Years | 9 (9.5%) | 12 (5.8%) |
| 75 Years and over | 2 (3.2%) | 2 (1.6%) |
Disability Class: Cognitive Difficulty
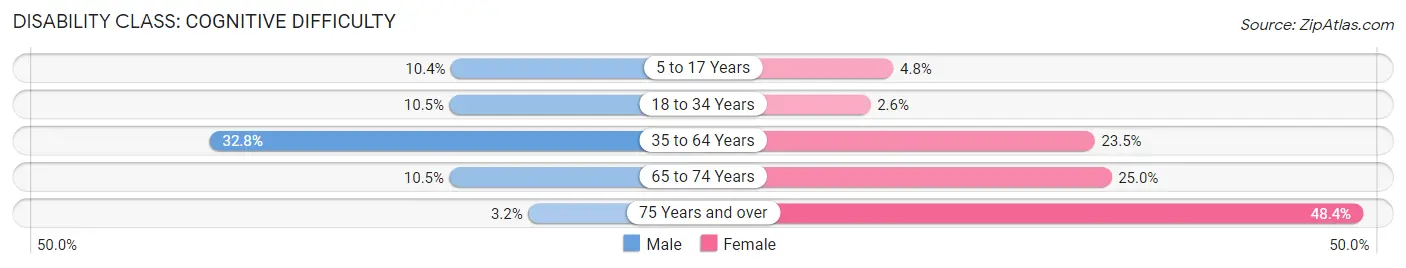
| Age Bracket | Male | Female |
| 5 to 17 Years | 37 (10.4%) | 10 (4.8%) |
| 18 to 34 Years | 22 (10.5%) | 7 (2.6%) |
| 35 to 64 Years | 151 (32.8%) | 140 (23.4%) |
| 65 to 74 Years | 10 (10.5%) | 52 (25.0%) |
| 75 Years and over | 2 (3.2%) | 59 (48.4%) |
Disability Class: Ambulatory Difficulty
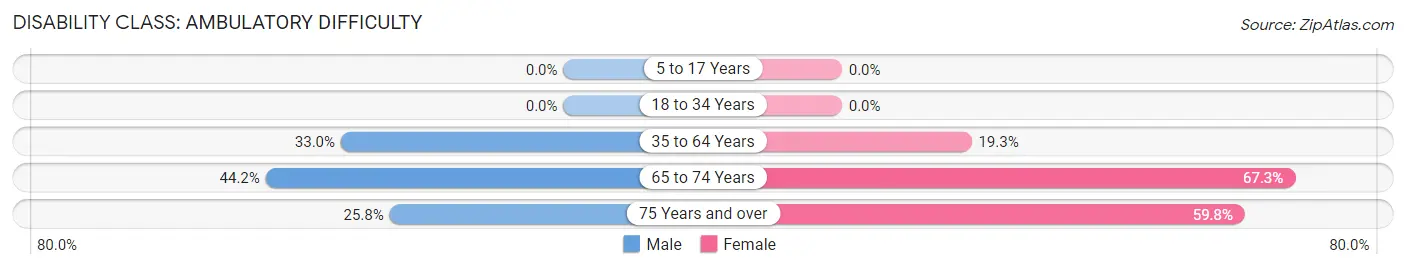
| Age Bracket | Male | Female |
| 5 to 17 Years | 0 (0.0%) | 0 (0.0%) |
| 18 to 34 Years | 0 (0.0%) | 0 (0.0%) |
| 35 to 64 Years | 152 (33.0%) | 115 (19.3%) |
| 65 to 74 Years | 42 (44.2%) | 140 (67.3%) |
| 75 Years and over | 16 (25.8%) | 73 (59.8%) |
Disability Class: Self-Care Difficulty
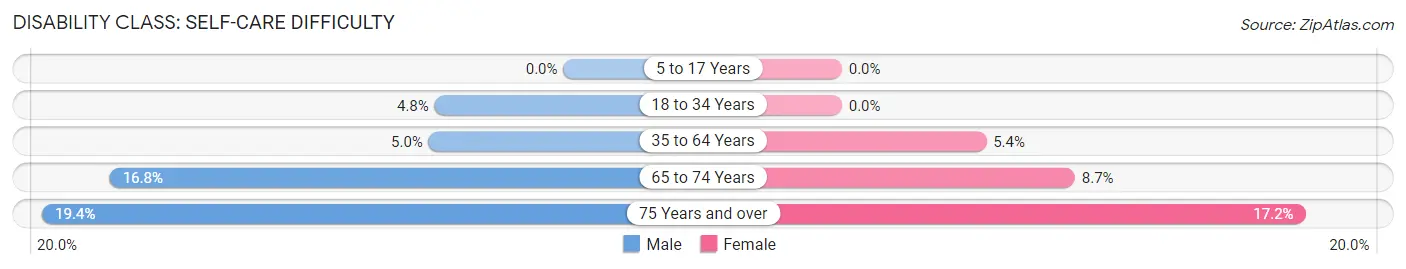
| Age Bracket | Male | Female |
| 5 to 17 Years | 0 (0.0%) | 0 (0.0%) |
| 18 to 34 Years | 10 (4.8%) | 0 (0.0%) |
| 35 to 64 Years | 23 (5.0%) | 32 (5.4%) |
| 65 to 74 Years | 16 (16.8%) | 18 (8.6%) |
| 75 Years and over | 12 (19.4%) | 21 (17.2%) |
Technology Access in Irvine
Computing Device Access in Irvine
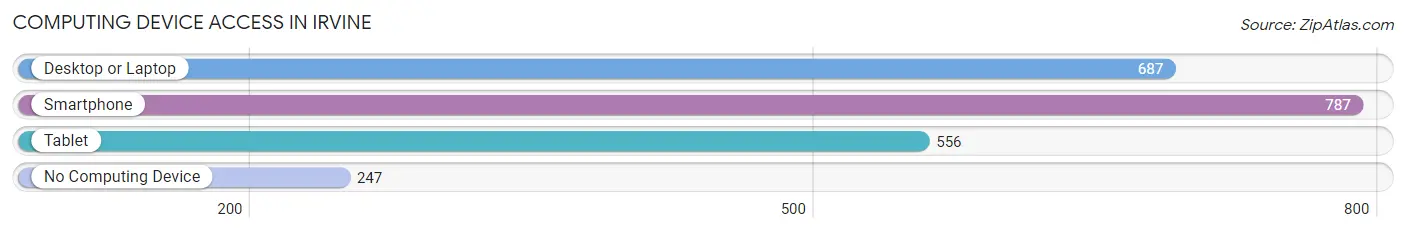
| Device Type | # Households | % Households |
| Desktop or Laptop | 687 | 57.9% |
| Smartphone | 787 | 66.4% |
| Tablet | 556 | 46.9% |
| No Computing Device | 247 | 20.8% |
| Total | 1,186 | 100.0% |
Internet Access in Irvine
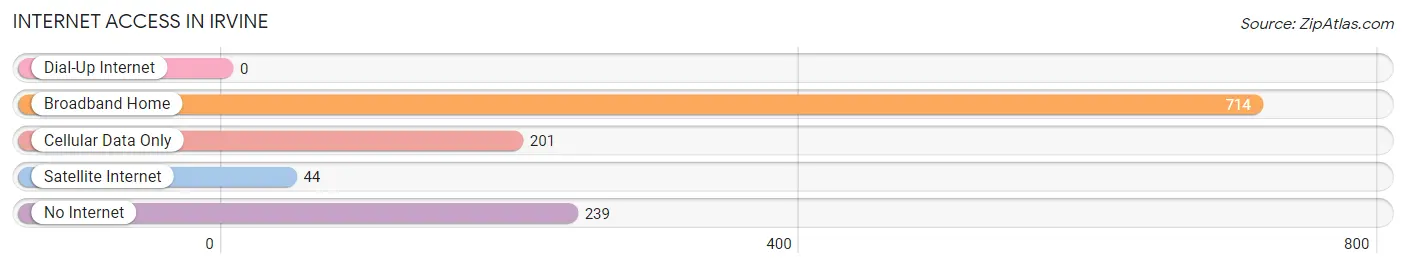
| Internet Type | # Households | % Households |
| Dial-Up Internet | 0 | 0.0% |
| Broadband Home | 714 | 60.2% |
| Cellular Data Only | 201 | 17.0% |
| Satellite Internet | 44 | 3.7% |
| No Internet | 239 | 20.2% |
| Total | 1,186 | 100.0% |
Irvine Summary
Irvine is a city located in Estill County, Kentucky, United States. It is the county seat of Estill County and the principal city of the Irvine Micropolitan Statistical Area, which includes all of Estill and Powell counties. As of the 2010 census, the city population was 2,444.
History
The area that is now Irvine was first settled in 1790 by William Irvine, a Revolutionary War veteran from Pennsylvania. He was granted a land grant of 1000 acres in the area, and he and his family established a homestead there. The town was officially established in 1812 and was named after William Irvine.
In 1854, the Kentucky General Assembly passed an act to incorporate the town of Irvine. The town was officially incorporated in 1855.
In the late 19th century, Irvine was a major center for the timber industry. The town was home to several sawmills and lumber yards, and the timber industry was a major source of employment for the town's residents.
Geography
Irvine is located in Estill County, Kentucky, in the foothills of the Appalachian Mountains. The city is situated at the confluence of the Kentucky River and the Red River. The city has a total area of 4.2 square miles, all of which is land.
The city is located approximately 50 miles southeast of Lexington, Kentucky, and approximately 75 miles north of Knoxville, Tennessee.
Economy
The economy of Irvine is largely based on agriculture and tourism. The city is home to several farms, and the surrounding area is known for its production of tobacco, corn, and hay.
The city is also a popular tourist destination, and is home to several attractions, including the Estill County Historical Society Museum, the Estill County Fairgrounds, and the Estill County Arts Council.
Demographics
As of the 2010 census, the population of Irvine was 2,444. The racial makeup of the city was 95.3% White, 1.2% African American, 0.3% Native American, 0.3% Asian, 0.1% Pacific Islander, 0.7% from other races, and 2.1% from two or more races. Hispanic or Latino of any race were 1.7% of the population.
The median household income in Irvine was $30,938, and the median family income was $37,917. The per capita income for the city was $17,845. About 17.2% of families and 20.2% of the population were below the poverty line, including 28.3% of those under age 18 and 16.2% of those age 65 or over.
Common Questions
What is Per Capita Income in Irvine?
Per Capita income in Irvine is $19,277.
What is the Median Family Income in Irvine?
Median Family Income in Irvine is $49,438.
What is the Median Household income in Irvine?
Median Household Income in Irvine is $31,359.
What is Income or Wage Gap in Irvine?
Income or Wage Gap in Irvine is 13.0%.
Women in Irvine earn 87.0 cents for every dollar earned by a man.
What is Inequality or Gini Index in Irvine?
Inequality or Gini Index in Irvine is 0.46.
What is the Total Population of Irvine?
Total Population of Irvine is 2,785.
What is the Total Male Population of Irvine?
Total Male Population of Irvine is 1,262.
What is the Total Female Population of Irvine?
Total Female Population of Irvine is 1,523.
What is the Ratio of Males per 100 Females in Irvine?
There are 82.86 Males per 100 Females in Irvine.
What is the Ratio of Females per 100 Males in Irvine?
There are 120.68 Females per 100 Males in Irvine.
What is the Median Population Age in Irvine?
Median Population Age in Irvine is 40.0 Years.
What is the Average Family Size in Irvine
Average Family Size in Irvine is 3.3 People.
What is the Average Household Size in Irvine
Average Household Size in Irvine is 2.3 People.
How Large is the Labor Force in Irvine?
There are 988 People in the Labor Forcein in Irvine.
What is the Percentage of People in the Labor Force in Irvine?
46.1% of People are in the Labor Force in Irvine.
What is the Unemployment Rate in Irvine?
Unemployment Rate in Irvine is 11.6%.