Trimble County, KY Map & Demographics
Trimble County Map
Trimble County Overview
$28,958
PER CAPITA INCOME
$74,564
AVG FAMILY INCOME
$66,492
AVG HOUSEHOLD INCOME
50.4%
WAGE / INCOME GAP [ % ]
49.6¢/ $1
WAGE / INCOME GAP [ $ ]
$9,616
FAMILY INCOME DEFICIT
0.43
INEQUALITY / GINI INDEX
8,510
TOTAL POPULATION
4,271
MALE POPULATION
4,239
FEMALE POPULATION
100.75
MALES / 100 FEMALES
99.25
FEMALES / 100 MALES
42.0
MEDIAN AGE
3.0
AVG FAMILY SIZE
2.6
AVG HOUSEHOLD SIZE
3,961
LABOR FORCE [ PEOPLE ]
57.4%
PERCENT IN LABOR FORCE
8.4%
UNEMPLOYMENT RATE
Trimble County Area Codes
Income in Trimble County
Income Overview in Trimble County
Per Capita Income in Trimble County is $28,958, while median incomes of families and households are $74,564 and $66,492 respectively.
| Characteristic | Number | Measure |
| Per Capita Income | 8,510 | $28,958 |
| Median Family Income | 2,300 | $74,564 |
| Mean Family Income | 2,300 | $85,267 |
| Median Household Income | 3,273 | $66,492 |
| Mean Household Income | 3,273 | $74,263 |
| Income Deficit | 2,300 | $9,616 |
| Wage / Income Gap (%) | 8,510 | 50.41% |
| Wage / Income Gap ($) | 8,510 | 49.59¢ per $1 |
| Gini / Inequality Index | 8,510 | 0.43 |
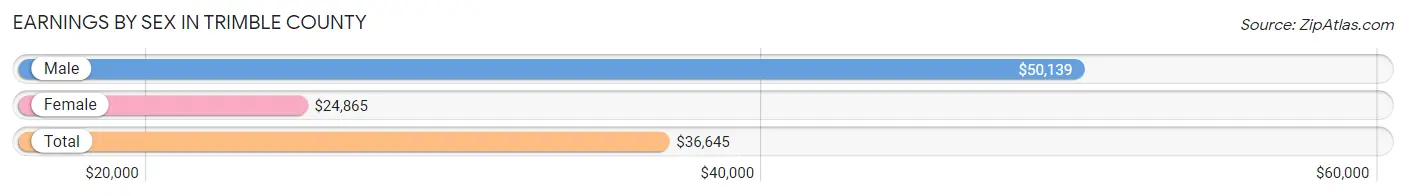
Earnings by Sex in Trimble County
Average Earnings in Trimble County are $36,645, $50,139 for men and $24,865 for women, a difference of 50.4%.
| Sex | Number | Average Earnings |
| Male | 2,126 (53.1%) | $50,139 |
| Female | 1,881 (46.9%) | $24,865 |
| Total | 4,007 (100.0%) | $36,645 |
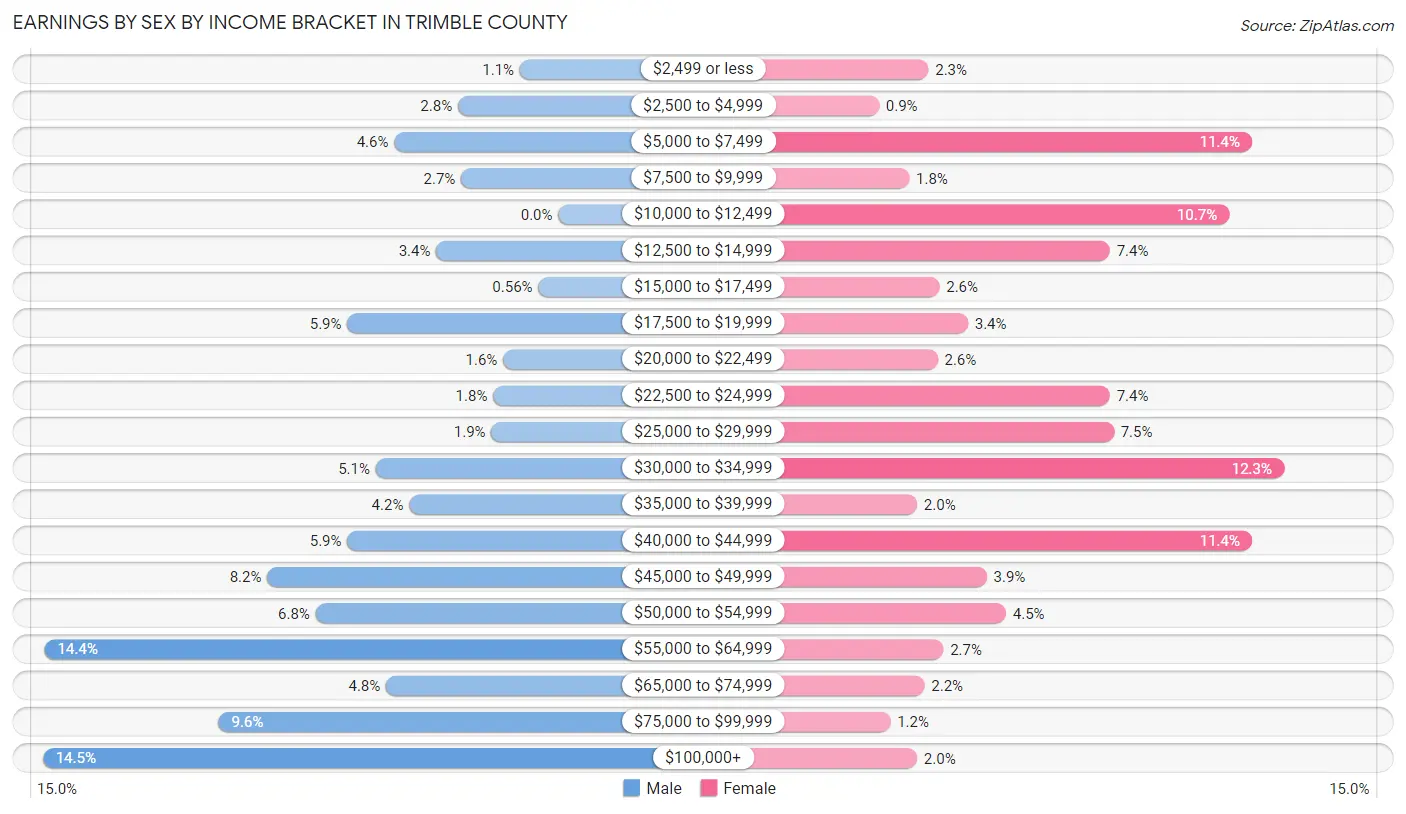
Earnings by Sex by Income Bracket in Trimble County
The most common earnings brackets in Trimble County are $100,000+ for men (308 | 14.5%) and $30,000 to $34,999 for women (231 | 12.3%).
| Income | Male | Female |
| $2,499 or less | 23 (1.1%) | 43 (2.3%) |
| $2,500 to $4,999 | 60 (2.8%) | 17 (0.9%) |
| $5,000 to $7,499 | 98 (4.6%) | 214 (11.4%) |
| $7,500 to $9,999 | 58 (2.7%) | 33 (1.8%) |
| $10,000 to $12,499 | 0 (0.0%) | 202 (10.7%) |
| $12,500 to $14,999 | 73 (3.4%) | 139 (7.4%) |
| $15,000 to $17,499 | 12 (0.6%) | 49 (2.6%) |
| $17,500 to $19,999 | 126 (5.9%) | 64 (3.4%) |
| $20,000 to $22,499 | 33 (1.5%) | 48 (2.5%) |
| $22,500 to $24,999 | 39 (1.8%) | 139 (7.4%) |
| $25,000 to $29,999 | 40 (1.9%) | 141 (7.5%) |
| $30,000 to $34,999 | 109 (5.1%) | 231 (12.3%) |
| $35,000 to $39,999 | 89 (4.2%) | 37 (2.0%) |
| $40,000 to $44,999 | 126 (5.9%) | 214 (11.4%) |
| $45,000 to $49,999 | 174 (8.2%) | 74 (3.9%) |
| $50,000 to $54,999 | 145 (6.8%) | 84 (4.5%) |
| $55,000 to $64,999 | 307 (14.4%) | 51 (2.7%) |
| $65,000 to $74,999 | 103 (4.8%) | 41 (2.2%) |
| $75,000 to $99,999 | 203 (9.6%) | 23 (1.2%) |
| $100,000+ | 308 (14.5%) | 37 (2.0%) |
| Total | 2,126 (100.0%) | 1,881 (100.0%) |
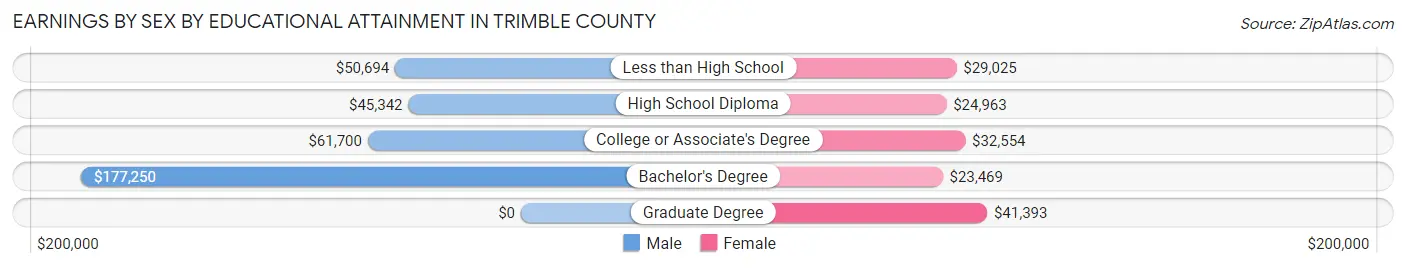
Earnings by Sex by Educational Attainment in Trimble County
Average earnings in Trimble County are $51,875 for men and $28,363 for women, a difference of 45.3%. Men with an educational attainment of bachelor's degree enjoy the highest average annual earnings of $177,250, while those with high school diploma education earn the least with $45,342. Women with an educational attainment of graduate degree earn the most with the average annual earnings of $41,393, while those with bachelor's degree education have the smallest earnings of $23,469.
| Educational Attainment | Male Income | Female Income |
| Less than High School | $50,694 | $29,025 |
| High School Diploma | $45,342 | $24,963 |
| College or Associate's Degree | $61,700 | $32,554 |
| Bachelor's Degree | $177,250 | $23,469 |
| Graduate Degree | - | - |
| Total | $51,875 | $28,363 |
Family Income in Trimble County
Family Income Brackets in Trimble County
According to the Trimble County family income data, there are 522 families falling into the $100,000 to $149,999 income range, which is the most common income bracket and makes up 22.7% of all families. Conversely, the $10,000 to $14,999 income bracket is the least frequent group with only 76 families (3.3%) belonging to this category.
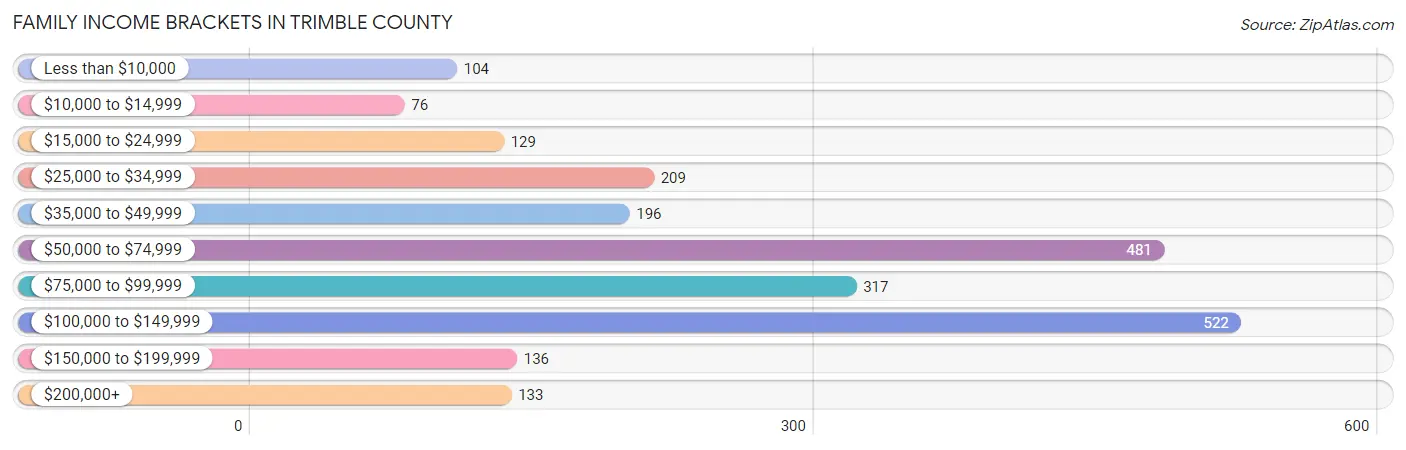
| Income Bracket | # Families | % Families |
| Less than $10,000 | 104 | 4.5% |
| $10,000 to $14,999 | 76 | 3.3% |
| $15,000 to $24,999 | 129 | 5.6% |
| $25,000 to $34,999 | 209 | 9.1% |
| $35,000 to $49,999 | 196 | 8.5% |
| $50,000 to $74,999 | 481 | 20.9% |
| $75,000 to $99,999 | 317 | 13.8% |
| $100,000 to $149,999 | 522 | 22.7% |
| $150,000 to $199,999 | 136 | 5.9% |
| $200,000+ | 133 | 5.8% |
Family Income by Famaliy Size in Trimble County
4-person families (281 | 12.2%) account for the highest median family income in Trimble County with $122,348 per family, while 3-person families (367 | 16.0%) have the highest median income of $39,013 per family member.
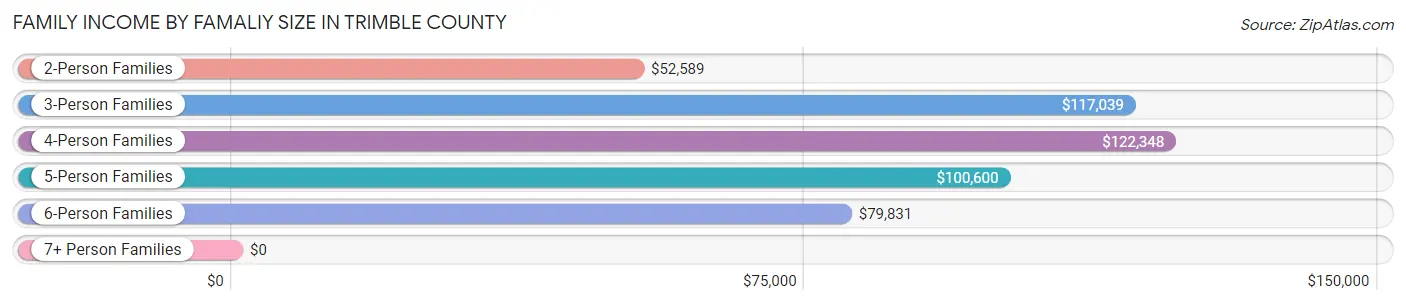
| Income Bracket | # Families | Median Income |
| 2-Person Families | 1,315 (57.2%) | $52,589 |
| 3-Person Families | 367 (16.0%) | $117,039 |
| 4-Person Families | 281 (12.2%) | $122,348 |
| 5-Person Families | 166 (7.2%) | $100,600 |
| 6-Person Families | 162 (7.0%) | $79,831 |
| 7+ Person Families | 9 (0.4%) | $0 |
| Total | 2,300 (100.0%) | $74,564 |
Family Income by Number of Earners in Trimble County
The median family income in Trimble County is $74,564, with families comprising 3+ earners (221) having the highest median family income of $142,702, while families with no earners (610) have the lowest median family income of $34,302, accounting for 9.6% and 26.5% of families, respectively.
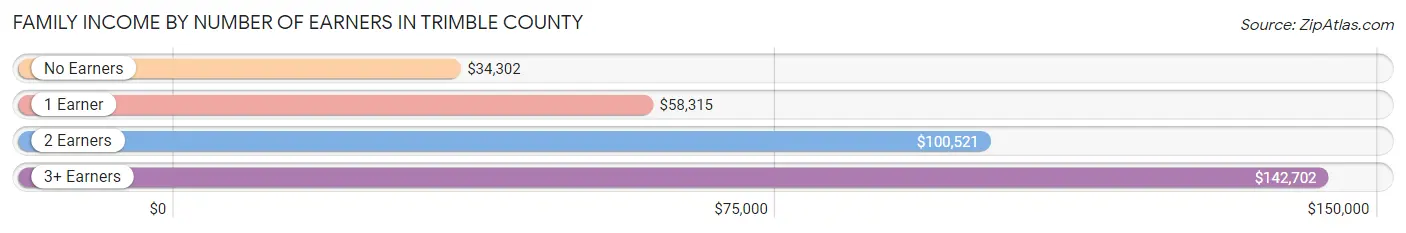
| Number of Earners | # Families | Median Income |
| No Earners | 610 (26.5%) | $34,302 |
| 1 Earner | 586 (25.5%) | $58,315 |
| 2 Earners | 883 (38.4%) | $100,521 |
| 3+ Earners | 221 (9.6%) | $142,702 |
| Total | 2,300 (100.0%) | $74,564 |
Household Income in Trimble County
Household Income Brackets in Trimble County
With 566 households falling in the category, the $75,000 to $99,999 income range is the most frequent in Trimble County, accounting for 17.3% of all households. In contrast, only 137 households (4.2%) fall into the $200,000+ income bracket, making it the least populous group.
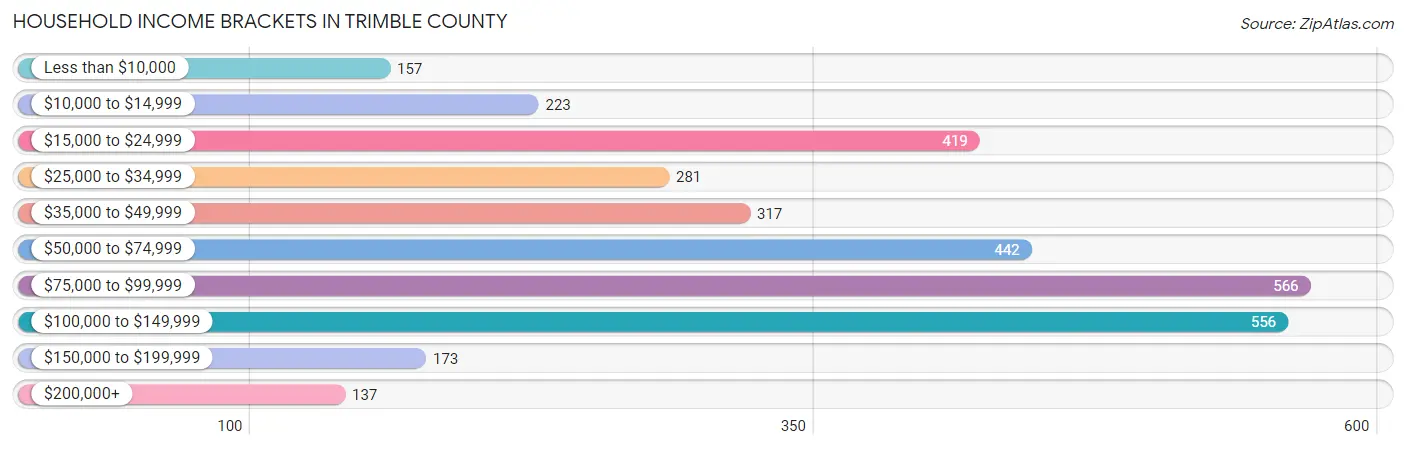
| Income Bracket | # Households | % Households |
| Less than $10,000 | 157 | 4.8% |
| $10,000 to $14,999 | 223 | 6.8% |
| $15,000 to $24,999 | 419 | 12.8% |
| $25,000 to $34,999 | 281 | 8.6% |
| $35,000 to $49,999 | 317 | 9.7% |
| $50,000 to $74,999 | 442 | 13.5% |
| $75,000 to $99,999 | 566 | 17.3% |
| $100,000 to $149,999 | 556 | 17.0% |
| $150,000 to $199,999 | 173 | 5.3% |
| $200,000+ | 137 | 4.2% |
Household Income by Householder Age in Trimble County
The median household income in Trimble County is $66,492, with the highest median household income of $85,750 found in the 15 to 24 years age bracket for the primary householder. A total of 11 households (0.3%) fall into this category. Meanwhile, the 65+ years age bracket for the primary householder has the lowest median household income of $33,579, with 983 households (30.0%) in this group.
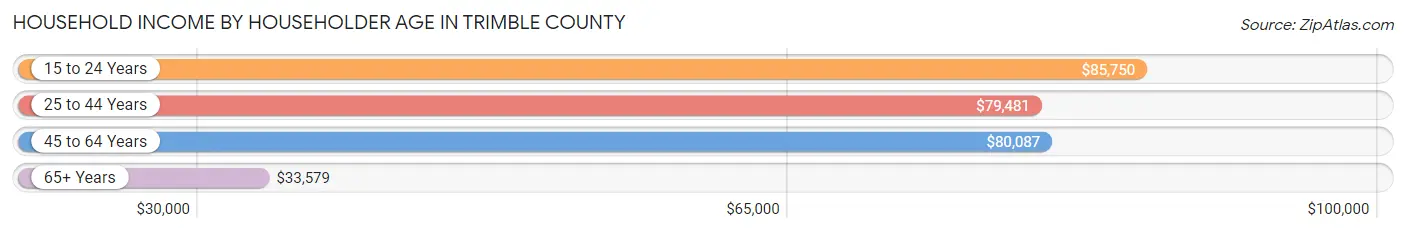
| Income Bracket | # Households | Median Income |
| 15 to 24 Years | 11 (0.3%) | $85,750 |
| 25 to 44 Years | 910 (27.8%) | $79,481 |
| 45 to 64 Years | 1,369 (41.8%) | $80,087 |
| 65+ Years | 983 (30.0%) | $33,579 |
| Total | 3,273 (100.0%) | $66,492 |
Poverty in Trimble County
Income Below Poverty by Sex and Age in Trimble County
With 11.2% poverty level for males and 16.2% for females among the residents of Trimble County, 55 to 64 year old males and 18 to 24 year old females are the most vulnerable to poverty, with 119 males (18.9%) and 266 females (84.2%) in their respective age groups living below the poverty level.
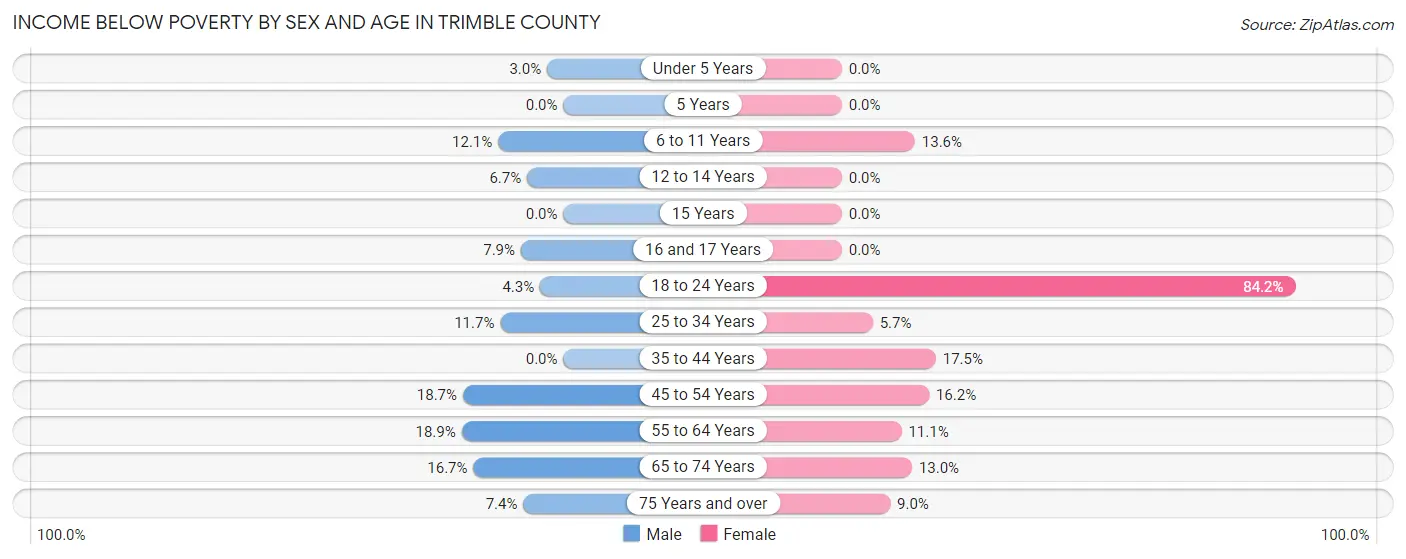
| Age Bracket | Male | Female |
| Under 5 Years | 7 (3.0%) | 0 (0.0%) |
| 5 Years | 0 (0.0%) | 0 (0.0%) |
| 6 to 11 Years | 27 (12.1%) | 48 (13.6%) |
| 12 to 14 Years | 12 (6.7%) | 0 (0.0%) |
| 15 Years | 0 (0.0%) | 0 (0.0%) |
| 16 and 17 Years | 12 (7.9%) | 0 (0.0%) |
| 18 to 24 Years | 15 (4.3%) | 266 (84.2%) |
| 25 to 34 Years | 67 (11.7%) | 31 (5.7%) |
| 35 to 44 Years | 0 (0.0%) | 85 (17.4%) |
| 45 to 54 Years | 113 (18.6%) | 94 (16.2%) |
| 55 to 64 Years | 119 (18.9%) | 71 (11.1%) |
| 65 to 74 Years | 76 (16.7%) | 60 (13.0%) |
| 75 Years and over | 18 (7.4%) | 26 (9.0%) |
| Total | 466 (11.2%) | 681 (16.2%) |
Income Above Poverty by Sex and Age in Trimble County
According to the poverty statistics in Trimble County, males aged 5 years and females aged under 5 years are the age groups that are most secure financially, with 100.0% of males and 100.0% of females in these age groups living above the poverty line.
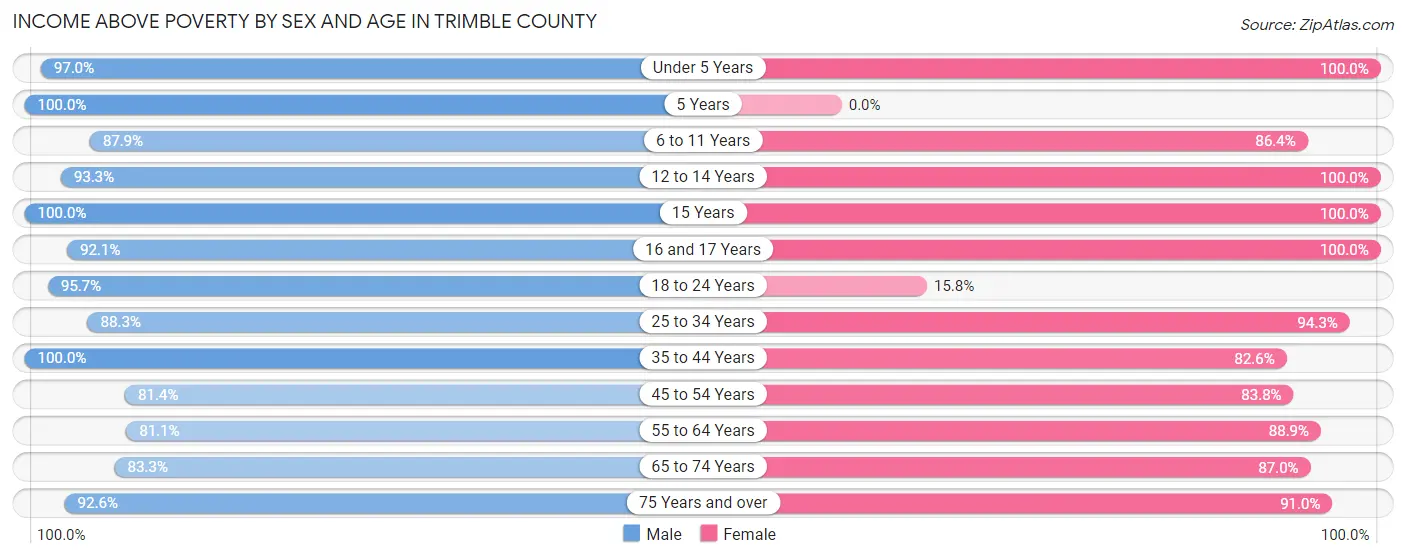
| Age Bracket | Male | Female |
| Under 5 Years | 224 (97.0%) | 180 (100.0%) |
| 5 Years | 35 (100.0%) | 0 (0.0%) |
| 6 to 11 Years | 196 (87.9%) | 306 (86.4%) |
| 12 to 14 Years | 166 (93.3%) | 209 (100.0%) |
| 15 Years | 45 (100.0%) | 63 (100.0%) |
| 16 and 17 Years | 140 (92.1%) | 74 (100.0%) |
| 18 to 24 Years | 332 (95.7%) | 50 (15.8%) |
| 25 to 34 Years | 505 (88.3%) | 509 (94.3%) |
| 35 to 44 Years | 458 (100.0%) | 402 (82.6%) |
| 45 to 54 Years | 493 (81.4%) | 487 (83.8%) |
| 55 to 64 Years | 511 (81.1%) | 570 (88.9%) |
| 65 to 74 Years | 379 (83.3%) | 401 (87.0%) |
| 75 Years and over | 224 (92.6%) | 264 (91.0%) |
| Total | 3,708 (88.8%) | 3,515 (83.8%) |
Income Below Poverty Among Married-Couple Families in Trimble County
The poverty statistics for married-couple families in Trimble County show that 2.9% or 47 of the total 1,643 families live below the poverty line. Families with no children have the highest poverty rate of 3.4%, comprising of 35 families. On the other hand, families with 3 or 4 children have the lowest poverty rate of 0.0%, which includes 0 families.
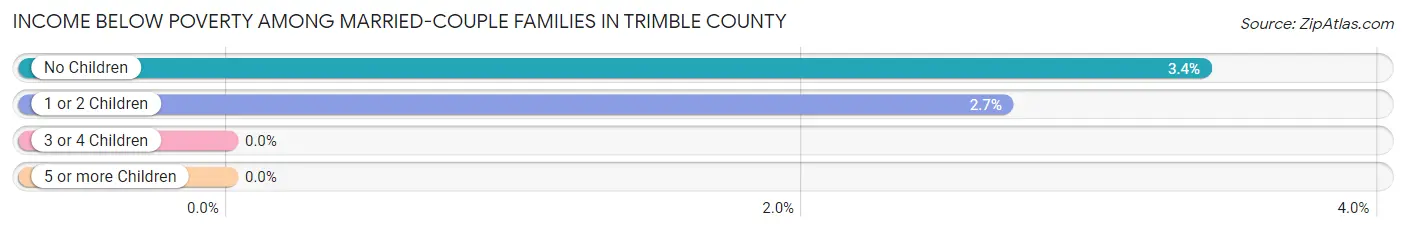
| Children | Above Poverty | Below Poverty |
| No Children | 996 (96.6%) | 35 (3.4%) |
| 1 or 2 Children | 433 (97.3%) | 12 (2.7%) |
| 3 or 4 Children | 160 (100.0%) | 0 (0.0%) |
| 5 or more Children | 7 (100.0%) | 0 (0.0%) |
| Total | 1,596 (97.1%) | 47 (2.9%) |
Income Below Poverty Among Single-Parent Households in Trimble County
According to the poverty data in Trimble County, 30.8% or 76 single-father households and 26.3% or 108 single-mother households are living below the poverty line. Among single-father households, those with no children have the highest poverty rate, with 60 households (33.0%) experiencing poverty. Likewise, among single-mother households, those with no children have the highest poverty rate, with 63 households (39.1%) falling below the poverty line.
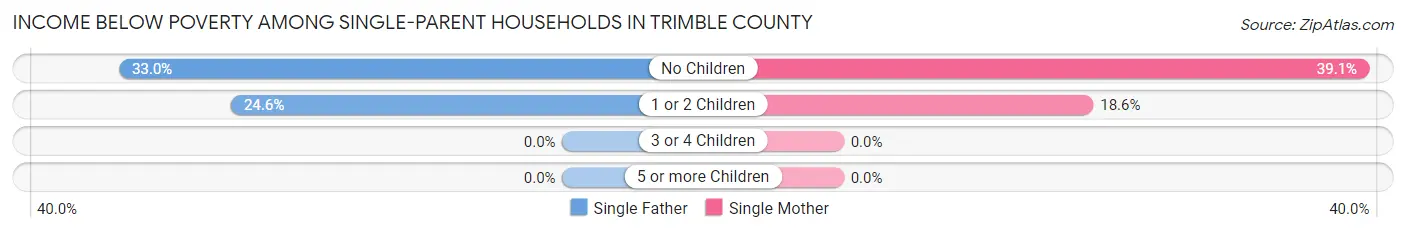
| Children | Single Father | Single Mother |
| No Children | 60 (33.0%) | 63 (39.1%) |
| 1 or 2 Children | 16 (24.6%) | 45 (18.6%) |
| 3 or 4 Children | 0 (0.0%) | 0 (0.0%) |
| 5 or more Children | 0 (0.0%) | 0 (0.0%) |
| Total | 76 (30.8%) | 108 (26.3%) |
Income Below Poverty Among Married-Couple vs Single-Parent Households in Trimble County
The poverty data for Trimble County shows that 47 of the married-couple family households (2.9%) and 184 of the single-parent households (28.0%) are living below the poverty level. Within the married-couple family households, those with no children have the highest poverty rate, with 35 households (3.4%) falling below the poverty line. Among the single-parent households, those with no children have the highest poverty rate, with 123 household (35.9%) living below poverty.
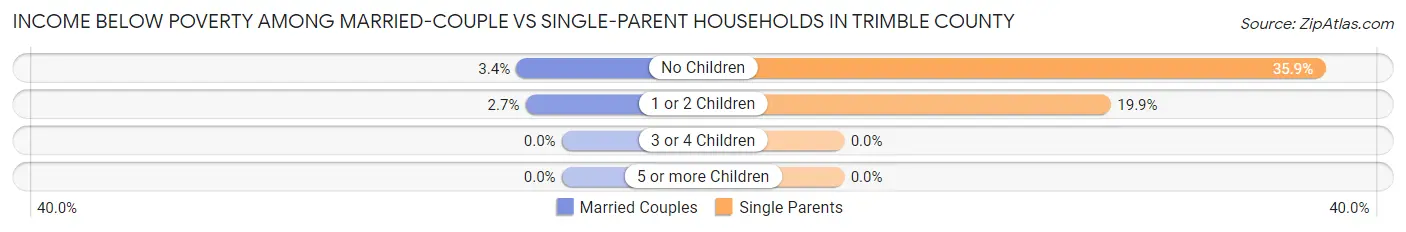
| Children | Married-Couple Families | Single-Parent Households |
| No Children | 35 (3.4%) | 123 (35.9%) |
| 1 or 2 Children | 12 (2.7%) | 61 (19.9%) |
| 3 or 4 Children | 0 (0.0%) | 0 (0.0%) |
| 5 or more Children | 0 (0.0%) | 0 (0.0%) |
| Total | 47 (2.9%) | 184 (28.0%) |
Race in Trimble County
The most populous races in Trimble County are White / Caucasian (7,966 | 93.6%), Hispanic or Latino (291 | 3.4%), and Two or more Races (274 | 3.2%).
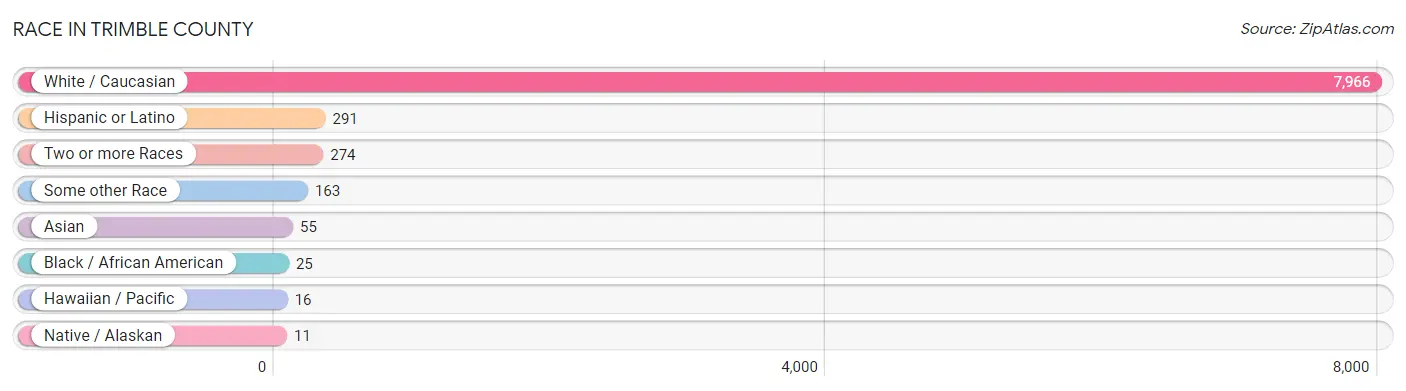
| Race | # Population | % Population |
| Asian | 55 | 0.6% |
| Black / African American | 25 | 0.3% |
| Hawaiian / Pacific | 16 | 0.2% |
| Hispanic or Latino | 291 | 3.4% |
| Native / Alaskan | 11 | 0.1% |
| White / Caucasian | 7,966 | 93.6% |
| Two or more Races | 274 | 3.2% |
| Some other Race | 163 | 1.9% |
| Total | 8,510 | 100.0% |
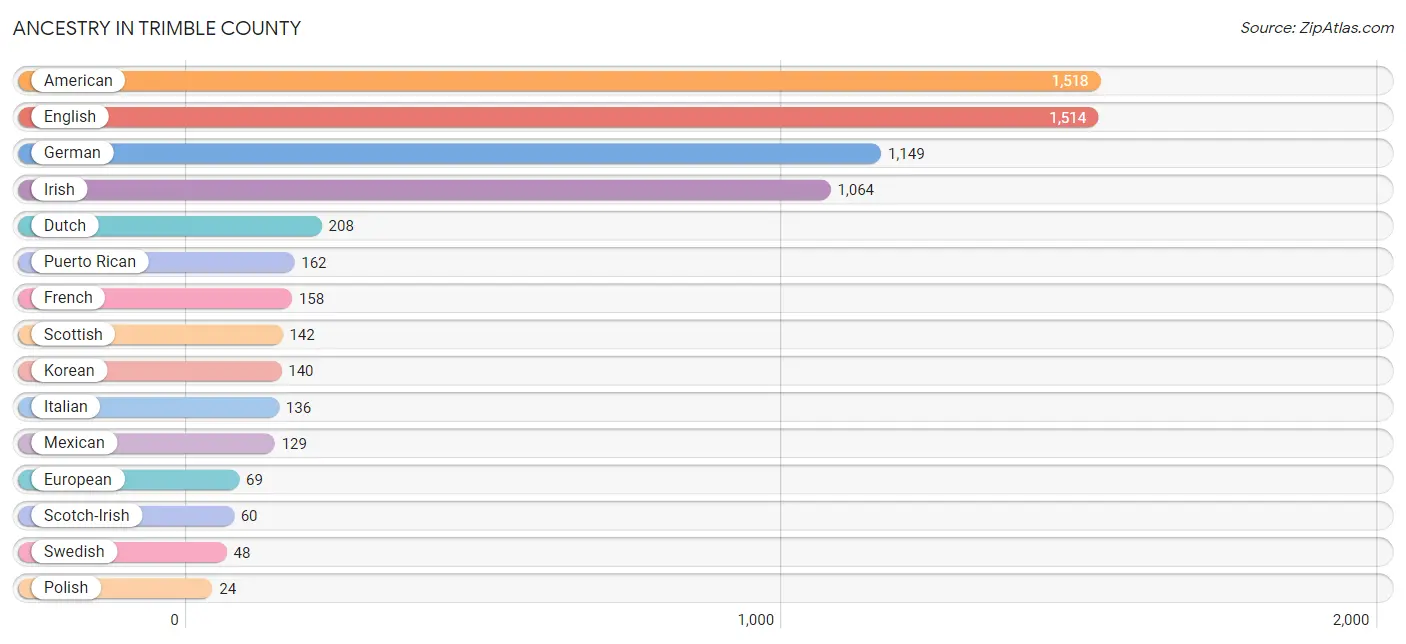
Ancestry in Trimble County
The most populous ancestries reported in Trimble County are American (1,518 | 17.8%), English (1,514 | 17.8%), German (1,149 | 13.5%), Irish (1,064 | 12.5%), and Dutch (208 | 2.4%), together accounting for 64.1% of all Trimble County residents.
| Ancestry | # Population | % Population |
| American | 1,518 | 17.8% |
| Apache | 11 | 0.1% |
| Bhutanese | 17 | 0.2% |
| British | 19 | 0.2% |
| Czech | 3 | 0.0% |
| Dutch | 208 | 2.4% |
| Eastern European | 13 | 0.2% |
| English | 1,514 | 17.8% |
| European | 69 | 0.8% |
| Fijian | 16 | 0.2% |
| French | 158 | 1.9% |
| German | 1,149 | 13.5% |
| German Russian | 4 | 0.1% |
| Irish | 1,064 | 12.5% |
| Italian | 136 | 1.6% |
| Korean | 140 | 1.7% |
| Laotian | 2 | 0.0% |
| Lithuanian | 10 | 0.1% |
| Mexican | 129 | 1.5% |
| Norwegian | 18 | 0.2% |
| Polish | 24 | 0.3% |
| Portuguese | 3 | 0.0% |
| Puerto Rican | 162 | 1.9% |
| Scandinavian | 2 | 0.0% |
| Scotch-Irish | 60 | 0.7% |
| Scottish | 142 | 1.7% |
| Swedish | 48 | 0.6% |
| Welsh | 23 | 0.3% |
| Yugoslavian | 20 | 0.2% | View All 29 Rows |
Immigrants in Trimble County
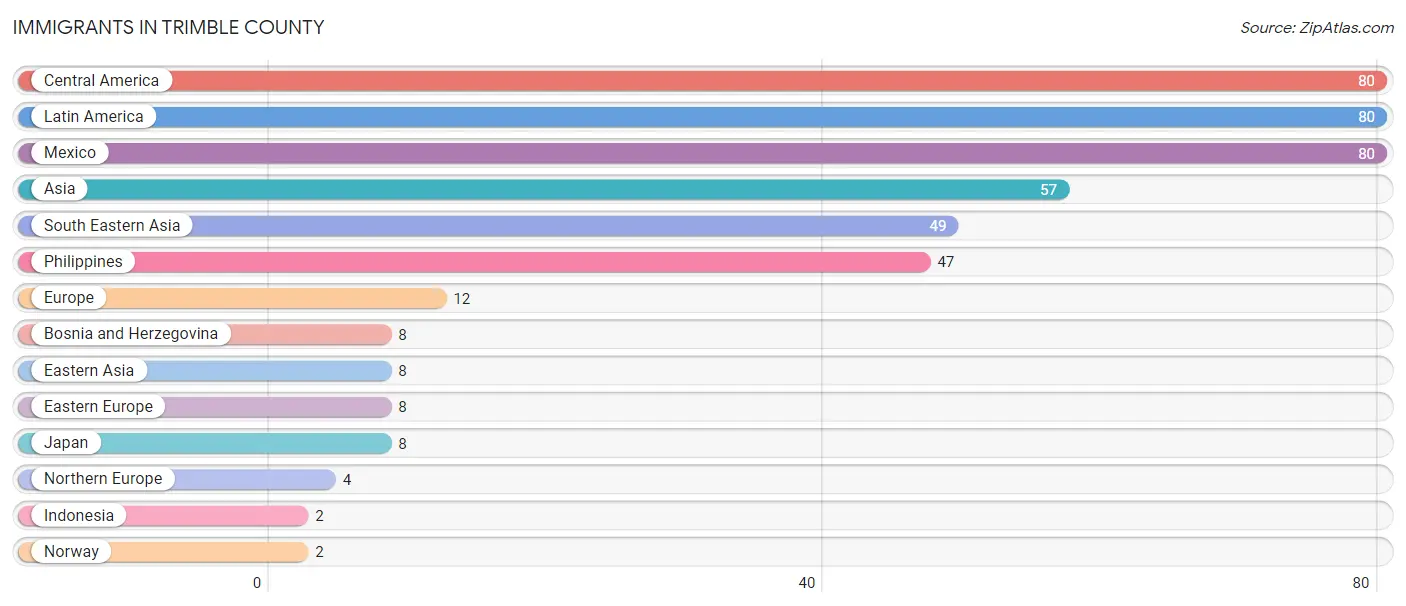
The most numerous immigrant groups reported in Trimble County came from Central America (80 | 0.9%), Latin America (80 | 0.9%), Mexico (80 | 0.9%), Asia (57 | 0.7%), and South Eastern Asia (49 | 0.6%), together accounting for 4.1% of all Trimble County residents.
| Immigration Origin | # Population | % Population |
| Asia | 57 | 0.7% |
| Bosnia and Herzegovina | 8 | 0.1% |
| Central America | 80 | 0.9% |
| Eastern Asia | 8 | 0.1% |
| Eastern Europe | 8 | 0.1% |
| Europe | 12 | 0.1% |
| Indonesia | 2 | 0.0% |
| Japan | 8 | 0.1% |
| Latin America | 80 | 0.9% |
| Mexico | 80 | 0.9% |
| Northern Europe | 4 | 0.1% |
| Norway | 2 | 0.0% |
| Philippines | 47 | 0.5% |
| South Eastern Asia | 49 | 0.6% | View All 14 Rows |
Sex and Age in Trimble County
Sex and Age in Trimble County
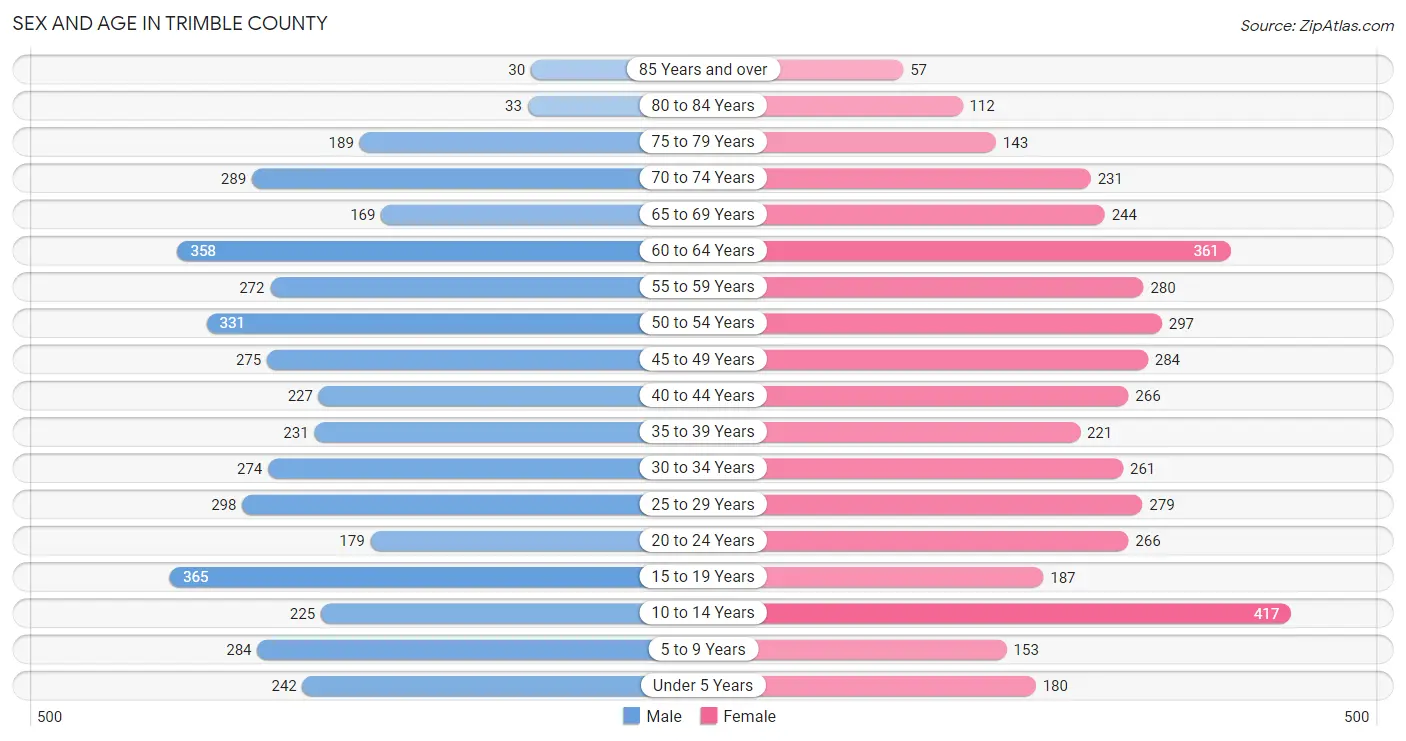
The most populous age groups in Trimble County are 15 to 19 Years (365 | 8.6%) for men and 10 to 14 Years (417 | 9.8%) for women.
| Age Bracket | Male | Female |
| Under 5 Years | 242 (5.7%) | 180 (4.3%) |
| 5 to 9 Years | 284 (6.7%) | 153 (3.6%) |
| 10 to 14 Years | 225 (5.3%) | 417 (9.8%) |
| 15 to 19 Years | 365 (8.6%) | 187 (4.4%) |
| 20 to 24 Years | 179 (4.2%) | 266 (6.3%) |
| 25 to 29 Years | 298 (7.0%) | 279 (6.6%) |
| 30 to 34 Years | 274 (6.4%) | 261 (6.2%) |
| 35 to 39 Years | 231 (5.4%) | 221 (5.2%) |
| 40 to 44 Years | 227 (5.3%) | 266 (6.3%) |
| 45 to 49 Years | 275 (6.4%) | 284 (6.7%) |
| 50 to 54 Years | 331 (7.7%) | 297 (7.0%) |
| 55 to 59 Years | 272 (6.4%) | 280 (6.6%) |
| 60 to 64 Years | 358 (8.4%) | 361 (8.5%) |
| 65 to 69 Years | 169 (4.0%) | 244 (5.8%) |
| 70 to 74 Years | 289 (6.8%) | 231 (5.4%) |
| 75 to 79 Years | 189 (4.4%) | 143 (3.4%) |
| 80 to 84 Years | 33 (0.8%) | 112 (2.6%) |
| 85 Years and over | 30 (0.7%) | 57 (1.3%) |
| Total | 4,271 (100.0%) | 4,239 (100.0%) |
Families and Households in Trimble County
Median Family Size in Trimble County
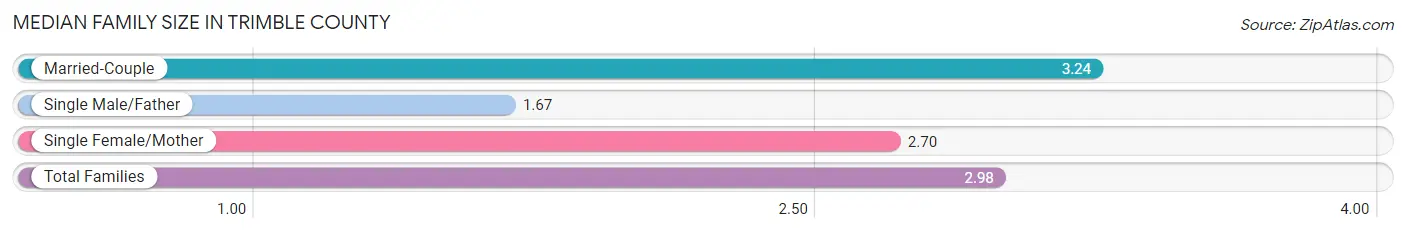
The median family size in Trimble County is 2.98 persons per family, with married-couple families (1,643 | 71.4%) accounting for the largest median family size of 3.24 persons per family. On the other hand, single male/father families (247 | 10.7%) represent the smallest median family size with 1.67 persons per family.
| Family Type | # Families | Family Size |
| Married-Couple | 1,643 (71.4%) | 3.24 |
| Single Male/Father | 247 (10.7%) | 1.67 |
| Single Female/Mother | 410 (17.8%) | 2.70 |
| Total Families | 2,300 (100.0%) | 2.98 |
Median Household Size in Trimble County
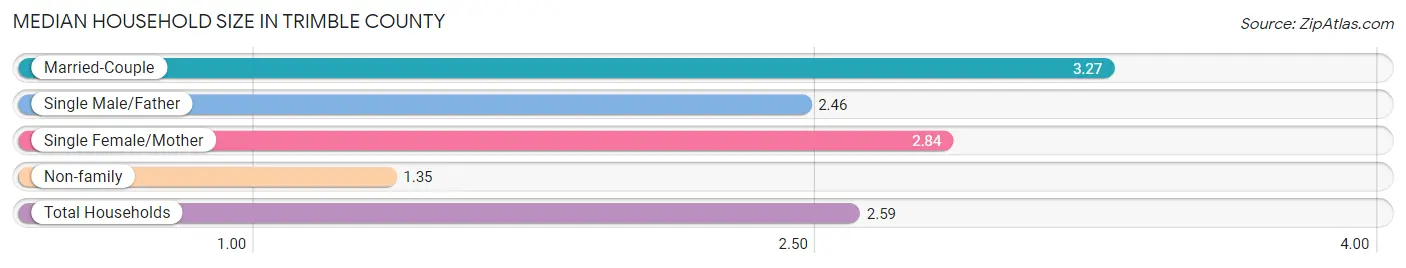
The median household size in Trimble County is 2.59 persons per household, with married-couple households (1,643 | 50.2%) accounting for the largest median household size of 3.27 persons per household. non-family households (973 | 29.7%) represent the smallest median household size with 1.35 persons per household.
| Household Type | # Households | Household Size |
| Married-Couple | 1,643 (50.2%) | 3.27 |
| Single Male/Father | 247 (7.5%) | 2.46 |
| Single Female/Mother | 410 (12.5%) | 2.84 |
| Non-family | 973 (29.7%) | 1.35 |
| Total Households | 3,273 (100.0%) | 2.59 |
Household Size by Marriage Status in Trimble County
Out of a total of 3,273 households in Trimble County, 2,300 (70.3%) are family households, while 973 (29.7%) are nonfamily households. The most numerous type of family households are 2-person households, comprising 1,143, and the most common type of nonfamily households are 1-person households, comprising 752.
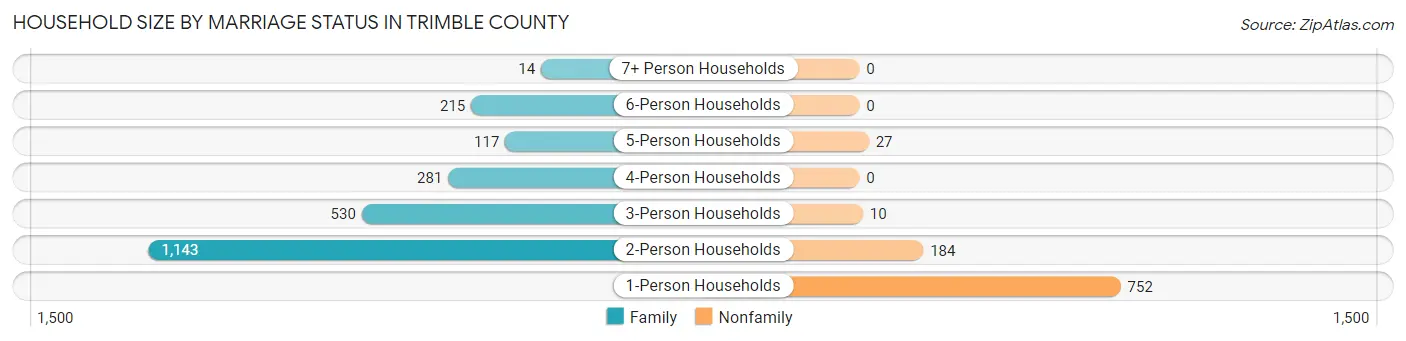
| Household Size | Family Households | Nonfamily Households |
| 1-Person Households | - | 752 (23.0%) |
| 2-Person Households | 1,143 (34.9%) | 184 (5.6%) |
| 3-Person Households | 530 (16.2%) | 10 (0.3%) |
| 4-Person Households | 281 (8.6%) | 0 (0.0%) |
| 5-Person Households | 117 (3.6%) | 27 (0.8%) |
| 6-Person Households | 215 (6.6%) | 0 (0.0%) |
| 7+ Person Households | 14 (0.4%) | 0 (0.0%) |
| Total | 2,300 (70.3%) | 973 (29.7%) |
Female Fertility in Trimble County
Fertility by Age in Trimble County
Average fertility rate in Trimble County is 12.0 births per 1,000 women. Women in the age bracket of 15 to 19 years have the highest fertility rate with 53.0 births per 1,000 women. Women in the age bracket of 20 to 34 years acount for 52.4% of all women with births.
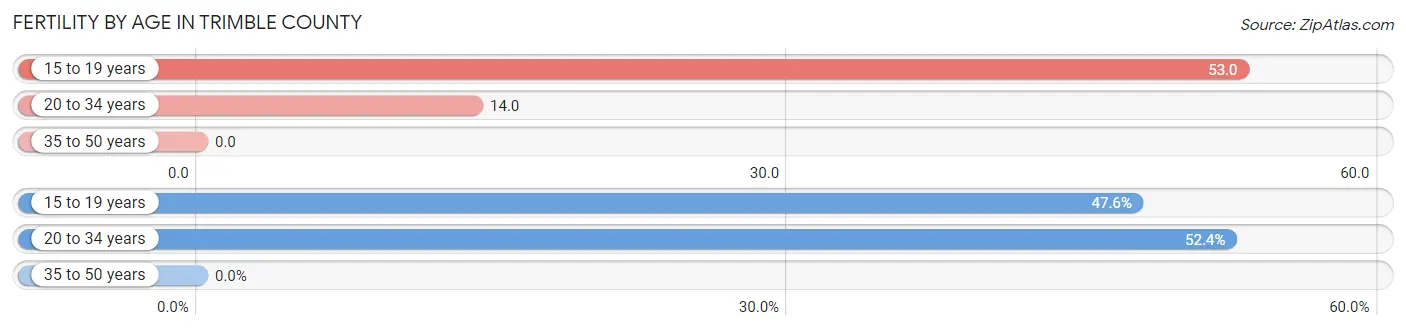
| Age Bracket | Women with Births | Births / 1,000 Women |
| 15 to 19 years | 10 (47.6%) | 53.0 |
| 20 to 34 years | 11 (52.4%) | 14.0 |
| 35 to 50 years | 0 (0.0%) | 0.0 |
| Total | 21 (100.0%) | 12.0 |
Fertility by Age by Marriage Status in Trimble County
61.9% of women with births (21) in Trimble County are married. The highest percentage of unmarried women with births falls into 20 to 34 years age bracket with 72.7% of them unmarried at the time of birth, while the lowest percentage of unmarried women with births belong to 15 to 19 years age bracket with 0.0% of them unmarried.
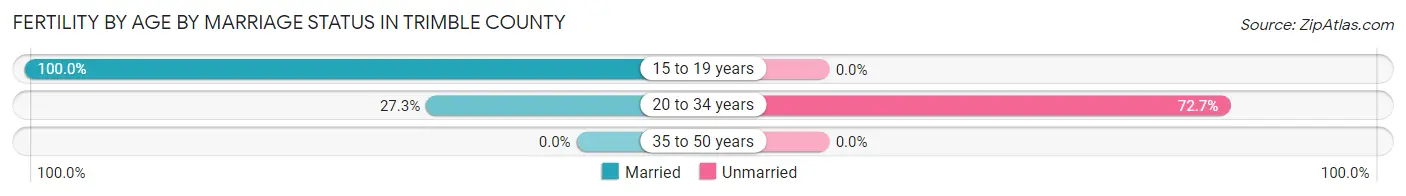
| Age Bracket | Married | Unmarried |
| 15 to 19 years | 10 (100.0%) | 0 (0.0%) |
| 20 to 34 years | 3 (27.3%) | 8 (72.7%) |
| 35 to 50 years | 0 (0.0%) | 0 (0.0%) |
| Total | 13 (61.9%) | 8 (38.1%) |
Fertility by Education in Trimble County
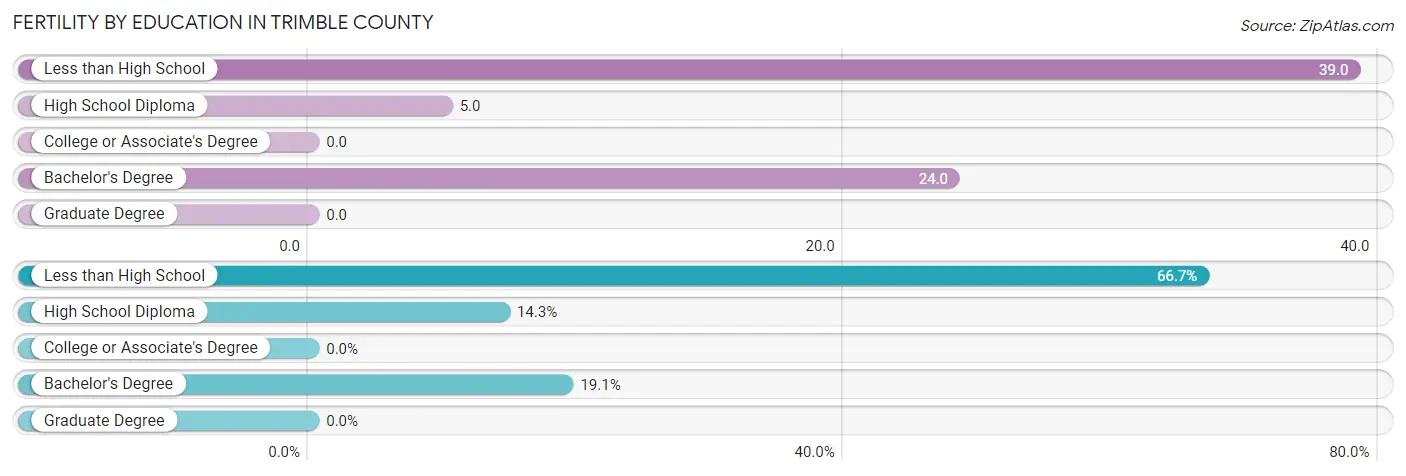
| Educational Attainment | Women with Births | Births / 1,000 Women |
| Less than High School | 14 (66.7%) | 39.0 |
| High School Diploma | 3 (14.3%) | 5.0 |
| College or Associate's Degree | 0 (0.0%) | 0.0 |
| Bachelor's Degree | 4 (19.1%) | 24.0 |
| Graduate Degree | 0 (0.0%) | 0.0 |
| Total | 21 (100.0%) | 12.0 |
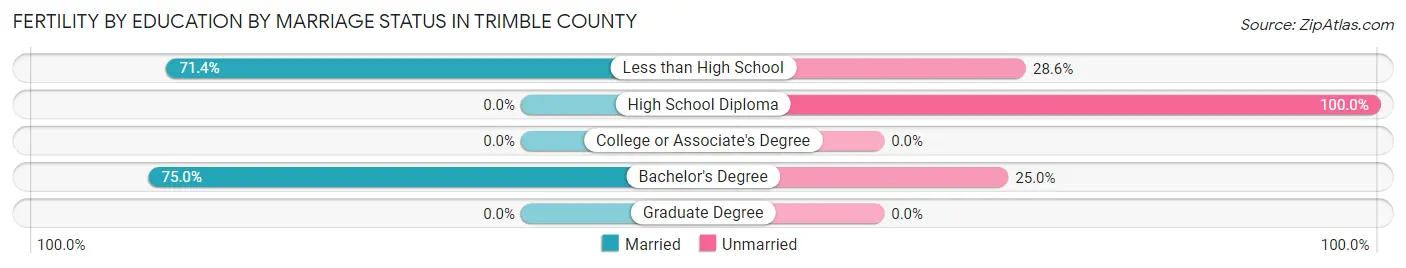
Fertility by Education by Marriage Status in Trimble County
38.1% of women with births in Trimble County are unmarried. Women with the educational attainment of bachelor's degree are most likely to be married with 75.0% of them married at childbirth, while women with the educational attainment of high school diploma are least likely to be married with 100.0% of them unmarried at childbirth.
| Educational Attainment | Married | Unmarried |
| Less than High School | 10 (71.4%) | 4 (28.6%) |
| High School Diploma | 0 (0.0%) | 3 (100.0%) |
| College or Associate's Degree | 0 (0.0%) | 0 (0.0%) |
| Bachelor's Degree | 3 (75.0%) | 1 (25.0%) |
| Graduate Degree | 0 (0.0%) | 0 (0.0%) |
| Total | 13 (61.9%) | 8 (38.1%) |
Employment Characteristics in Trimble County
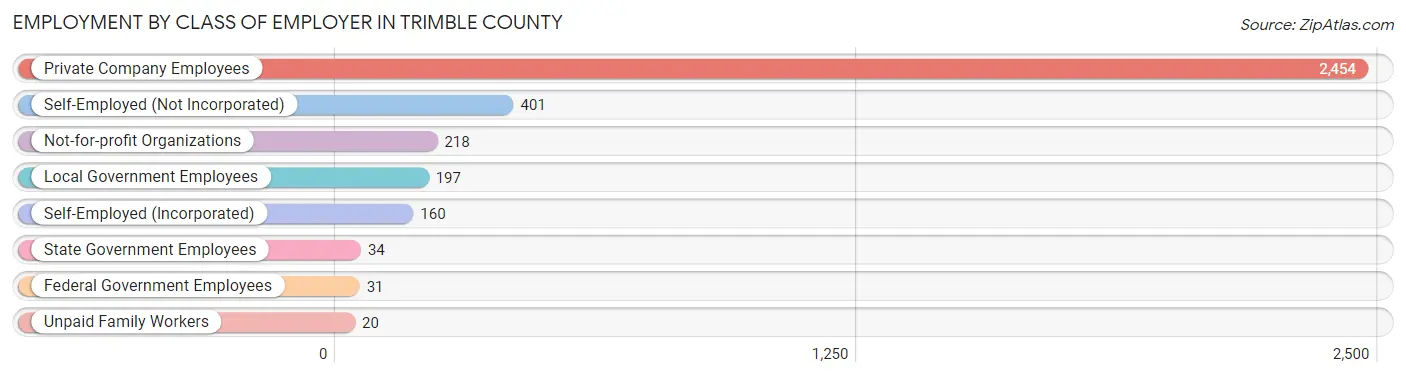
Employment by Class of Employer in Trimble County
Among the 3,515 employed individuals in Trimble County, private company employees (2,454 | 69.8%), self-employed (not incorporated) (401 | 11.4%), and not-for-profit organizations (218 | 6.2%) make up the most common classes of employment.
| Employer Class | # Employees | % Employees |
| Private Company Employees | 2,454 | 69.8% |
| Self-Employed (Incorporated) | 160 | 4.5% |
| Self-Employed (Not Incorporated) | 401 | 11.4% |
| Not-for-profit Organizations | 218 | 6.2% |
| Local Government Employees | 197 | 5.6% |
| State Government Employees | 34 | 1.0% |
| Federal Government Employees | 31 | 0.9% |
| Unpaid Family Workers | 20 | 0.6% |
| Total | 3,515 | 100.0% |
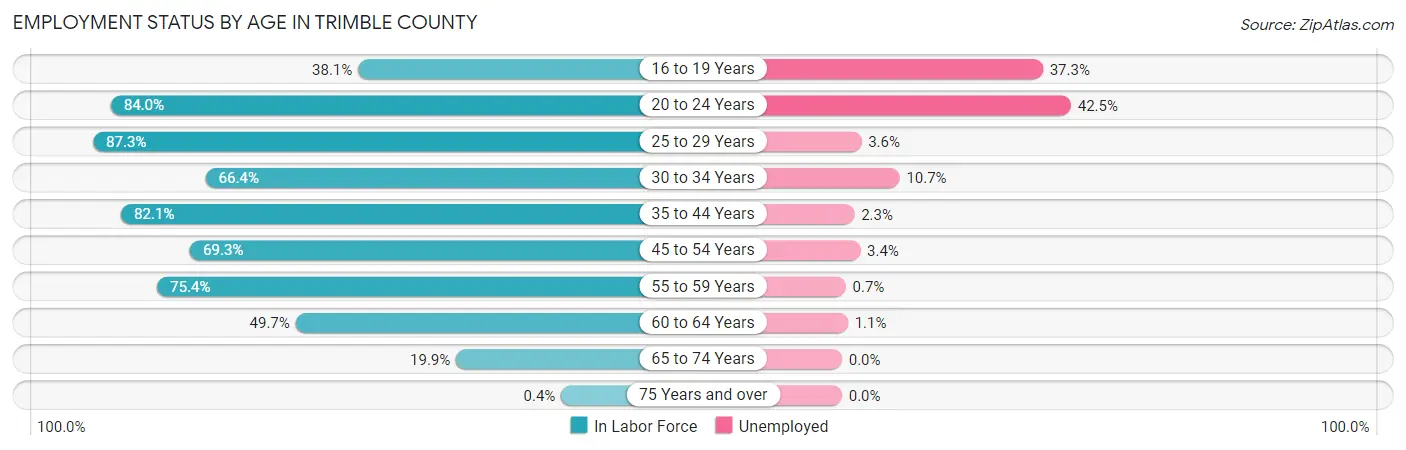
Employment Status by Age in Trimble County
According to the labor force statistics for Trimble County, out of the total population over 16 years of age (6,901), 57.4% or 3,961 individuals are in the labor force, with 8.4% or 333 of them unemployed. The age group with the highest labor force participation rate is 25 to 29 years, with 87.3% or 504 individuals in the labor force. Within the labor force, the 20 to 24 years age range has the highest percentage of unemployed individuals, with 42.5% or 159 of them being unemployed.
| Age Bracket | In Labor Force | Unemployed |
| 16 to 19 Years | 169 (38.1%) | 63 (37.3%) |
| 20 to 24 Years | 374 (84.0%) | 159 (42.5%) |
| 25 to 29 Years | 504 (87.3%) | 18 (3.6%) |
| 30 to 34 Years | 355 (66.4%) | 38 (10.7%) |
| 35 to 44 Years | 776 (82.1%) | 18 (2.3%) |
| 45 to 54 Years | 823 (69.3%) | 28 (3.4%) |
| 55 to 59 Years | 416 (75.4%) | 3 (0.7%) |
| 60 to 64 Years | 357 (49.7%) | 4 (1.1%) |
| 65 to 74 Years | 186 (19.9%) | 0 (0.0%) |
| 75 Years and over | 2 (0.4%) | 0 (0.0%) |
| Total | 3,961 (57.4%) | 333 (8.4%) |
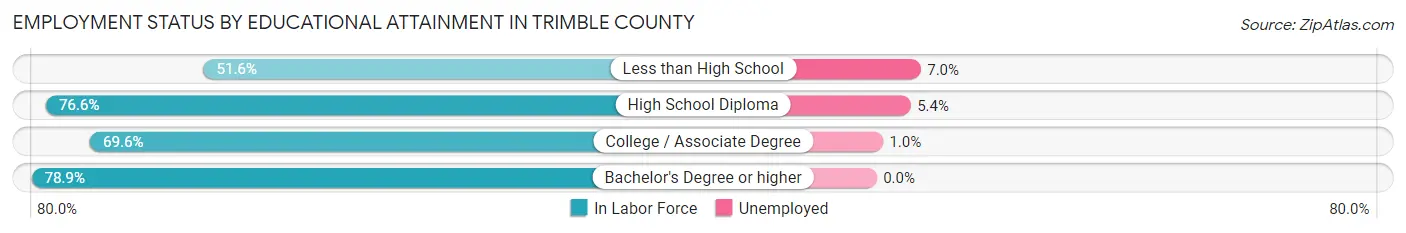
Employment Status by Educational Attainment in Trimble County
According to labor force statistics for Trimble County, 71.6% of individuals (3,233) out of the total population between 25 and 64 years of age (4,515) are in the labor force, with 3.4% or 110 of them being unemployed. The group with the highest labor force participation rate are those with the educational attainment of bachelor's degree or higher, with 78.9% or 512 individuals in the labor force. Within the labor force, individuals with less than high school education have the highest percentage of unemployment, with 7.0% or 21 of them being unemployed.
| Educational Attainment | In Labor Force | Unemployed |
| Less than High School | 298 (51.6%) | 40 (7.0%) |
| High School Diploma | 1,444 (76.6%) | 102 (5.4%) |
| College / Associate Degree | 976 (69.6%) | 14 (1.0%) |
| Bachelor's Degree or higher | 512 (78.9%) | 0 (0.0%) |
| Total | 3,233 (71.6%) | 154 (3.4%) |
Employment Occupations by Sex in Trimble County
Management, Business, Science and Arts Occupations
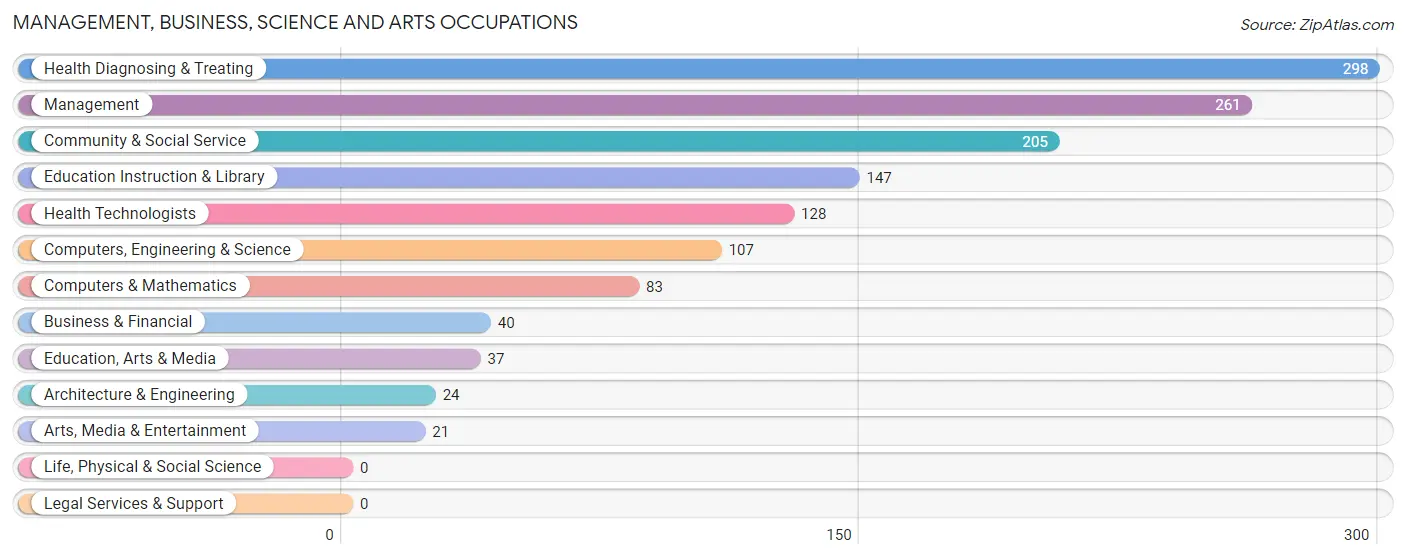
The most common Management, Business, Science and Arts occupations in Trimble County are Health Diagnosing & Treating (298 | 8.2%), Management (261 | 7.2%), Community & Social Service (205 | 5.7%), Education Instruction & Library (147 | 4.1%), and Health Technologists (128 | 3.5%).
Management, Business, Science and Arts Occupations by Sex
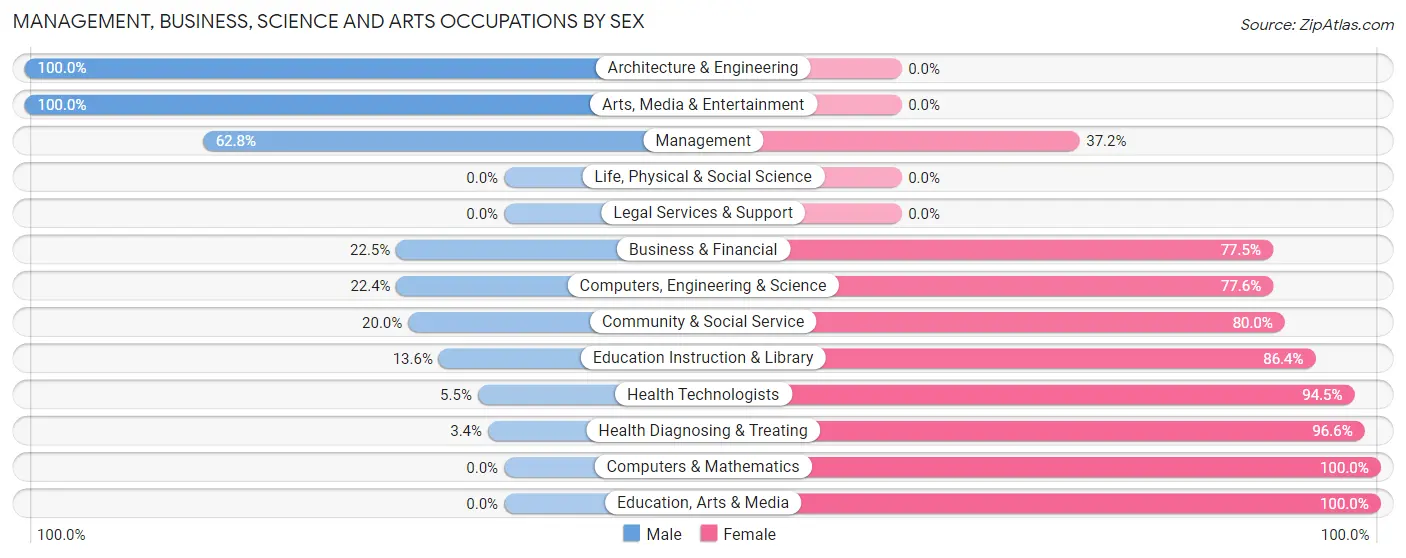
Within the Management, Business, Science and Arts occupations in Trimble County, the most male-oriented occupations are Architecture & Engineering (100.0%), Arts, Media & Entertainment (100.0%), and Management (62.8%), while the most female-oriented occupations are Computers & Mathematics (100.0%), Education, Arts & Media (100.0%), and Health Diagnosing & Treating (96.6%).
| Occupation | Male | Female |
| Management | 164 (62.8%) | 97 (37.2%) |
| Business & Financial | 9 (22.5%) | 31 (77.5%) |
| Computers, Engineering & Science | 24 (22.4%) | 83 (77.6%) |
| Computers & Mathematics | 0 (0.0%) | 83 (100.0%) |
| Architecture & Engineering | 24 (100.0%) | 0 (0.0%) |
| Life, Physical & Social Science | 0 (0.0%) | 0 (0.0%) |
| Community & Social Service | 41 (20.0%) | 164 (80.0%) |
| Education, Arts & Media | 0 (0.0%) | 37 (100.0%) |
| Legal Services & Support | 0 (0.0%) | 0 (0.0%) |
| Education Instruction & Library | 20 (13.6%) | 127 (86.4%) |
| Arts, Media & Entertainment | 21 (100.0%) | 0 (0.0%) |
| Health Diagnosing & Treating | 10 (3.4%) | 288 (96.6%) |
| Health Technologists | 7 (5.5%) | 121 (94.5%) |
| Total (Category) | 248 (27.2%) | 663 (72.8%) |
| Total (Overall) | 2,035 (56.0%) | 1,596 (44.0%) |
Services Occupations
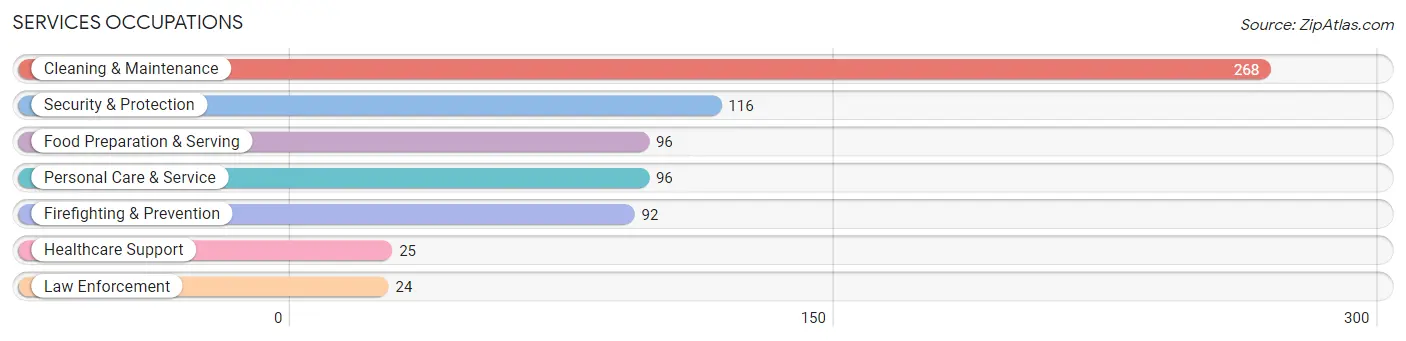
The most common Services occupations in Trimble County are Cleaning & Maintenance (268 | 7.4%), Security & Protection (116 | 3.2%), Food Preparation & Serving (96 | 2.6%), Personal Care & Service (96 | 2.6%), and Firefighting & Prevention (92 | 2.5%).
Services Occupations by Sex
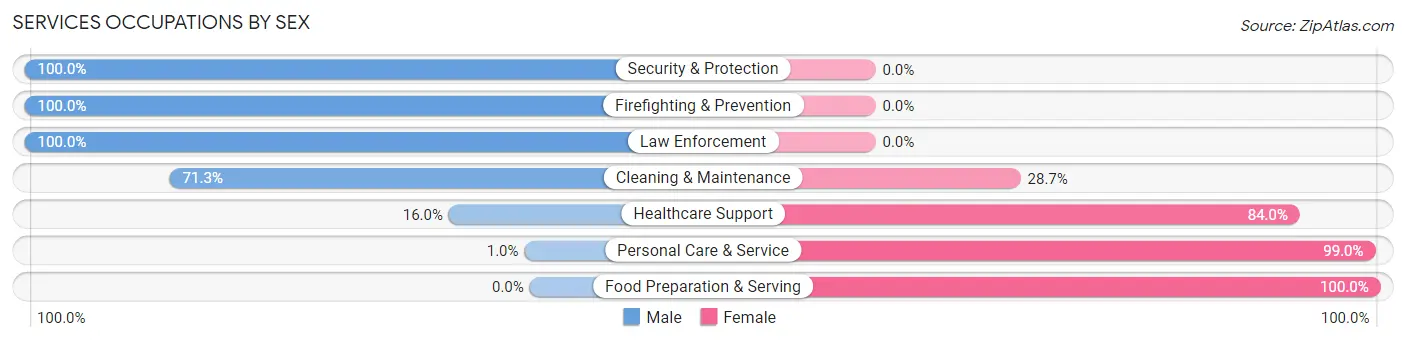
Within the Services occupations in Trimble County, the most male-oriented occupations are Security & Protection (100.0%), Firefighting & Prevention (100.0%), and Law Enforcement (100.0%), while the most female-oriented occupations are Food Preparation & Serving (100.0%), Personal Care & Service (99.0%), and Healthcare Support (84.0%).
| Occupation | Male | Female |
| Healthcare Support | 4 (16.0%) | 21 (84.0%) |
| Security & Protection | 116 (100.0%) | 0 (0.0%) |
| Firefighting & Prevention | 92 (100.0%) | 0 (0.0%) |
| Law Enforcement | 24 (100.0%) | 0 (0.0%) |
| Food Preparation & Serving | 0 (0.0%) | 96 (100.0%) |
| Cleaning & Maintenance | 191 (71.3%) | 77 (28.7%) |
| Personal Care & Service | 1 (1.0%) | 95 (99.0%) |
| Total (Category) | 312 (51.9%) | 289 (48.1%) |
| Total (Overall) | 2,035 (56.0%) | 1,596 (44.0%) |
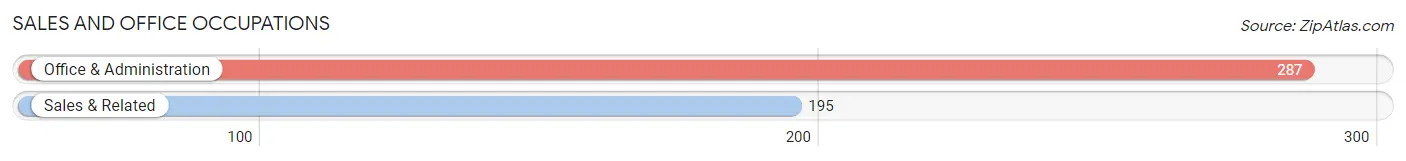
Sales and Office Occupations
The most common Sales and Office occupations in Trimble County are Office & Administration (287 | 7.9%), and Sales & Related (195 | 5.4%).
Sales and Office Occupations by Sex
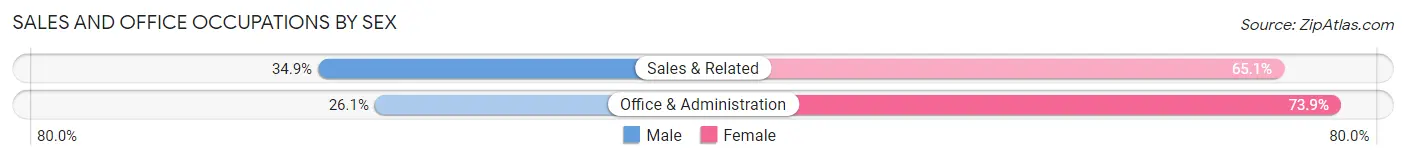
| Occupation | Male | Female |
| Sales & Related | 68 (34.9%) | 127 (65.1%) |
| Office & Administration | 75 (26.1%) | 212 (73.9%) |
| Total (Category) | 143 (29.7%) | 339 (70.3%) |
| Total (Overall) | 2,035 (56.0%) | 1,596 (44.0%) |
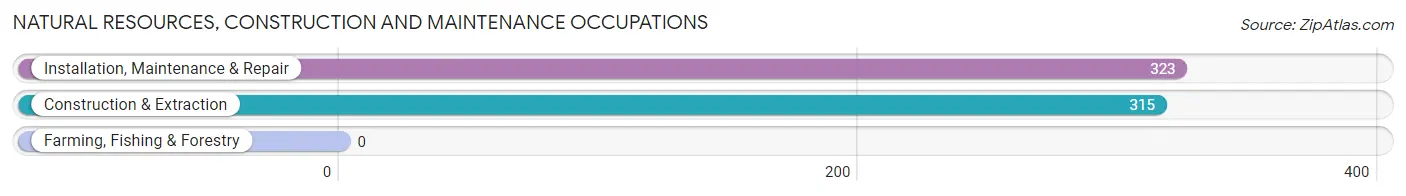
Natural Resources, Construction and Maintenance Occupations
The most common Natural Resources, Construction and Maintenance occupations in Trimble County are Installation, Maintenance & Repair (323 | 8.9%), and Construction & Extraction (315 | 8.7%).
Natural Resources, Construction and Maintenance Occupations by Sex
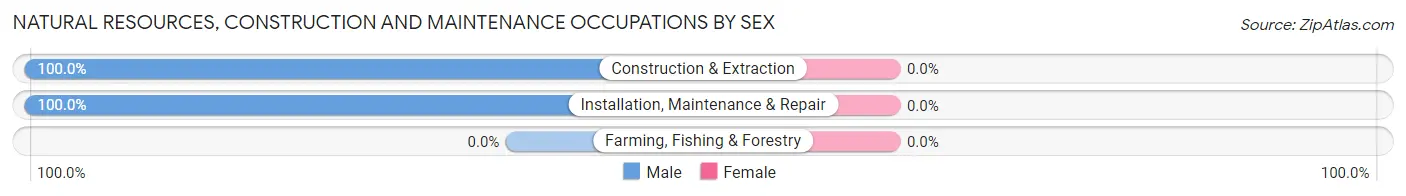
| Occupation | Male | Female |
| Farming, Fishing & Forestry | 0 (0.0%) | 0 (0.0%) |
| Construction & Extraction | 315 (100.0%) | 0 (0.0%) |
| Installation, Maintenance & Repair | 323 (100.0%) | 0 (0.0%) |
| Total (Category) | 638 (100.0%) | 0 (0.0%) |
| Total (Overall) | 2,035 (56.0%) | 1,596 (44.0%) |
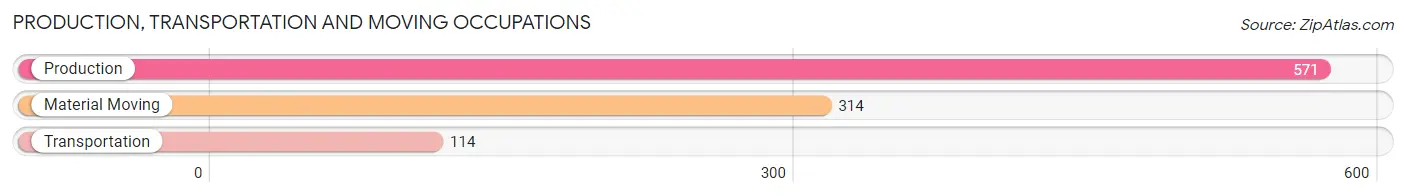
Production, Transportation and Moving Occupations
The most common Production, Transportation and Moving occupations in Trimble County are Production (571 | 15.7%), Material Moving (314 | 8.6%), and Transportation (114 | 3.1%).
Production, Transportation and Moving Occupations by Sex
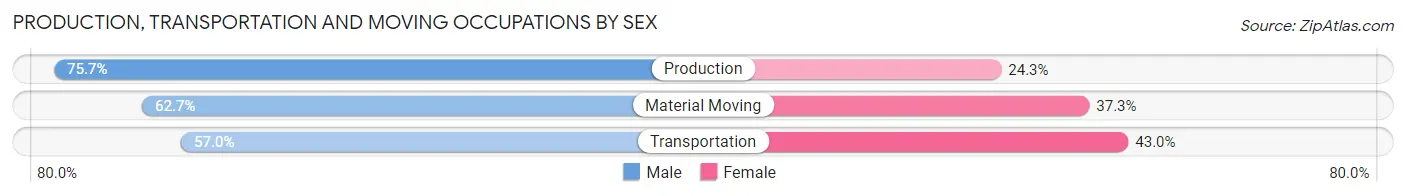
| Occupation | Male | Female |
| Production | 432 (75.7%) | 139 (24.3%) |
| Transportation | 65 (57.0%) | 49 (43.0%) |
| Material Moving | 197 (62.7%) | 117 (37.3%) |
| Total (Category) | 694 (69.5%) | 305 (30.5%) |
| Total (Overall) | 2,035 (56.0%) | 1,596 (44.0%) |
Employment Industries by Sex in Trimble County
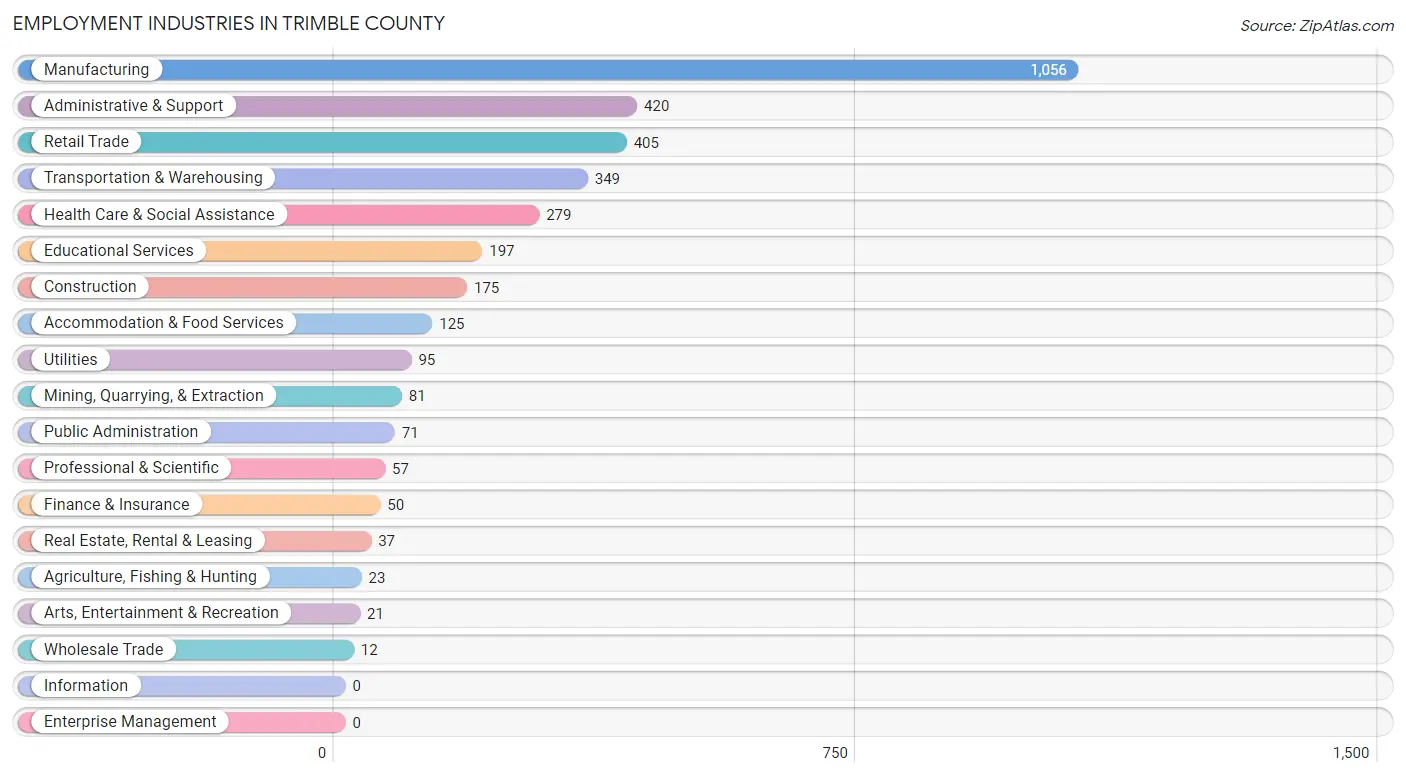
Employment Industries in Trimble County
The major employment industries in Trimble County include Manufacturing (1,056 | 29.1%), Administrative & Support (420 | 11.6%), Retail Trade (405 | 11.2%), Transportation & Warehousing (349 | 9.6%), and Health Care & Social Assistance (279 | 7.7%).
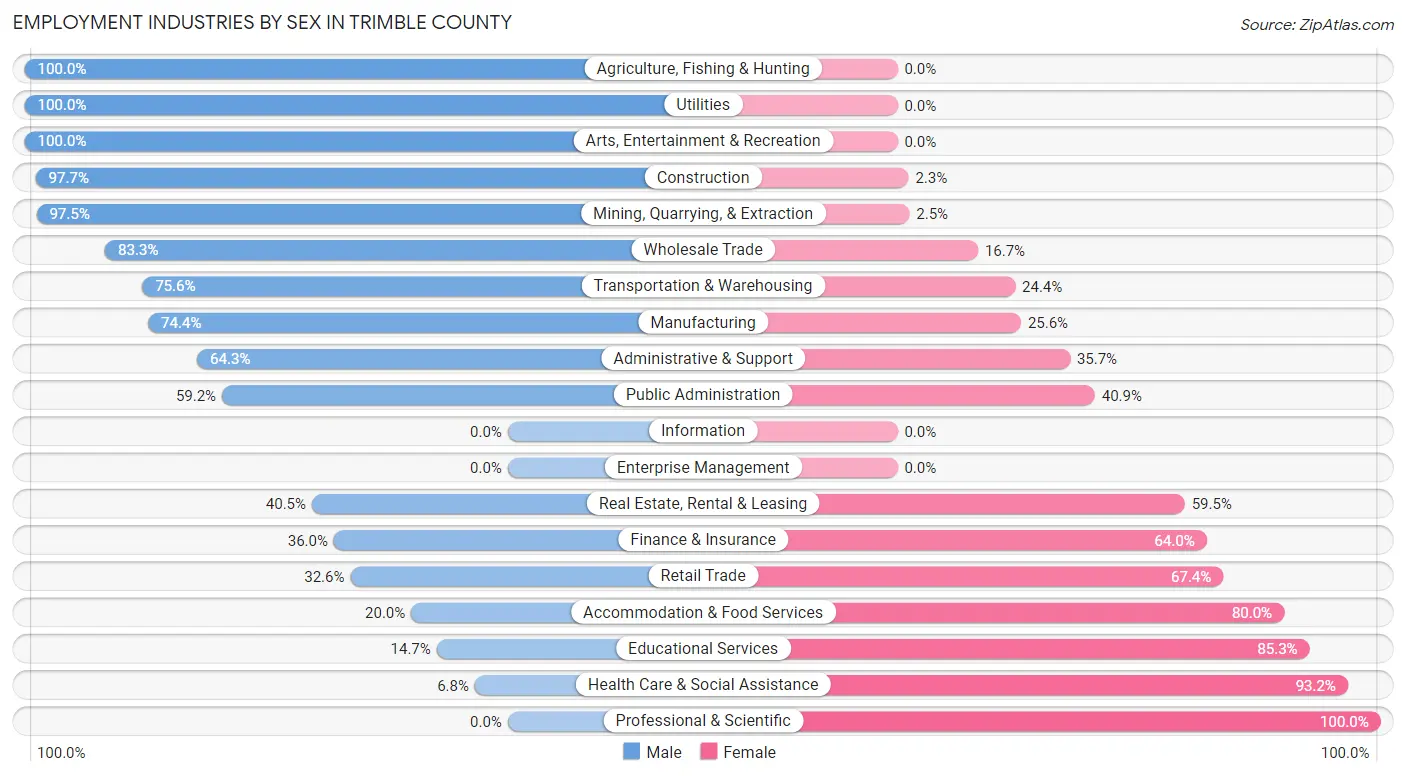
Employment Industries by Sex in Trimble County
The Trimble County industries that see more men than women are Agriculture, Fishing & Hunting (100.0%), Utilities (100.0%), and Arts, Entertainment & Recreation (100.0%), whereas the industries that tend to have a higher number of women are Professional & Scientific (100.0%), Health Care & Social Assistance (93.2%), and Educational Services (85.3%).
| Industry | Male | Female |
| Agriculture, Fishing & Hunting | 23 (100.0%) | 0 (0.0%) |
| Mining, Quarrying, & Extraction | 79 (97.5%) | 2 (2.5%) |
| Construction | 171 (97.7%) | 4 (2.3%) |
| Manufacturing | 786 (74.4%) | 270 (25.6%) |
| Wholesale Trade | 10 (83.3%) | 2 (16.7%) |
| Retail Trade | 132 (32.6%) | 273 (67.4%) |
| Transportation & Warehousing | 264 (75.6%) | 85 (24.4%) |
| Utilities | 95 (100.0%) | 0 (0.0%) |
| Information | 0 (0.0%) | 0 (0.0%) |
| Finance & Insurance | 18 (36.0%) | 32 (64.0%) |
| Real Estate, Rental & Leasing | 15 (40.5%) | 22 (59.5%) |
| Professional & Scientific | 0 (0.0%) | 57 (100.0%) |
| Enterprise Management | 0 (0.0%) | 0 (0.0%) |
| Administrative & Support | 270 (64.3%) | 150 (35.7%) |
| Educational Services | 29 (14.7%) | 168 (85.3%) |
| Health Care & Social Assistance | 19 (6.8%) | 260 (93.2%) |
| Arts, Entertainment & Recreation | 21 (100.0%) | 0 (0.0%) |
| Accommodation & Food Services | 25 (20.0%) | 100 (80.0%) |
| Public Administration | 42 (59.2%) | 29 (40.8%) |
| Total | 2,035 (56.0%) | 1,596 (44.0%) |
Education in Trimble County
School Enrollment in Trimble County
The most common levels of schooling among the 1,657 students in Trimble County are middle school (527 | 31.8%), elementary school (505 | 30.5%), and high school (302 | 18.2%).
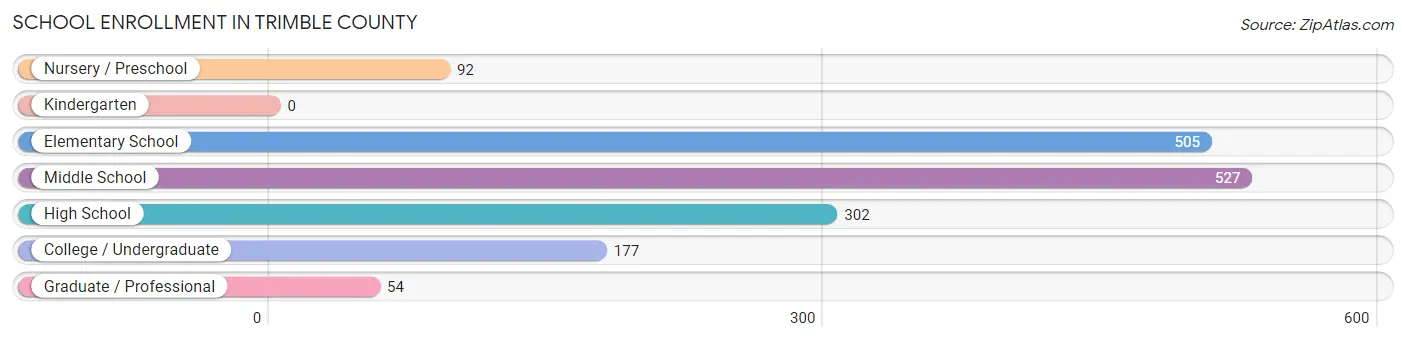
| School Level | # Students | % Students |
| Nursery / Preschool | 92 | 5.6% |
| Kindergarten | 0 | 0.0% |
| Elementary School | 505 | 30.5% |
| Middle School | 527 | 31.8% |
| High School | 302 | 18.2% |
| College / Undergraduate | 177 | 10.7% |
| Graduate / Professional | 54 | 3.3% |
| Total | 1,657 | 100.0% |
School Enrollment by Age by Funding Source in Trimble County
Out of a total of 1,657 students who are enrolled in schools in Trimble County, 355 (21.4%) attend a private institution, while the remaining 1,302 (78.6%) are enrolled in public schools. The age group of 35 years and over has the highest likelihood of being enrolled in private schools, with 45 (45.0% in the age bracket) enrolled. Conversely, the age group of 3 to 4 year olds has the lowest likelihood of being enrolled in a private school, with 92 (100.0% in the age bracket) attending a public institution.
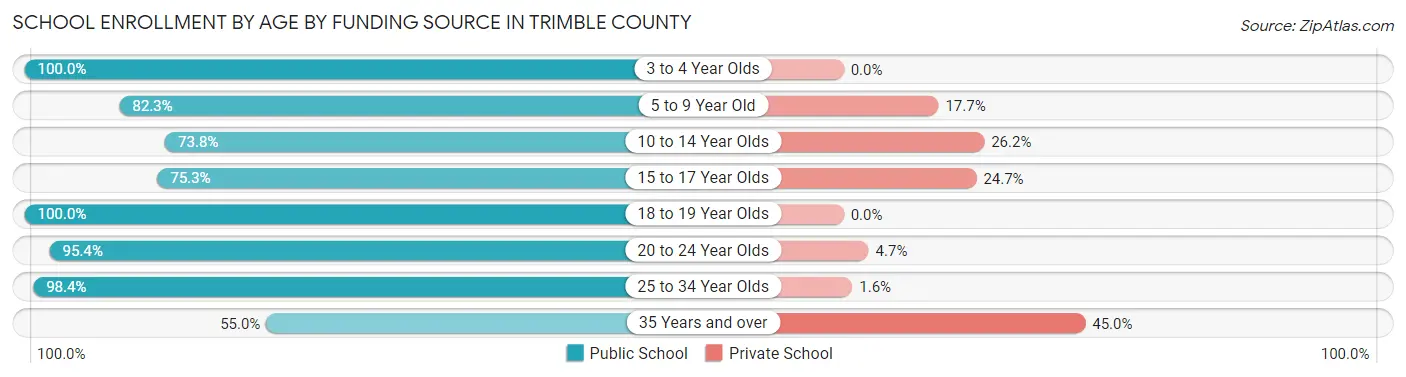
| Age Bracket | Public School | Private School |
| 3 to 4 Year Olds | 92 (100.0%) | 0 (0.0%) |
| 5 to 9 Year Old | 331 (82.3%) | 71 (17.7%) |
| 10 to 14 Year Olds | 471 (73.8%) | 167 (26.2%) |
| 15 to 17 Year Olds | 210 (75.3%) | 69 (24.7%) |
| 18 to 19 Year Olds | 41 (100.0%) | 0 (0.0%) |
| 20 to 24 Year Olds | 41 (95.4%) | 2 (4.6%) |
| 25 to 34 Year Olds | 61 (98.4%) | 1 (1.6%) |
| 35 Years and over | 55 (55.0%) | 45 (45.0%) |
| Total | 1,302 (78.6%) | 355 (21.4%) |
Educational Attainment by Field of Study in Trimble County
Business (254 | 29.0%), education (201 | 23.0%), bio, nature & agricultural (134 | 15.3%), science & technology (74 | 8.5%), and psychology (38 | 4.3%) are the most common fields of study among 876 individuals in Trimble County who have obtained a bachelor's degree or higher.
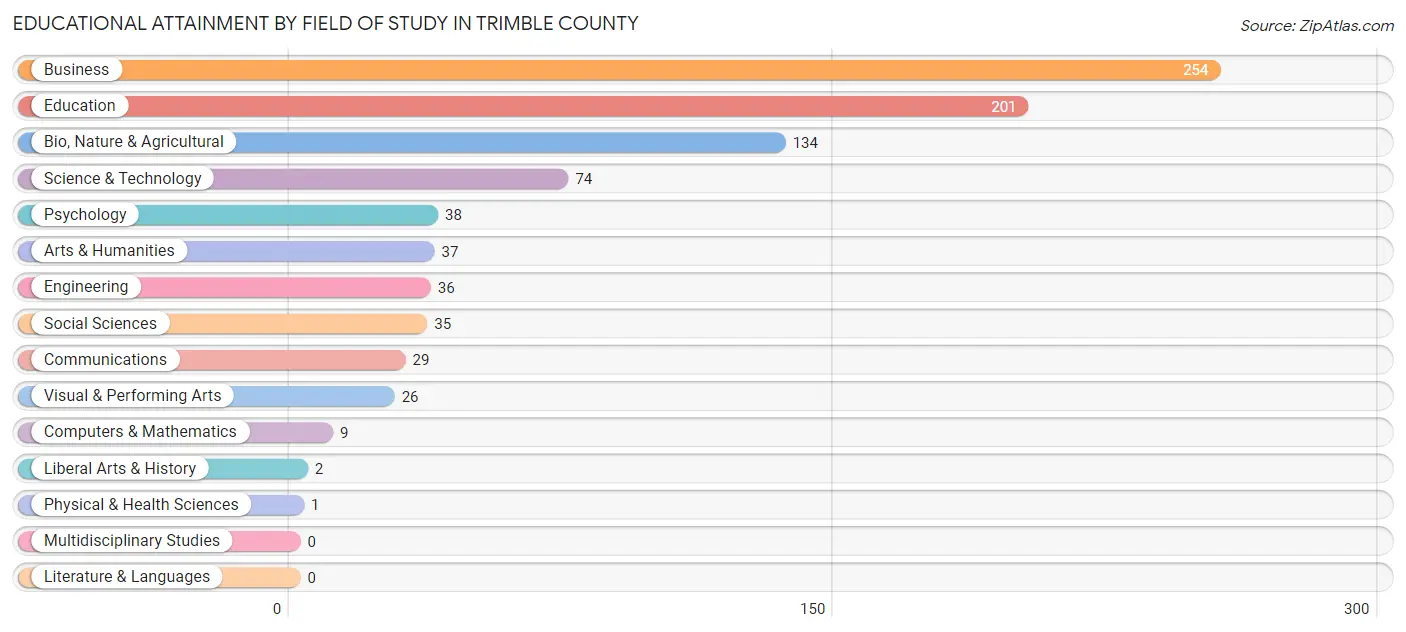
| Field of Study | # Graduates | % Graduates |
| Computers & Mathematics | 9 | 1.0% |
| Bio, Nature & Agricultural | 134 | 15.3% |
| Physical & Health Sciences | 1 | 0.1% |
| Psychology | 38 | 4.3% |
| Social Sciences | 35 | 4.0% |
| Engineering | 36 | 4.1% |
| Multidisciplinary Studies | 0 | 0.0% |
| Science & Technology | 74 | 8.5% |
| Business | 254 | 29.0% |
| Education | 201 | 23.0% |
| Literature & Languages | 0 | 0.0% |
| Liberal Arts & History | 2 | 0.2% |
| Visual & Performing Arts | 26 | 3.0% |
| Communications | 29 | 3.3% |
| Arts & Humanities | 37 | 4.2% |
| Total | 876 | 100.0% |
Transportation & Commute in Trimble County
Vehicle Availability by Sex in Trimble County
The most prevalent vehicle ownership categories in Trimble County are males with 2 vehicles (807, accounting for 42.0%) and females with 2 vehicles (803, making up 50.6%).
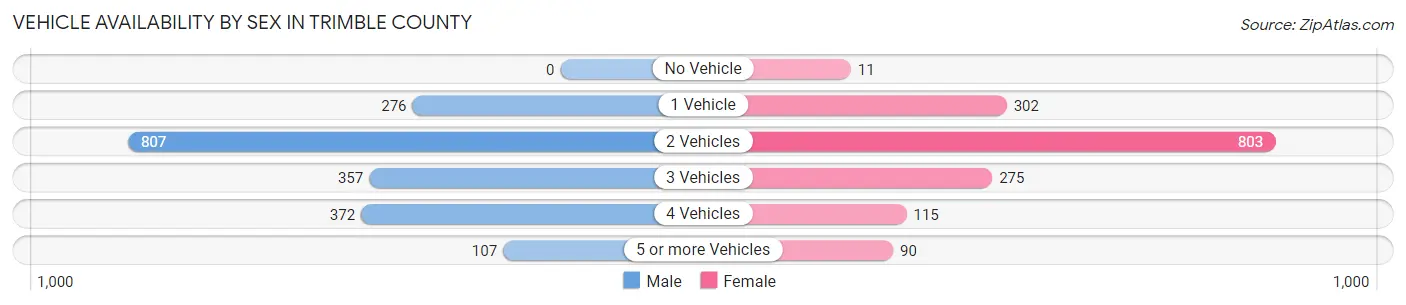
| Vehicles Available | Male | Female |
| No Vehicle | 0 (0.0%) | 11 (0.7%) |
| 1 Vehicle | 276 (14.4%) | 302 (18.9%) |
| 2 Vehicles | 807 (42.0%) | 803 (50.3%) |
| 3 Vehicles | 357 (18.6%) | 275 (17.2%) |
| 4 Vehicles | 372 (19.4%) | 115 (7.2%) |
| 5 or more Vehicles | 107 (5.6%) | 90 (5.6%) |
| Total | 1,919 (100.0%) | 1,596 (100.0%) |
Commute Time in Trimble County
The most frequently occuring commute durations in Trimble County are 30 to 34 minutes (580 commuters, 17.2%), 45 to 59 minutes (477 commuters, 14.1%), and 20 to 24 minutes (425 commuters, 12.6%).
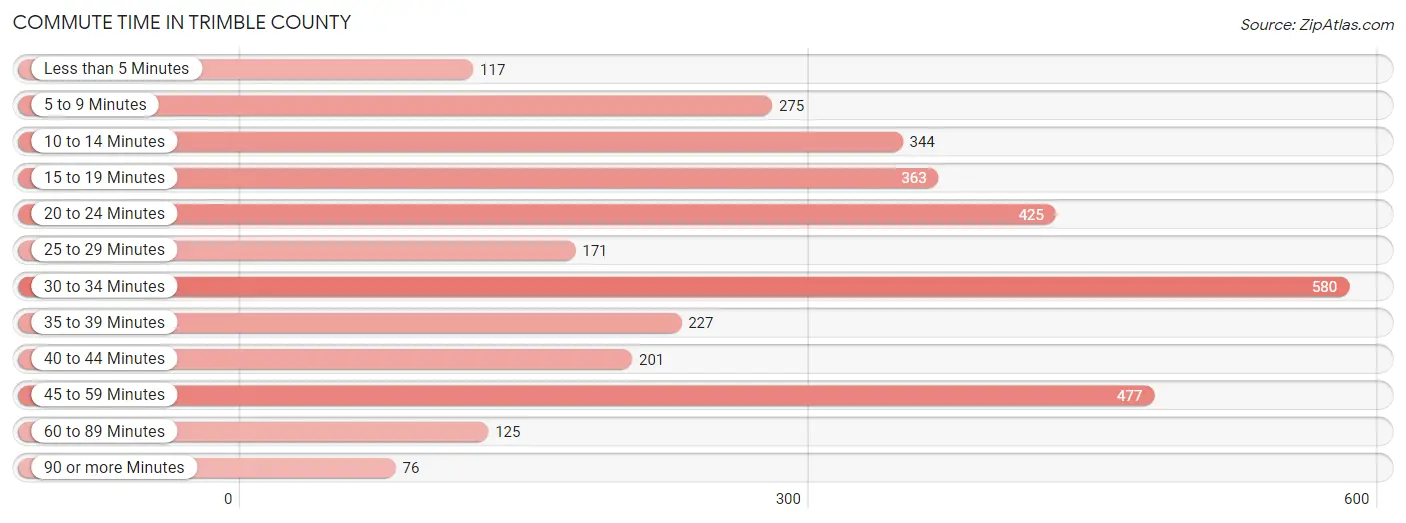
| Commute Time | # Commuters | % Commuters |
| Less than 5 Minutes | 117 | 3.5% |
| 5 to 9 Minutes | 275 | 8.1% |
| 10 to 14 Minutes | 344 | 10.2% |
| 15 to 19 Minutes | 363 | 10.7% |
| 20 to 24 Minutes | 425 | 12.6% |
| 25 to 29 Minutes | 171 | 5.1% |
| 30 to 34 Minutes | 580 | 17.2% |
| 35 to 39 Minutes | 227 | 6.7% |
| 40 to 44 Minutes | 201 | 5.9% |
| 45 to 59 Minutes | 477 | 14.1% |
| 60 to 89 Minutes | 125 | 3.7% |
| 90 or more Minutes | 76 | 2.2% |
Commute Time by Sex in Trimble County
The most common commute times in Trimble County are 30 to 34 minutes (333 commuters, 17.4%) for males and 30 to 34 minutes (247 commuters, 16.8%) for females.
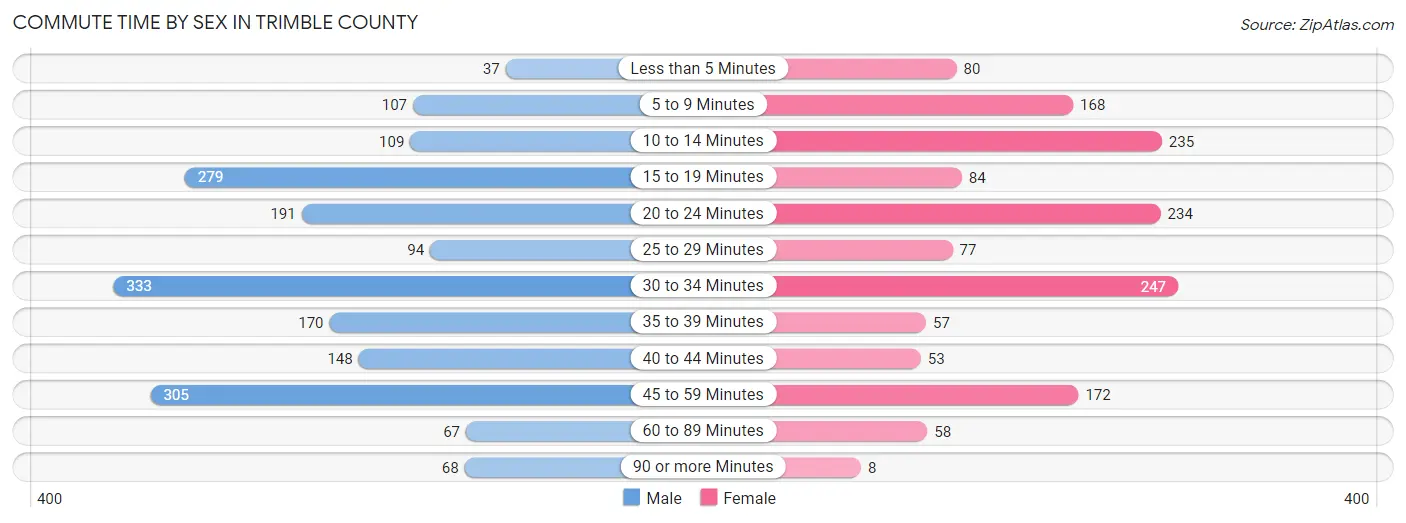
| Commute Time | Male | Female |
| Less than 5 Minutes | 37 (1.9%) | 80 (5.4%) |
| 5 to 9 Minutes | 107 (5.6%) | 168 (11.4%) |
| 10 to 14 Minutes | 109 (5.7%) | 235 (16.0%) |
| 15 to 19 Minutes | 279 (14.6%) | 84 (5.7%) |
| 20 to 24 Minutes | 191 (10.0%) | 234 (15.9%) |
| 25 to 29 Minutes | 94 (4.9%) | 77 (5.2%) |
| 30 to 34 Minutes | 333 (17.4%) | 247 (16.8%) |
| 35 to 39 Minutes | 170 (8.9%) | 57 (3.9%) |
| 40 to 44 Minutes | 148 (7.8%) | 53 (3.6%) |
| 45 to 59 Minutes | 305 (16.0%) | 172 (11.7%) |
| 60 to 89 Minutes | 67 (3.5%) | 58 (3.9%) |
| 90 or more Minutes | 68 (3.6%) | 8 (0.5%) |
Time of Departure to Work by Sex in Trimble County
The most frequent times of departure to work in Trimble County are 6:00 AM to 6:29 AM (411, 21.5%) for males and 7:30 AM to 7:59 AM (194, 13.2%) for females.
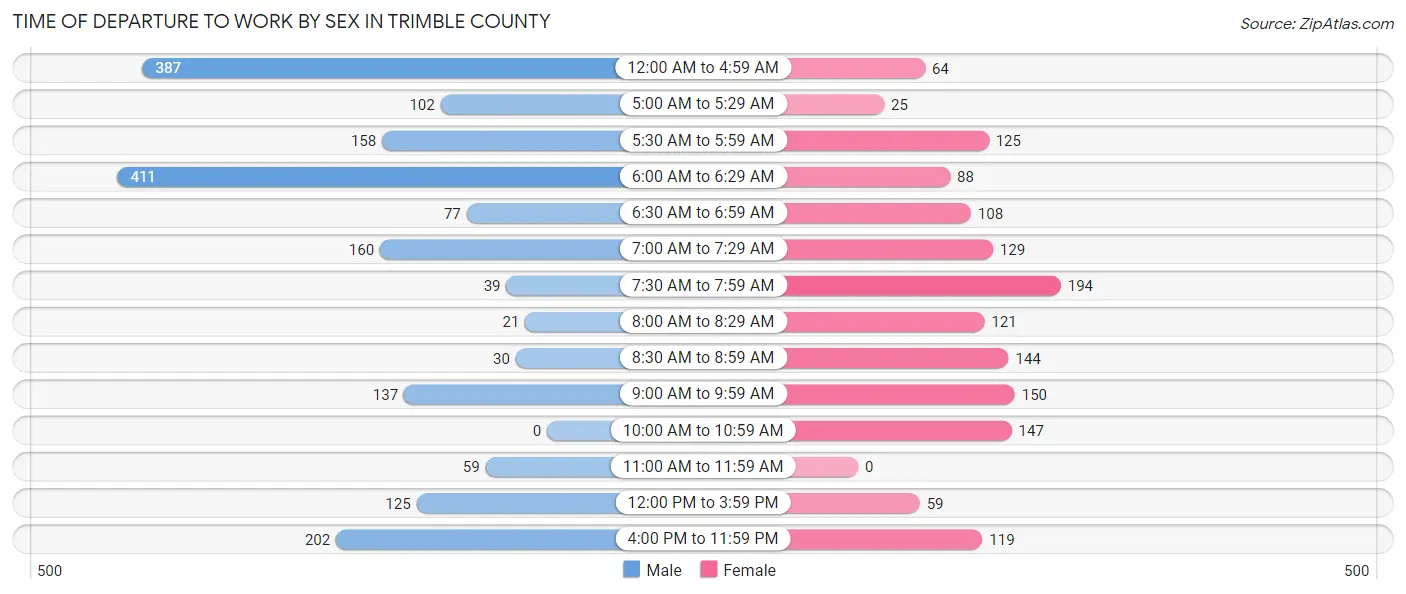
| Time of Departure | Male | Female |
| 12:00 AM to 4:59 AM | 387 (20.3%) | 64 (4.3%) |
| 5:00 AM to 5:29 AM | 102 (5.3%) | 25 (1.7%) |
| 5:30 AM to 5:59 AM | 158 (8.3%) | 125 (8.5%) |
| 6:00 AM to 6:29 AM | 411 (21.5%) | 88 (6.0%) |
| 6:30 AM to 6:59 AM | 77 (4.0%) | 108 (7.3%) |
| 7:00 AM to 7:29 AM | 160 (8.4%) | 129 (8.8%) |
| 7:30 AM to 7:59 AM | 39 (2.0%) | 194 (13.2%) |
| 8:00 AM to 8:29 AM | 21 (1.1%) | 121 (8.2%) |
| 8:30 AM to 8:59 AM | 30 (1.6%) | 144 (9.8%) |
| 9:00 AM to 9:59 AM | 137 (7.2%) | 150 (10.2%) |
| 10:00 AM to 10:59 AM | 0 (0.0%) | 147 (10.0%) |
| 11:00 AM to 11:59 AM | 59 (3.1%) | 0 (0.0%) |
| 12:00 PM to 3:59 PM | 125 (6.6%) | 59 (4.0%) |
| 4:00 PM to 11:59 PM | 202 (10.6%) | 119 (8.1%) |
| Total | 1,908 (100.0%) | 1,473 (100.0%) |
Housing Occupancy in Trimble County
Occupancy by Ownership in Trimble County
Of the total 3,273 dwellings in Trimble County, owner-occupied units account for 2,660 (81.3%), while renter-occupied units make up 613 (18.7%).
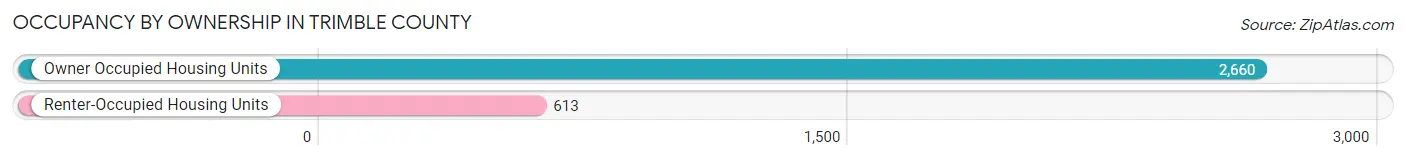
| Occupancy | # Housing Units | % Housing Units |
| Owner Occupied Housing Units | 2,660 | 81.3% |
| Renter-Occupied Housing Units | 613 | 18.7% |
| Total Occupied Housing Units | 3,273 | 100.0% |
Occupancy by Household Size in Trimble County
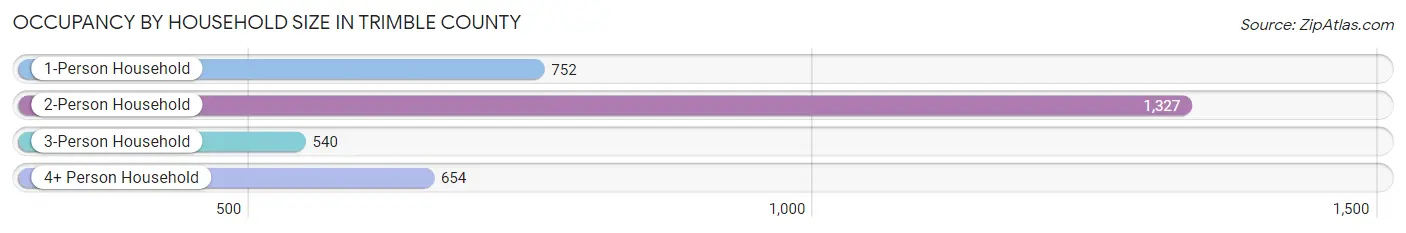
| Household Size | # Housing Units | % Housing Units |
| 1-Person Household | 752 | 23.0% |
| 2-Person Household | 1,327 | 40.5% |
| 3-Person Household | 540 | 16.5% |
| 4+ Person Household | 654 | 20.0% |
| Total Housing Units | 3,273 | 100.0% |
Occupancy by Ownership by Household Size in Trimble County
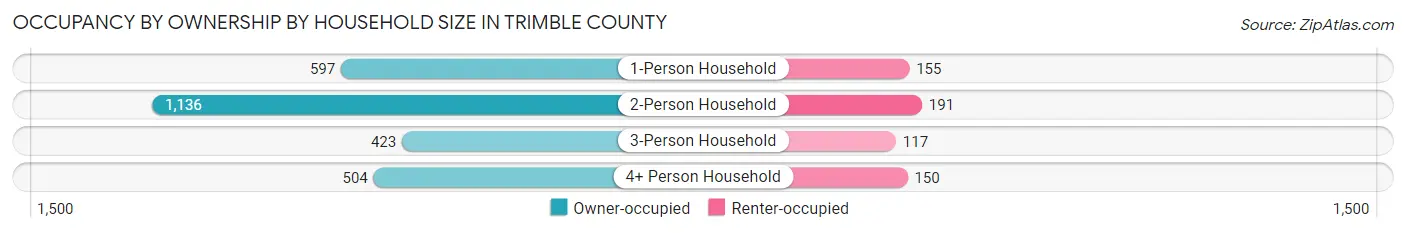
| Household Size | Owner-occupied | Renter-occupied |
| 1-Person Household | 597 (79.4%) | 155 (20.6%) |
| 2-Person Household | 1,136 (85.6%) | 191 (14.4%) |
| 3-Person Household | 423 (78.3%) | 117 (21.7%) |
| 4+ Person Household | 504 (77.1%) | 150 (22.9%) |
| Total Housing Units | 2,660 (81.3%) | 613 (18.7%) |
Occupancy by Educational Attainment in Trimble County
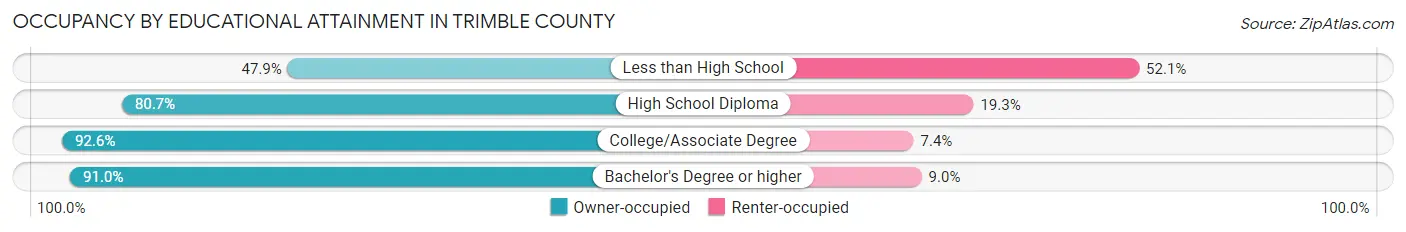
| Household Size | Owner-occupied | Renter-occupied |
| Less than High School | 201 (47.9%) | 219 (52.1%) |
| High School Diploma | 1,184 (80.7%) | 283 (19.3%) |
| College/Associate Degree | 811 (92.6%) | 65 (7.4%) |
| Bachelor's Degree or higher | 464 (91.0%) | 46 (9.0%) |
Occupancy by Age of Householder in Trimble County
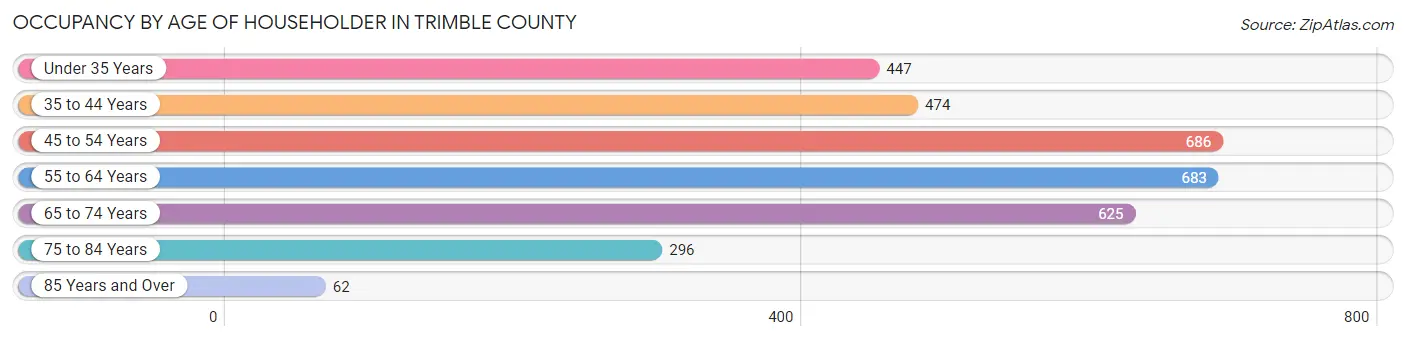
| Age Bracket | # Households | % Households |
| Under 35 Years | 447 | 13.7% |
| 35 to 44 Years | 474 | 14.5% |
| 45 to 54 Years | 686 | 21.0% |
| 55 to 64 Years | 683 | 20.9% |
| 65 to 74 Years | 625 | 19.1% |
| 75 to 84 Years | 296 | 9.0% |
| 85 Years and Over | 62 | 1.9% |
| Total | 3,273 | 100.0% |
Housing Finances in Trimble County
Median Income by Occupancy in Trimble County
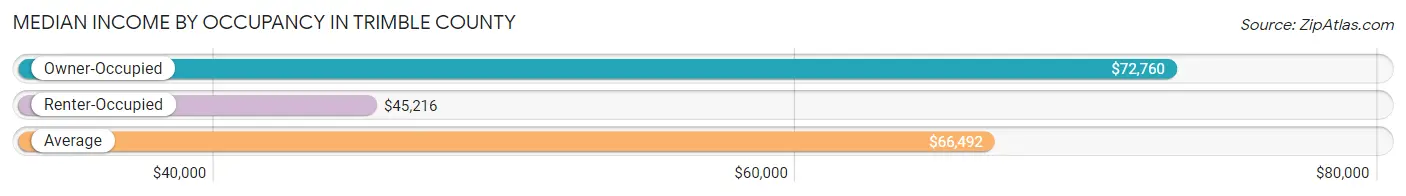
| Occupancy Type | # Households | Median Income |
| Owner-Occupied | 2,660 (81.3%) | $72,760 |
| Renter-Occupied | 613 (18.7%) | $45,216 |
| Average | 3,273 (100.0%) | $66,492 |
Occupancy by Householder Income Bracket in Trimble County
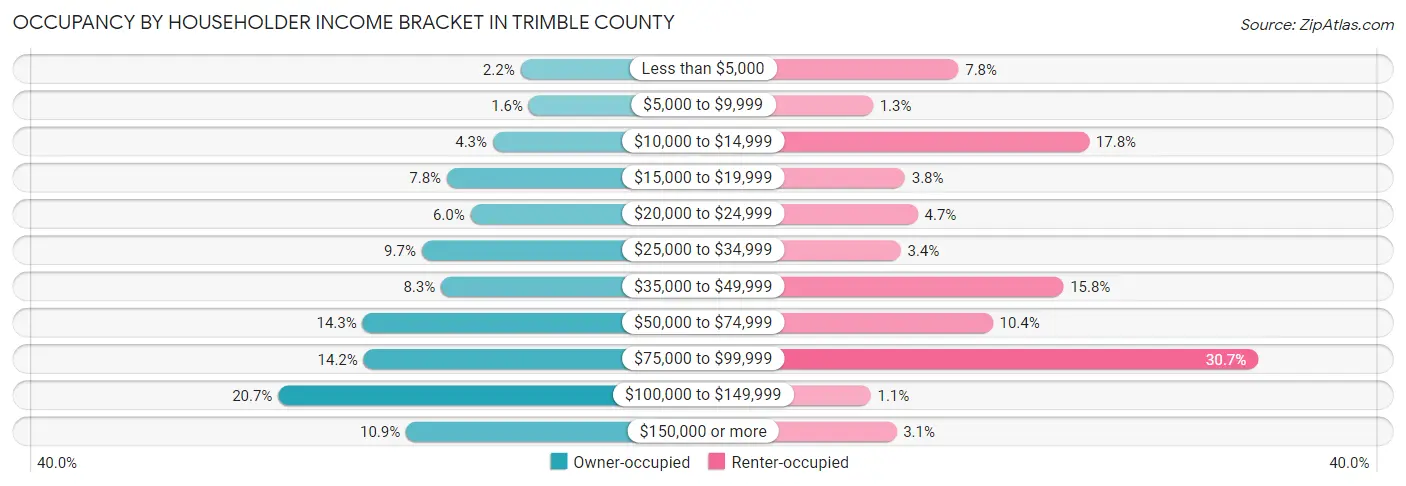
| Income Bracket | Owner-occupied | Renter-occupied |
| Less than $5,000 | 59 (2.2%) | 48 (7.8%) |
| $5,000 to $9,999 | 42 (1.6%) | 8 (1.3%) |
| $10,000 to $14,999 | 115 (4.3%) | 109 (17.8%) |
| $15,000 to $19,999 | 208 (7.8%) | 23 (3.7%) |
| $20,000 to $24,999 | 160 (6.0%) | 29 (4.7%) |
| $25,000 to $34,999 | 259 (9.7%) | 21 (3.4%) |
| $35,000 to $49,999 | 220 (8.3%) | 97 (15.8%) |
| $50,000 to $74,999 | 379 (14.2%) | 64 (10.4%) |
| $75,000 to $99,999 | 377 (14.2%) | 188 (30.7%) |
| $100,000 to $149,999 | 550 (20.7%) | 7 (1.1%) |
| $150,000 or more | 291 (10.9%) | 19 (3.1%) |
| Total | 2,660 (100.0%) | 613 (100.0%) |
Monthly Housing Cost Tiers in Trimble County
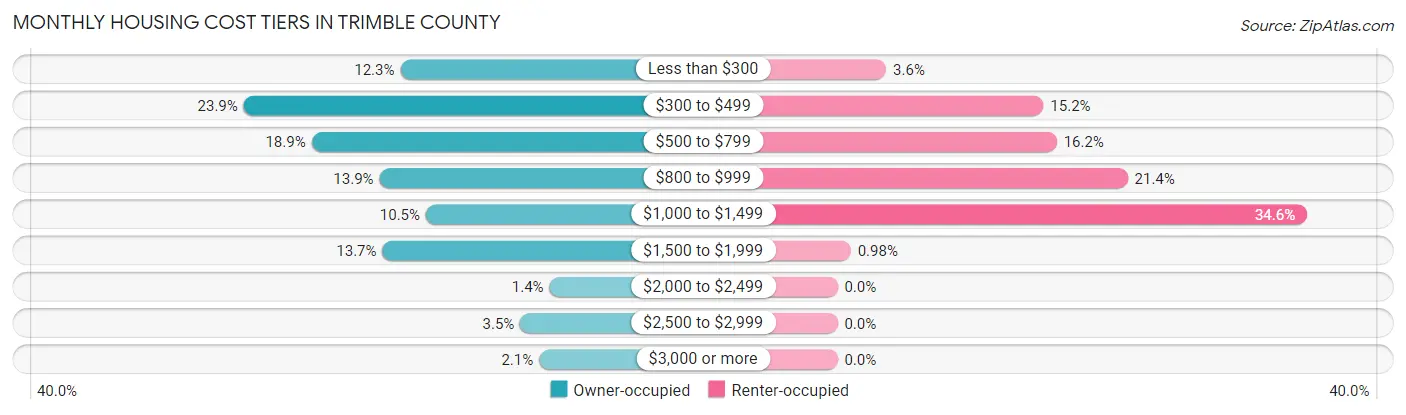
| Monthly Cost | Owner-occupied | Renter-occupied |
| Less than $300 | 328 (12.3%) | 22 (3.6%) |
| $300 to $499 | 635 (23.9%) | 93 (15.2%) |
| $500 to $799 | 502 (18.9%) | 99 (16.2%) |
| $800 to $999 | 369 (13.9%) | 131 (21.4%) |
| $1,000 to $1,499 | 278 (10.4%) | 212 (34.6%) |
| $1,500 to $1,999 | 363 (13.7%) | 6 (1.0%) |
| $2,000 to $2,499 | 36 (1.3%) | 0 (0.0%) |
| $2,500 to $2,999 | 93 (3.5%) | 0 (0.0%) |
| $3,000 or more | 56 (2.1%) | 0 (0.0%) |
| Total | 2,660 (100.0%) | 613 (100.0%) |
Physical Housing Characteristics in Trimble County
Housing Structures in Trimble County
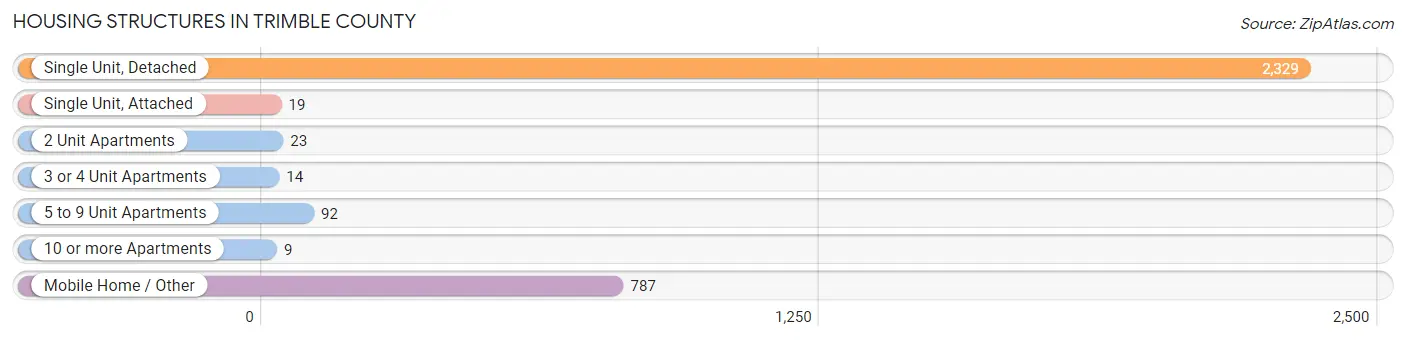
| Structure Type | # Housing Units | % Housing Units |
| Single Unit, Detached | 2,329 | 71.2% |
| Single Unit, Attached | 19 | 0.6% |
| 2 Unit Apartments | 23 | 0.7% |
| 3 or 4 Unit Apartments | 14 | 0.4% |
| 5 to 9 Unit Apartments | 92 | 2.8% |
| 10 or more Apartments | 9 | 0.3% |
| Mobile Home / Other | 787 | 24.0% |
| Total | 3,273 | 100.0% |
Housing Structures by Occupancy in Trimble County
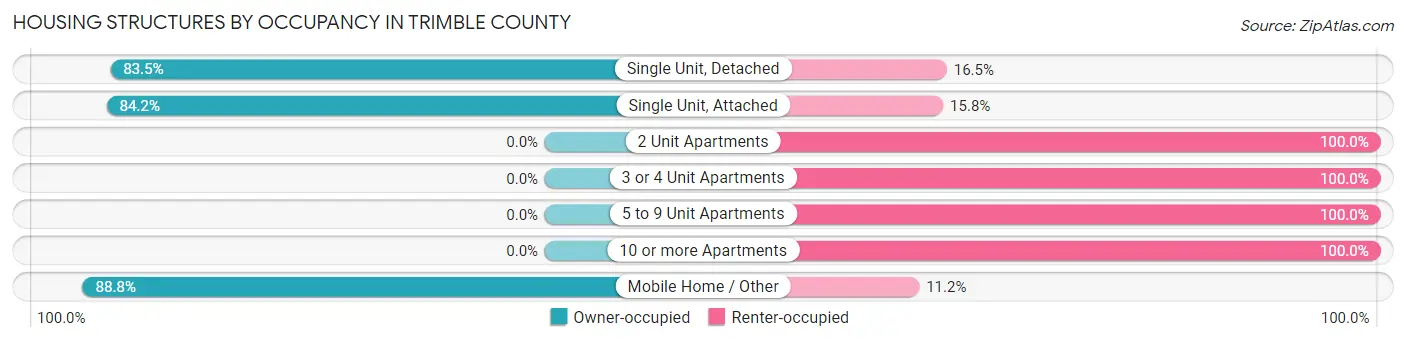
| Structure Type | Owner-occupied | Renter-occupied |
| Single Unit, Detached | 1,945 (83.5%) | 384 (16.5%) |
| Single Unit, Attached | 16 (84.2%) | 3 (15.8%) |
| 2 Unit Apartments | 0 (0.0%) | 23 (100.0%) |
| 3 or 4 Unit Apartments | 0 (0.0%) | 14 (100.0%) |
| 5 to 9 Unit Apartments | 0 (0.0%) | 92 (100.0%) |
| 10 or more Apartments | 0 (0.0%) | 9 (100.0%) |
| Mobile Home / Other | 699 (88.8%) | 88 (11.2%) |
| Total | 2,660 (81.3%) | 613 (18.7%) |
Housing Structures by Number of Rooms in Trimble County
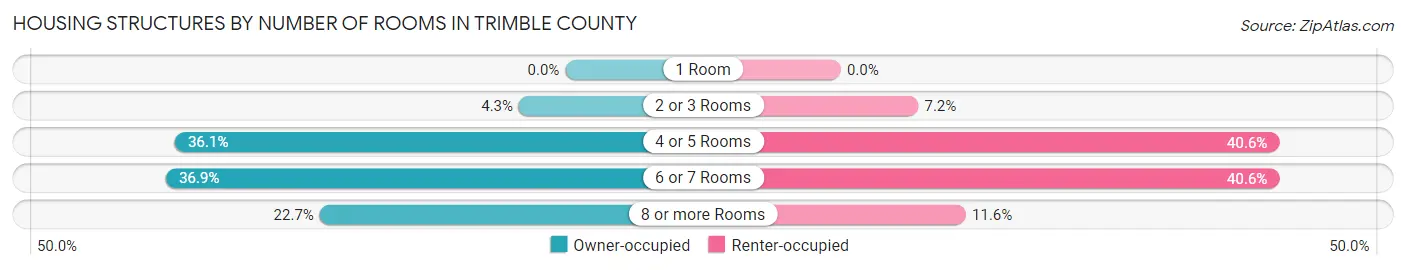
| Number of Rooms | Owner-occupied | Renter-occupied |
| 1 Room | 0 (0.0%) | 0 (0.0%) |
| 2 or 3 Rooms | 114 (4.3%) | 44 (7.2%) |
| 4 or 5 Rooms | 960 (36.1%) | 249 (40.6%) |
| 6 or 7 Rooms | 982 (36.9%) | 249 (40.6%) |
| 8 or more Rooms | 604 (22.7%) | 71 (11.6%) |
| Total | 2,660 (100.0%) | 613 (100.0%) |
Housing Structure by Heating Type in Trimble County
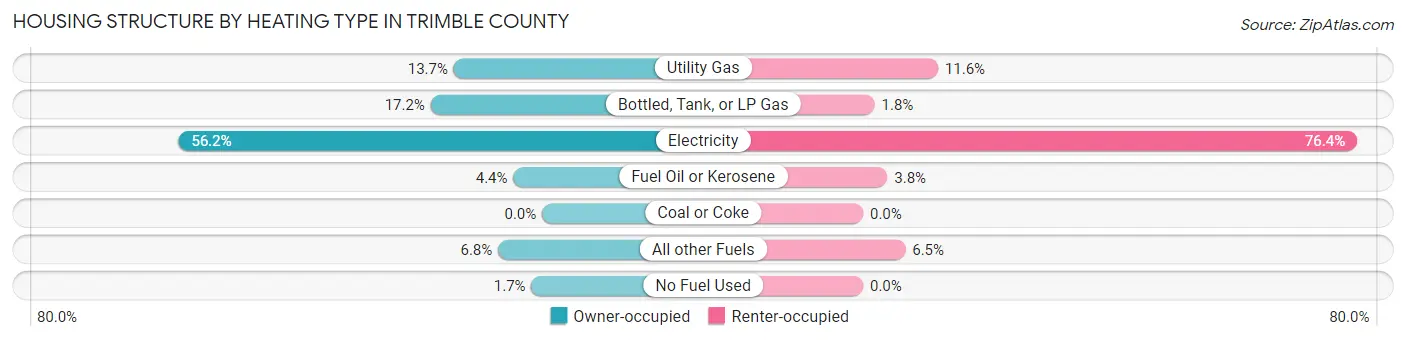
| Heating Type | Owner-occupied | Renter-occupied |
| Utility Gas | 363 (13.7%) | 71 (11.6%) |
| Bottled, Tank, or LP Gas | 458 (17.2%) | 11 (1.8%) |
| Electricity | 1,496 (56.2%) | 468 (76.3%) |
| Fuel Oil or Kerosene | 118 (4.4%) | 23 (3.7%) |
| Coal or Coke | 0 (0.0%) | 0 (0.0%) |
| All other Fuels | 181 (6.8%) | 40 (6.5%) |
| No Fuel Used | 44 (1.7%) | 0 (0.0%) |
| Total | 2,660 (100.0%) | 613 (100.0%) |
Household Vehicle Usage in Trimble County
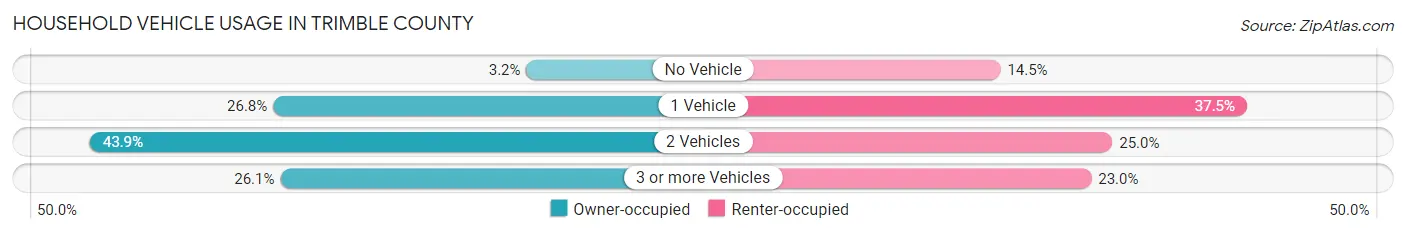
| Vehicles per Household | Owner-occupied | Renter-occupied |
| No Vehicle | 84 (3.2%) | 89 (14.5%) |
| 1 Vehicle | 713 (26.8%) | 230 (37.5%) |
| 2 Vehicles | 1,168 (43.9%) | 153 (25.0%) |
| 3 or more Vehicles | 695 (26.1%) | 141 (23.0%) |
| Total | 2,660 (100.0%) | 613 (100.0%) |
Real Estate & Mortgages in Trimble County
Real Estate and Mortgage Overview in Trimble County
| Characteristic | Without Mortgage | With Mortgage |
| Housing Units | 1,448 | 1,212 |
| Median Property Value | $122,000 | $185,300 |
| Median Household Income | $41,635 | $206 |
| Monthly Housing Costs | $435 | $53 |
| Real Estate Taxes | $791 | $48 |
Property Value by Mortgage Status in Trimble County
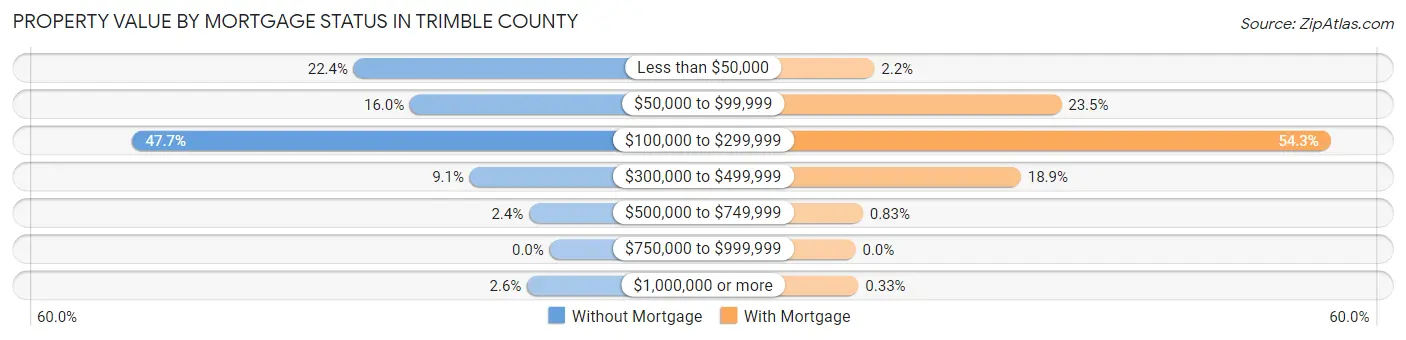
| Property Value | Without Mortgage | With Mortgage |
| Less than $50,000 | 324 (22.4%) | 26 (2.1%) |
| $50,000 to $99,999 | 231 (16.0%) | 285 (23.5%) |
| $100,000 to $299,999 | 690 (47.6%) | 658 (54.3%) |
| $300,000 to $499,999 | 132 (9.1%) | 229 (18.9%) |
| $500,000 to $749,999 | 34 (2.4%) | 10 (0.8%) |
| $750,000 to $999,999 | 0 (0.0%) | 0 (0.0%) |
| $1,000,000 or more | 37 (2.6%) | 4 (0.3%) |
| Total | 1,448 (100.0%) | 1,212 (100.0%) |
Household Income by Mortgage Status in Trimble County
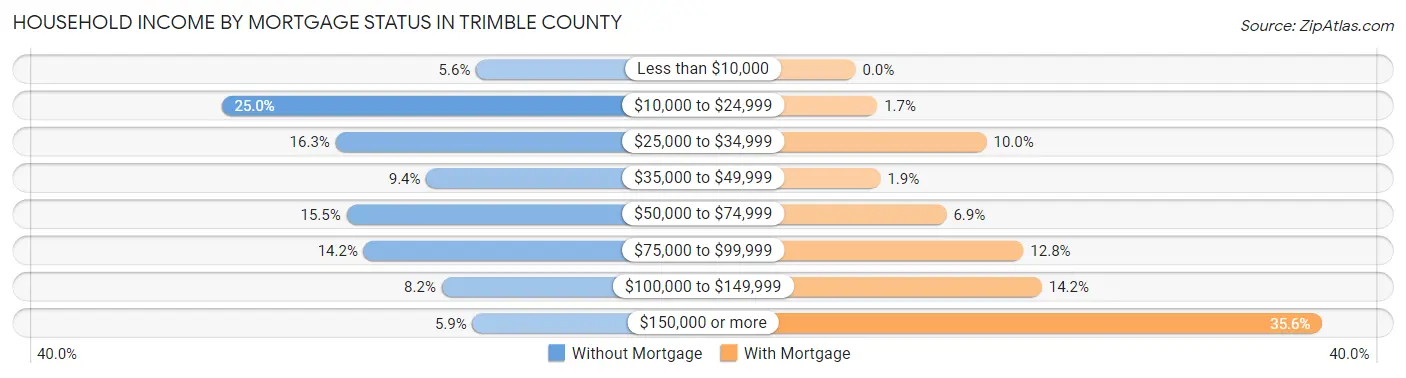
| Household Income | Without Mortgage | With Mortgage |
| Less than $10,000 | 81 (5.6%) | 0 (0.0%) |
| $10,000 to $24,999 | 362 (25.0%) | 20 (1.7%) |
| $25,000 to $34,999 | 236 (16.3%) | 121 (10.0%) |
| $35,000 to $49,999 | 136 (9.4%) | 23 (1.9%) |
| $50,000 to $74,999 | 224 (15.5%) | 84 (6.9%) |
| $75,000 to $99,999 | 205 (14.2%) | 155 (12.8%) |
| $100,000 to $149,999 | 119 (8.2%) | 172 (14.2%) |
| $150,000 or more | 85 (5.9%) | 431 (35.6%) |
| Total | 1,448 (100.0%) | 1,212 (100.0%) |
Property Value to Household Income Ratio in Trimble County
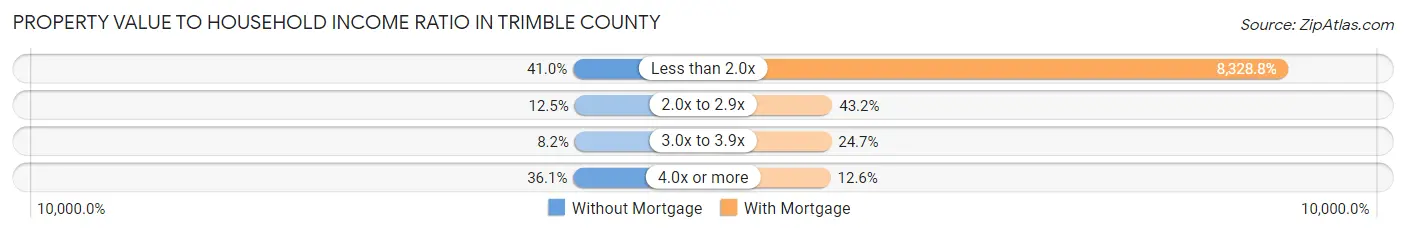
| Value-to-Income Ratio | Without Mortgage | With Mortgage |
| Less than 2.0x | 594 (41.0%) | 100,945 (8,328.8%) |
| 2.0x to 2.9x | 181 (12.5%) | 523 (43.1%) |
| 3.0x to 3.9x | 119 (8.2%) | 299 (24.7%) |
| 4.0x or more | 522 (36.0%) | 153 (12.6%) |
| Total | 1,448 (100.0%) | 1,212 (100.0%) |
Real Estate Taxes by Mortgage Status in Trimble County
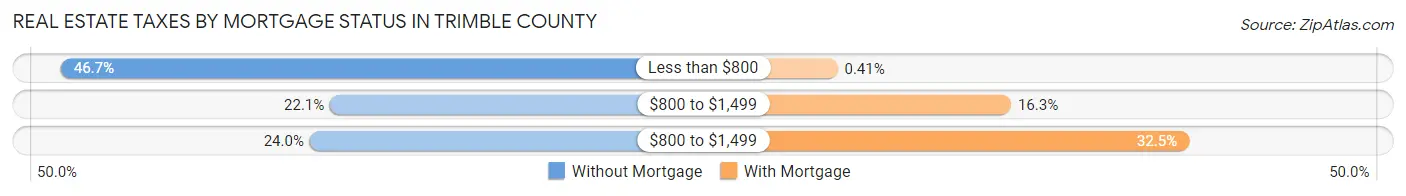
| Property Taxes | Without Mortgage | With Mortgage |
| Less than $800 | 676 (46.7%) | 5 (0.4%) |
| $800 to $1,499 | 320 (22.1%) | 197 (16.3%) |
| $800 to $1,499 | 347 (24.0%) | 394 (32.5%) |
| Total | 1,448 (100.0%) | 1,212 (100.0%) |
Health & Disability in Trimble County
Health Insurance Coverage by Age in Trimble County
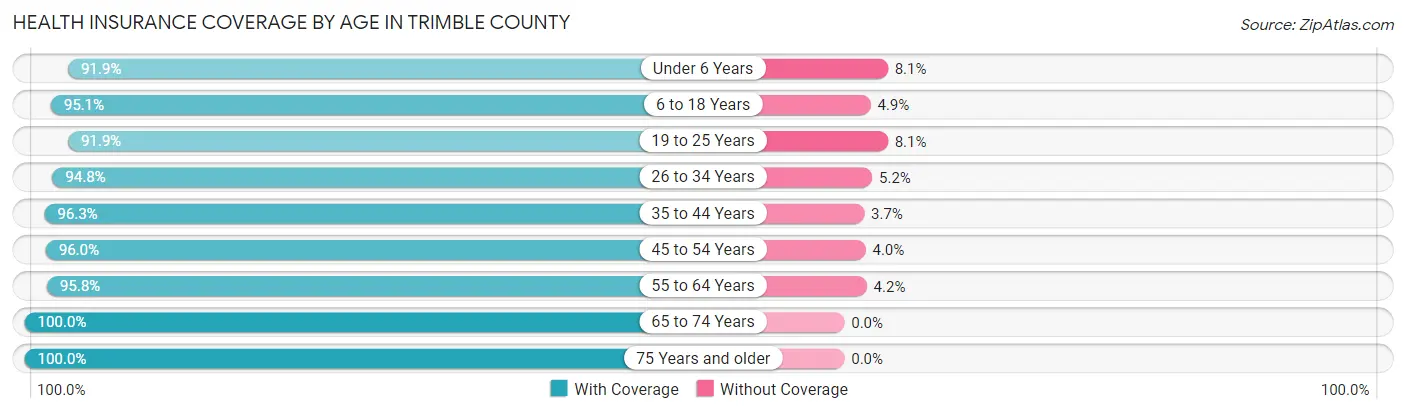
| Age Bracket | With Coverage | Without Coverage |
| Under 6 Years | 420 (91.9%) | 37 (8.1%) |
| 6 to 18 Years | 1,399 (95.1%) | 72 (4.9%) |
| 19 to 25 Years | 625 (91.9%) | 55 (8.1%) |
| 26 to 34 Years | 950 (94.8%) | 52 (5.2%) |
| 35 to 44 Years | 910 (96.3%) | 35 (3.7%) |
| 45 to 54 Years | 1,140 (96.0%) | 47 (4.0%) |
| 55 to 64 Years | 1,218 (95.8%) | 53 (4.2%) |
| 65 to 74 Years | 916 (100.0%) | 0 (0.0%) |
| 75 Years and older | 532 (100.0%) | 0 (0.0%) |
| Total | 8,110 (95.9%) | 351 (4.2%) |
Health Insurance Coverage by Citizenship Status in Trimble County
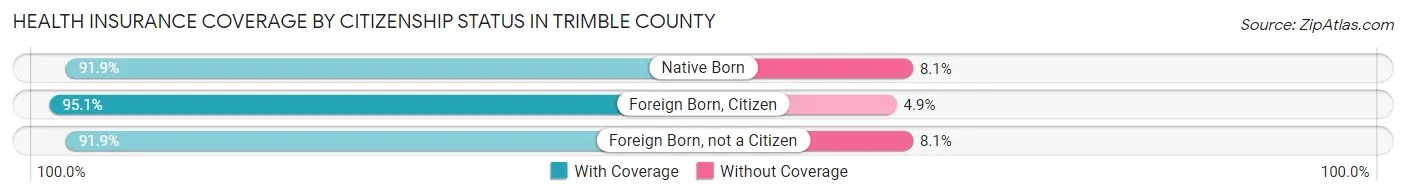
| Citizenship Status | With Coverage | Without Coverage |
| Native Born | 420 (91.9%) | 37 (8.1%) |
| Foreign Born, Citizen | 1,399 (95.1%) | 72 (4.9%) |
| Foreign Born, not a Citizen | 625 (91.9%) | 55 (8.1%) |
Health Insurance Coverage by Household Income in Trimble County
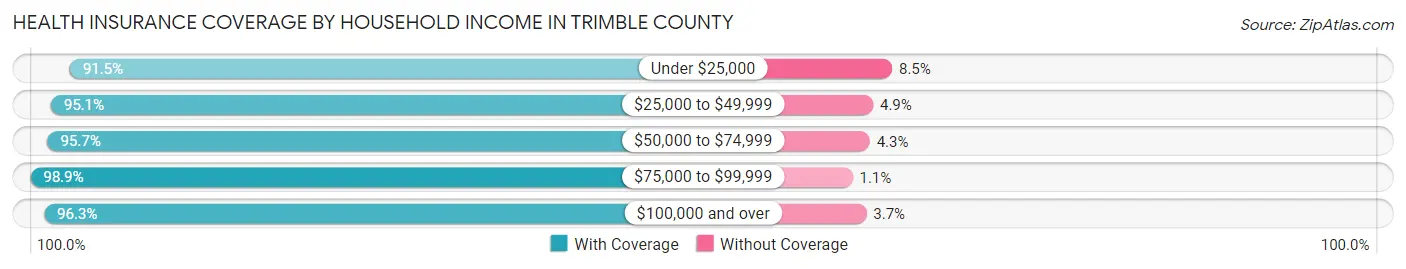
| Household Income | With Coverage | Without Coverage |
| Under $25,000 | 1,263 (91.5%) | 117 (8.5%) |
| $25,000 to $49,999 | 1,121 (95.1%) | 58 (4.9%) |
| $50,000 to $74,999 | 937 (95.7%) | 42 (4.3%) |
| $75,000 to $99,999 | 1,765 (98.9%) | 19 (1.1%) |
| $100,000 and over | 3,024 (96.3%) | 115 (3.7%) |
Public vs Private Health Insurance Coverage by Age in Trimble County
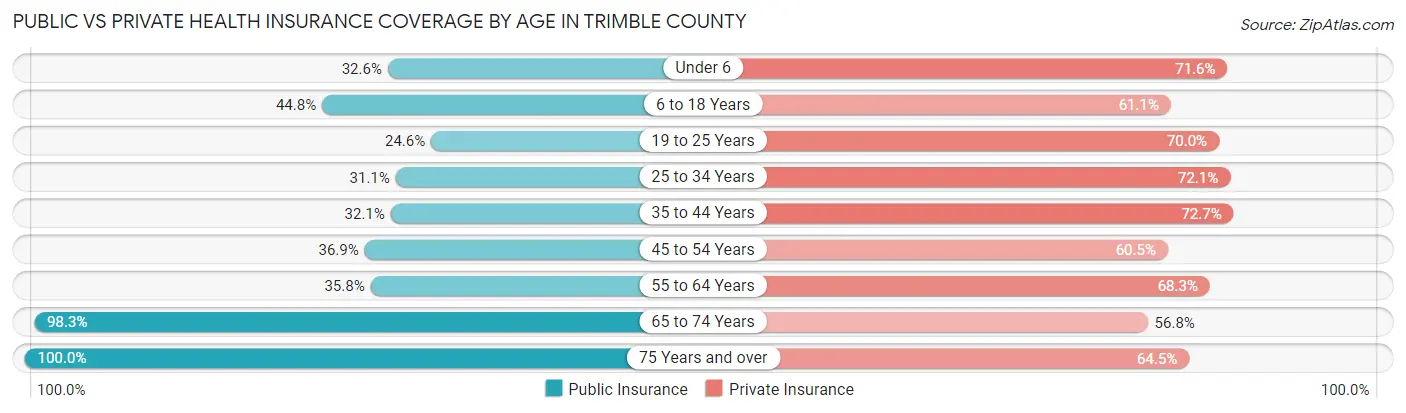
| Age Bracket | Public Insurance | Private Insurance |
| Under 6 | 149 (32.6%) | 327 (71.6%) |
| 6 to 18 Years | 659 (44.8%) | 898 (61.1%) |
| 19 to 25 Years | 167 (24.6%) | 476 (70.0%) |
| 25 to 34 Years | 312 (31.1%) | 722 (72.1%) |
| 35 to 44 Years | 303 (32.1%) | 687 (72.7%) |
| 45 to 54 Years | 438 (36.9%) | 718 (60.5%) |
| 55 to 64 Years | 455 (35.8%) | 868 (68.3%) |
| 65 to 74 Years | 900 (98.3%) | 520 (56.8%) |
| 75 Years and over | 532 (100.0%) | 343 (64.5%) |
| Total | 3,915 (46.3%) | 5,559 (65.7%) |
Disability Status by Sex by Age in Trimble County
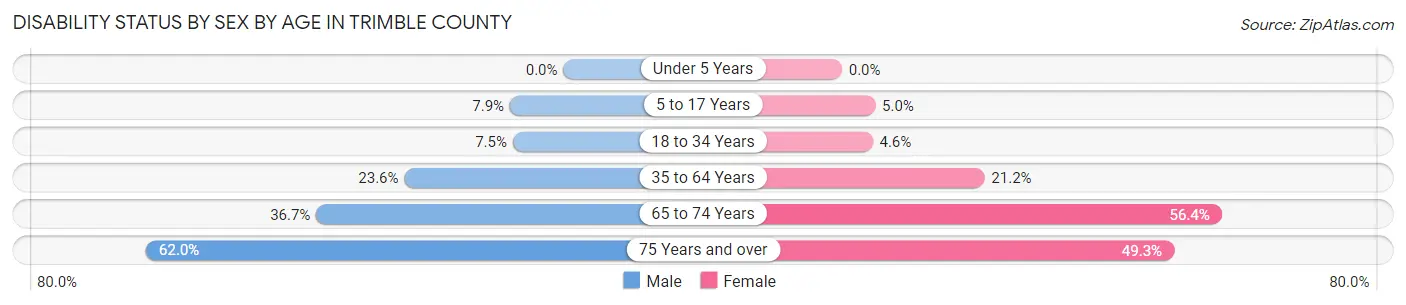
| Age Bracket | Male | Female |
| Under 5 Years | 0 (0.0%) | 0 (0.0%) |
| 5 to 17 Years | 56 (7.9%) | 35 (5.0%) |
| 18 to 34 Years | 69 (7.5%) | 39 (4.6%) |
| 35 to 64 Years | 400 (23.6%) | 362 (21.2%) |
| 65 to 74 Years | 167 (36.7%) | 260 (56.4%) |
| 75 Years and over | 150 (62.0%) | 143 (49.3%) |
Disability Class by Sex by Age in Trimble County
Disability Class: Hearing Difficulty
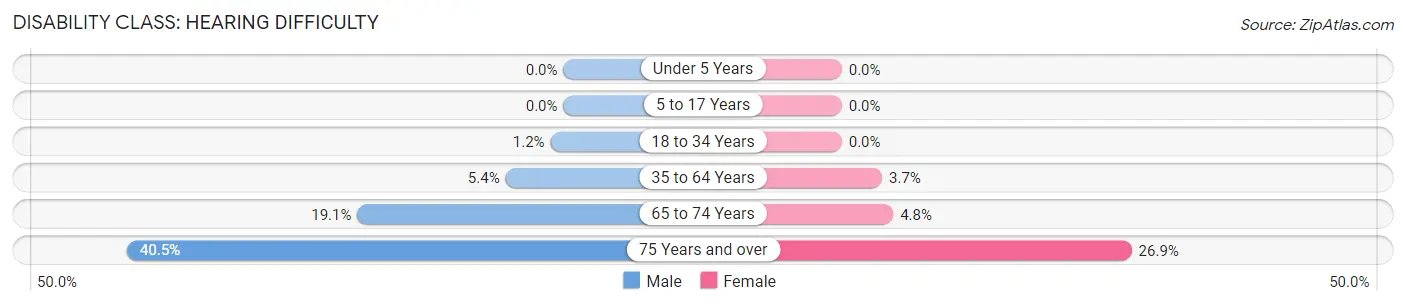
| Age Bracket | Male | Female |
| Under 5 Years | 0 (0.0%) | 0 (0.0%) |
| 5 to 17 Years | 0 (0.0%) | 0 (0.0%) |
| 18 to 34 Years | 11 (1.2%) | 0 (0.0%) |
| 35 to 64 Years | 91 (5.4%) | 64 (3.7%) |
| 65 to 74 Years | 87 (19.1%) | 22 (4.8%) |
| 75 Years and over | 98 (40.5%) | 78 (26.9%) |
Disability Class: Vision Difficulty
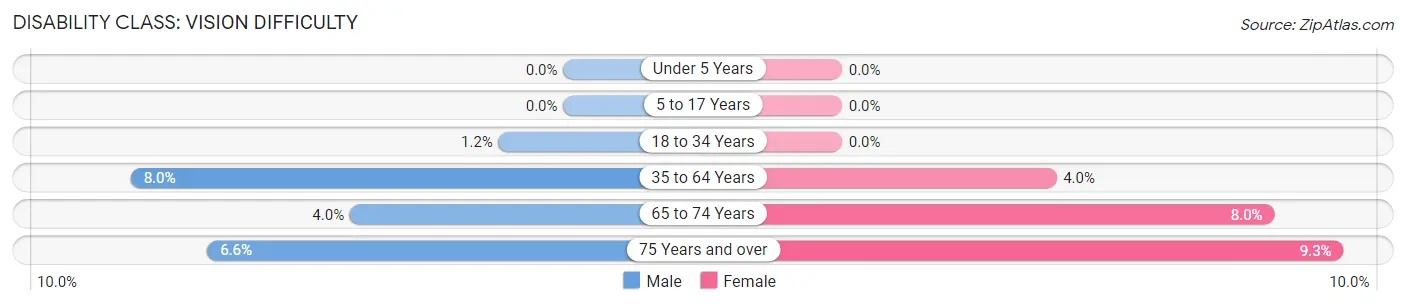
| Age Bracket | Male | Female |
| Under 5 Years | 0 (0.0%) | 0 (0.0%) |
| 5 to 17 Years | 0 (0.0%) | 0 (0.0%) |
| 18 to 34 Years | 11 (1.2%) | 0 (0.0%) |
| 35 to 64 Years | 136 (8.0%) | 68 (4.0%) |
| 65 to 74 Years | 18 (4.0%) | 37 (8.0%) |
| 75 Years and over | 16 (6.6%) | 27 (9.3%) |
Disability Class: Cognitive Difficulty
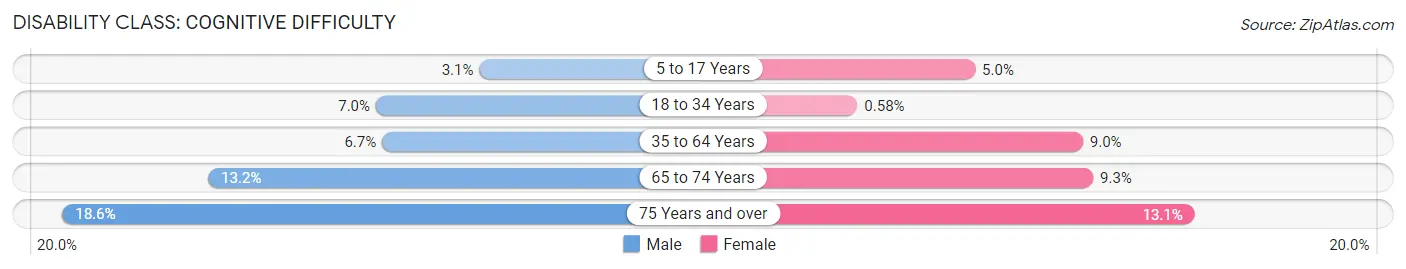
| Age Bracket | Male | Female |
| 5 to 17 Years | 22 (3.1%) | 35 (5.0%) |
| 18 to 34 Years | 64 (7.0%) | 5 (0.6%) |
| 35 to 64 Years | 114 (6.7%) | 153 (8.9%) |
| 65 to 74 Years | 60 (13.2%) | 43 (9.3%) |
| 75 Years and over | 45 (18.6%) | 38 (13.1%) |
Disability Class: Ambulatory Difficulty
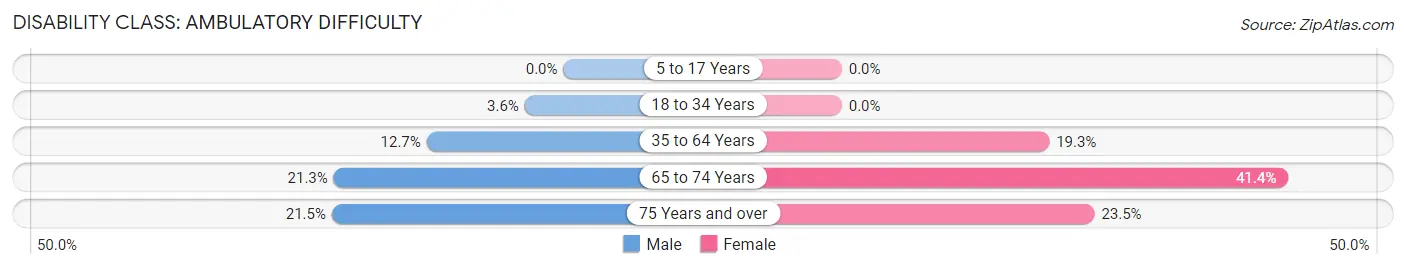
| Age Bracket | Male | Female |
| 5 to 17 Years | 0 (0.0%) | 0 (0.0%) |
| 18 to 34 Years | 33 (3.6%) | 0 (0.0%) |
| 35 to 64 Years | 215 (12.7%) | 329 (19.3%) |
| 65 to 74 Years | 97 (21.3%) | 191 (41.4%) |
| 75 Years and over | 52 (21.5%) | 68 (23.4%) |
Disability Class: Self-Care Difficulty
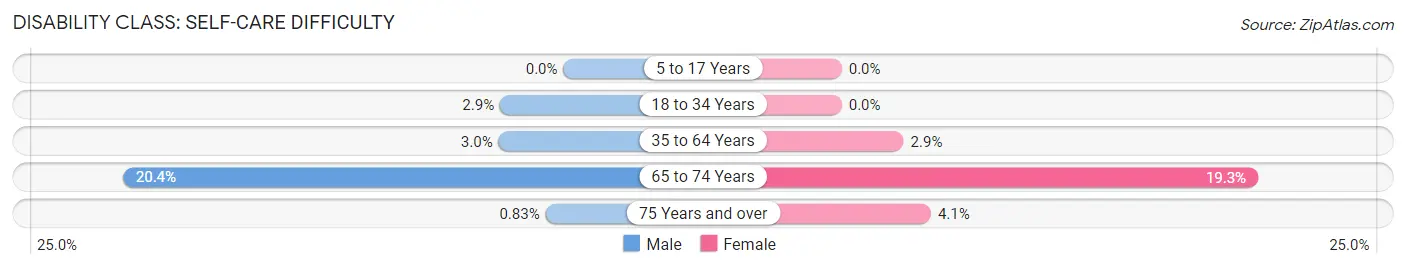
| Age Bracket | Male | Female |
| 5 to 17 Years | 0 (0.0%) | 0 (0.0%) |
| 18 to 34 Years | 27 (2.9%) | 0 (0.0%) |
| 35 to 64 Years | 51 (3.0%) | 49 (2.9%) |
| 65 to 74 Years | 93 (20.4%) | 89 (19.3%) |
| 75 Years and over | 2 (0.8%) | 12 (4.1%) |
Technology Access in Trimble County
Computing Device Access in Trimble County
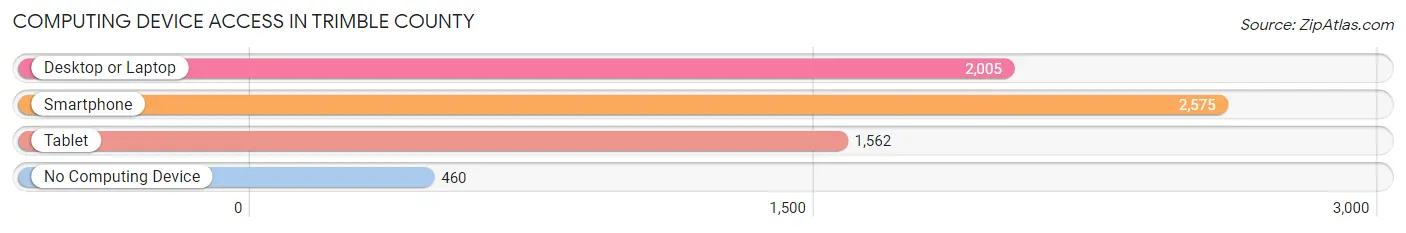
| Device Type | # Households | % Households |
| Desktop or Laptop | 2,005 | 61.3% |
| Smartphone | 2,575 | 78.7% |
| Tablet | 1,562 | 47.7% |
| No Computing Device | 460 | 14.1% |
| Total | 3,273 | 100.0% |
Internet Access in Trimble County
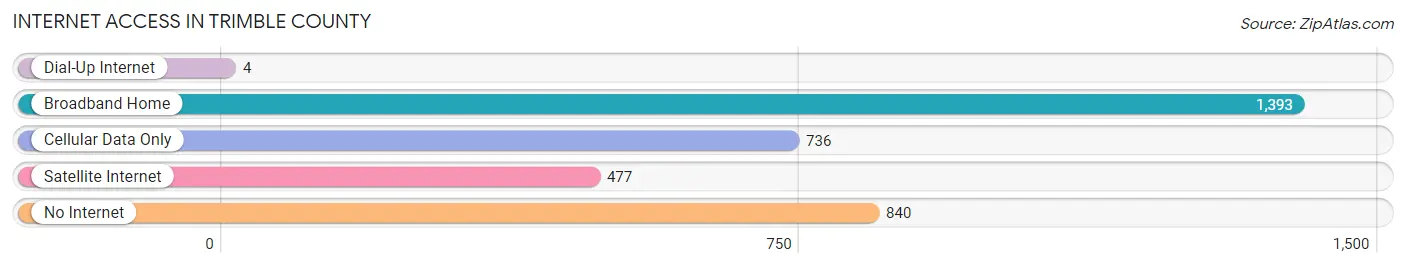
| Internet Type | # Households | % Households |
| Dial-Up Internet | 4 | 0.1% |
| Broadband Home | 1,393 | 42.6% |
| Cellular Data Only | 736 | 22.5% |
| Satellite Internet | 477 | 14.6% |
| No Internet | 840 | 25.7% |
| Total | 3,273 | 100.0% |
Trimble County Summary
Trimble County is located in the northern part of Kentucky, in the Bluegrass Region. It is bordered by Carroll County to the north, Henry County to the east, Oldham County to the south, and Jefferson County to the west. The county seat is Bedford, and the county was formed in 1836 from parts of Gallatin, Henry, and Oldham counties. The county is named for Robert Trimble, a United States Supreme Court Justice.
Trimble County has a total area of 206 square miles, of which 202 square miles is land and 4 square miles is water. The county is located in the Bluegrass Region of Kentucky, and is characterized by rolling hills and fertile soil. The county is drained by the Kentucky River and its tributaries, including the Little Kentucky River, the Eagle Creek, and the Long Run Creek.
The population of Trimble County was 8,845 in 2000, with a population density of 44 people per square mile. The median household income was $37,845, and the median family income was $45,845. The per capita income was $19,845. The population was spread out, with 25.3% under the age of 18, 8.2% from 18 to 24, 28.2% from 25 to 44, 24.2% from 45 to 64, and 14.1% who were 65 years of age or older. The median age was 38 years.
The economy of Trimble County is largely agricultural. The county is home to several large farms, and the main crops grown are corn, soybeans, wheat, and hay. Livestock production is also important, with cattle, hogs, and sheep being raised in the county. The county also has a number of small businesses, including retail stores, restaurants, and service providers.
Trimble County is served by two school districts, the Trimble County School District and the Carroll County School District. The county also has a number of private schools, including the Trimble County Christian Academy and the Trimble County High School. The county is home to a number of parks and recreational areas, including the Trimble County Park, the Trimble County Recreation Center, and the Trimble County Golf Course.
Trimble County is a rural county with a rich history and a strong agricultural economy. The county is home to a number of small businesses, and the population is spread out across the county. The county is served by two school districts, and there are a number of parks and recreational areas for residents to enjoy. The county is a great place to live, work, and raise a family.
Common Questions
What is Per Capita Income in Trimble County?
Per Capita income in Trimble County is $28,958.
What is the Median Family Income in Trimble County?
Median Family Income in Trimble County is $74,564.
What is the Median Household income in Trimble County?
Median Household Income in Trimble County is $66,492.
What is Income or Wage Gap in Trimble County?
Income or Wage Gap in Trimble County is 50.4%.
Women in Trimble County earn 49.6 cents for every dollar earned by a man.
What is Family Income Deficit in Trimble County?
Family Income Deficit in Trimble County is $9,616.
Families that are below poverty line in Trimble County earn $9,616 less on average than the poverty threshold level.
What is Inequality or Gini Index in Trimble County?
Inequality or Gini Index in Trimble County is 0.43.
What is the Total Population of Trimble County?
Total Population of Trimble County is 8,510.
What is the Total Male Population of Trimble County?
Total Male Population of Trimble County is 4,271.
What is the Total Female Population of Trimble County?
Total Female Population of Trimble County is 4,239.
What is the Ratio of Males per 100 Females in Trimble County?
There are 100.75 Males per 100 Females in Trimble County.
What is the Ratio of Females per 100 Males in Trimble County?
There are 99.25 Females per 100 Males in Trimble County.
What is the Median Population Age in Trimble County?
Median Population Age in Trimble County is 42.0 Years.
What is the Average Family Size in Trimble County
Average Family Size in Trimble County is 3.0 People.
What is the Average Household Size in Trimble County
Average Household Size in Trimble County is 2.6 People.
How Large is the Labor Force in Trimble County?
There are 3,961 People in the Labor Forcein in Trimble County.
What is the Percentage of People in the Labor Force in Trimble County?
57.4% of People are in the Labor Force in Trimble County.
What is the Unemployment Rate in Trimble County?
Unemployment Rate in Trimble County is 8.4%.