Zip Codes with the Highest Percentage of Population Employed in Security & Protection in Bowling Green, KY
RELATED REPORTS & OPTIONS
Security & Protection
Bowling Green
Compare Zip Codes
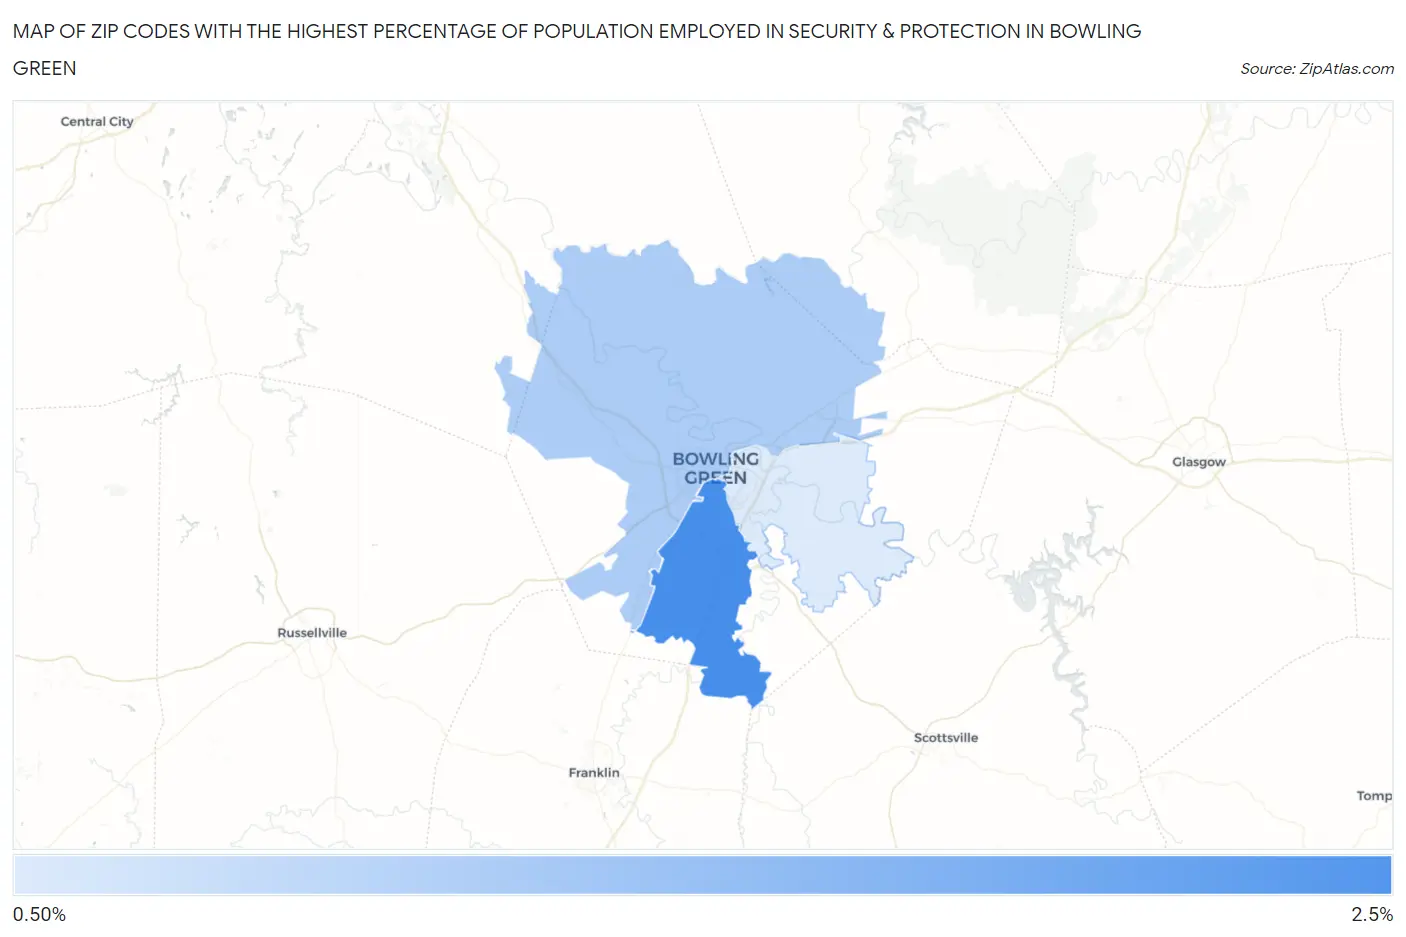
Map of Zip Codes with the Highest Percentage of Population Employed in Security & Protection in Bowling Green
1.2%
2.3%
Zip Codes with the Highest Percentage of Population Employed in Security & Protection in Bowling Green, KY
| Zip Code | % Employed | vs State | vs National | |
| 1. | 42104 | 2.3% | 2.0%(+0.297)#218 | 2.1%(+0.160)#10,590 |
| 2. | 42101 | 1.5% | 2.0%(-0.468)#308 | 2.1%(-0.605)#15,845 |
| 3. | 42103 | 1.2% | 2.0%(-0.820)#355 | 2.1%(-0.956)#18,563 |
1
Common Questions
What are the Top Zip Codes with the Highest Percentage of Population Employed in Security & Protection in Bowling Green, KY?
Top Zip Codes with the Highest Percentage of Population Employed in Security & Protection in Bowling Green, KY are:
What zip code has the Highest Percentage of Population Employed in Security & Protection in Bowling Green, KY?
42104 has the Highest Percentage of Population Employed in Security & Protection in Bowling Green, KY with 2.3%.
What is the Percentage of Population Employed in Security & Protection in Bowling Green, KY?
Percentage of Population Employed in Security & Protection in Bowling Green is 1.6%.
What is the Percentage of Population Employed in Security & Protection in Kentucky?
Percentage of Population Employed in Security & Protection in Kentucky is 2.0%.
What is the Percentage of Population Employed in Security & Protection in the United States?
Percentage of Population Employed in Security & Protection in the United States is 2.1%.