Zip Codes with the Highest Percentage of Population Employed in Real Estate, Rental & Leasing in Bowling Green, KY
RELATED REPORTS & OPTIONS
Real Estate, Rental & Leasing
Bowling Green
Compare Zip Codes
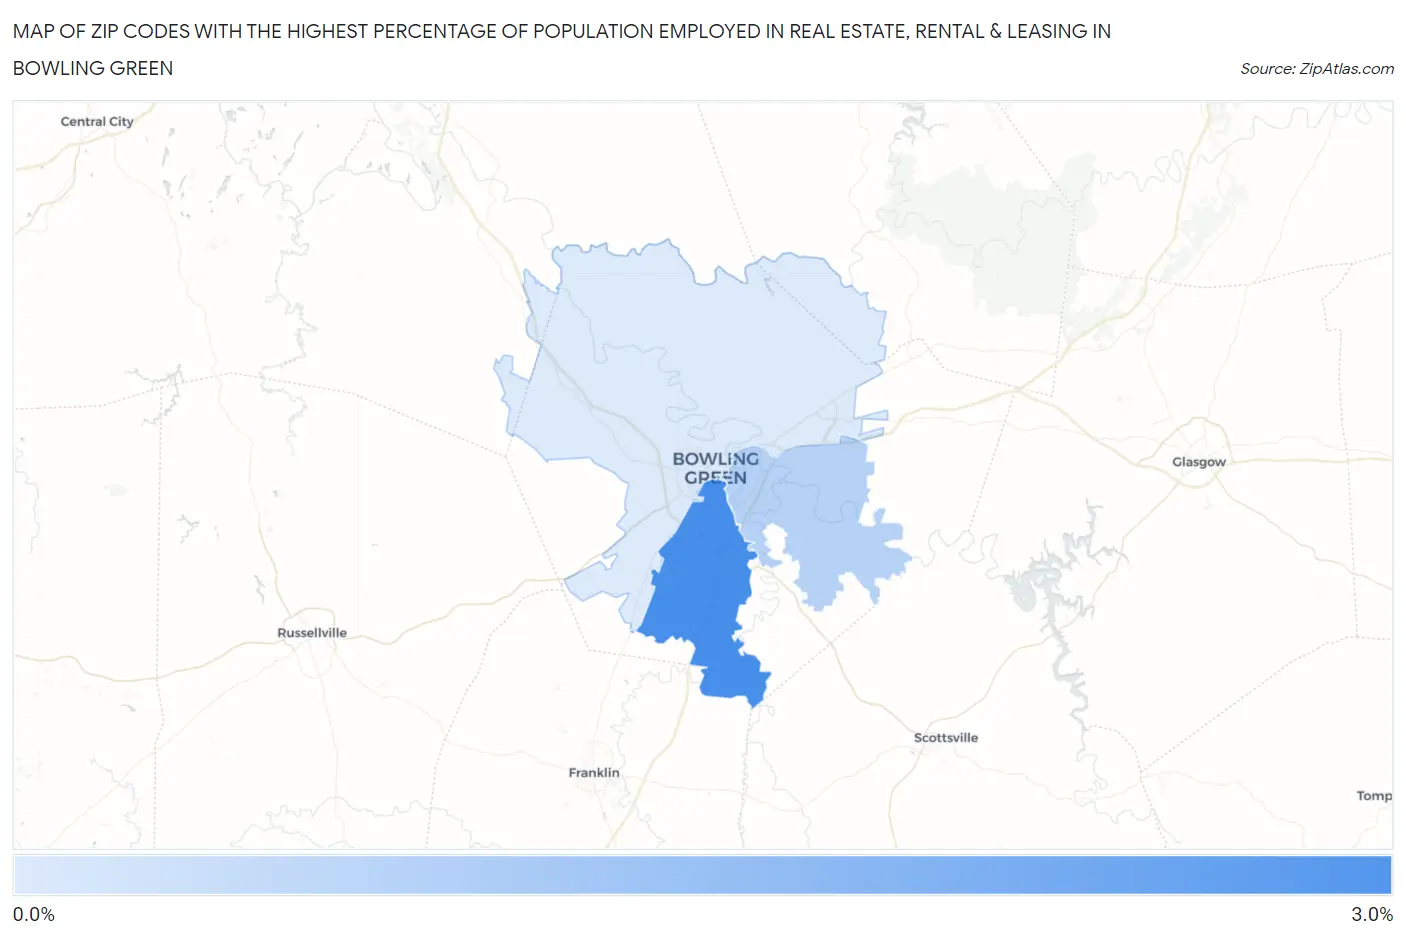
Map of Zip Codes with the Highest Percentage of Population Employed in Real Estate, Rental & Leasing in Bowling Green
0.66%
2.6%
Zip Codes with the Highest Percentage of Population Employed in Real Estate, Rental & Leasing in Bowling Green, KY
| Zip Code | % Employed | vs State | vs National | |
| 1. | 42104 | 2.6% | 1.4%(+1.28)#56 | 1.9%(+0.751)#4,956 |
| 2. | 42103 | 1.2% | 1.4%(-0.183)#187 | 1.9%(-0.716)#13,693 |
| 3. | 42101 | 0.66% | 1.4%(-0.700)#259 | 1.9%(-1.23)#17,798 |
1
Common Questions
What are the Top Zip Codes with the Highest Percentage of Population Employed in Real Estate, Rental & Leasing in Bowling Green, KY?
Top Zip Codes with the Highest Percentage of Population Employed in Real Estate, Rental & Leasing in Bowling Green, KY are:
What zip code has the Highest Percentage of Population Employed in Real Estate, Rental & Leasing in Bowling Green, KY?
42104 has the Highest Percentage of Population Employed in Real Estate, Rental & Leasing in Bowling Green, KY with 2.6%.
What is the Percentage of Population Employed in Real Estate, Rental & Leasing in Bowling Green, KY?
Percentage of Population Employed in Real Estate, Rental & Leasing in Bowling Green is 1.5%.
What is the Percentage of Population Employed in Real Estate, Rental & Leasing in Kentucky?
Percentage of Population Employed in Real Estate, Rental & Leasing in Kentucky is 1.4%.
What is the Percentage of Population Employed in Real Estate, Rental & Leasing in the United States?
Percentage of Population Employed in Real Estate, Rental & Leasing in the United States is 1.9%.