Zip Codes with the Highest Percentage of Population Employed in Community & Social Service in Bowling Green, KY
RELATED REPORTS & OPTIONS
Community & Social Service
Bowling Green
Compare Zip Codes
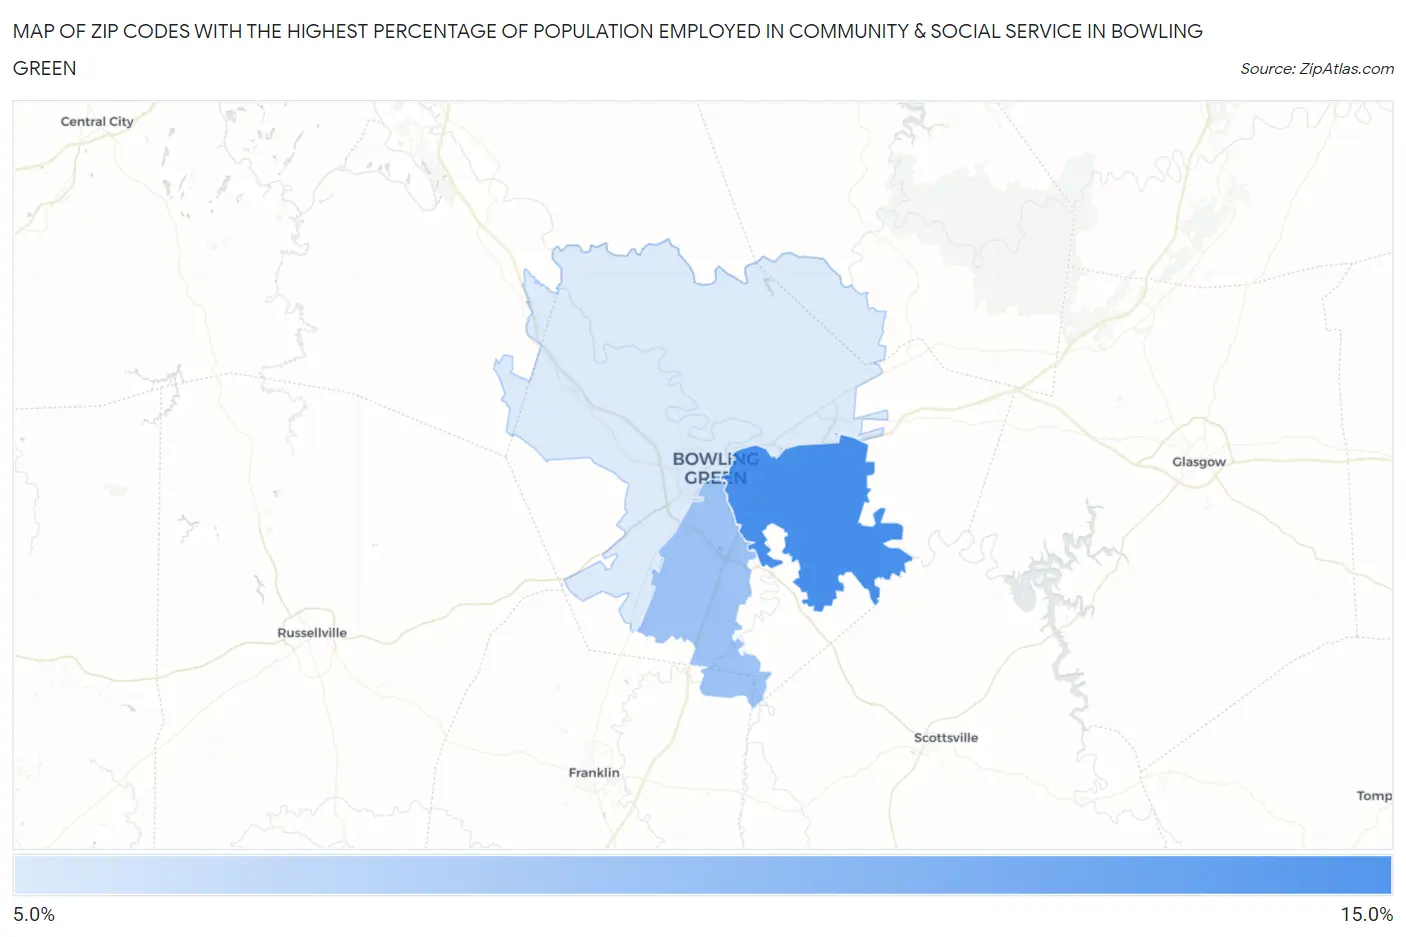
Map of Zip Codes with the Highest Percentage of Population Employed in Community & Social Service in Bowling Green
9.2%
13.1%
Zip Codes with the Highest Percentage of Population Employed in Community & Social Service in Bowling Green, KY
| Zip Code | % Employed | vs State | vs National | |
| 1. | 42103 | 13.1% | 10.3%(+2.78)#151 | 11.2%(+1.89)#7,386 |
| 2. | 42104 | 10.9% | 10.3%(+0.600)#233 | 11.2%(-0.284)#11,812 |
| 3. | 42101 | 9.2% | 10.3%(-1.14)#319 | 11.2%(-2.02)#16,292 |
1
Common Questions
What are the Top Zip Codes with the Highest Percentage of Population Employed in Community & Social Service in Bowling Green, KY?
Top Zip Codes with the Highest Percentage of Population Employed in Community & Social Service in Bowling Green, KY are:
What zip code has the Highest Percentage of Population Employed in Community & Social Service in Bowling Green, KY?
42103 has the Highest Percentage of Population Employed in Community & Social Service in Bowling Green, KY with 13.1%.
What is the Percentage of Population Employed in Community & Social Service in Bowling Green, KY?
Percentage of Population Employed in Community & Social Service in Bowling Green is 10.8%.
What is the Percentage of Population Employed in Community & Social Service in Kentucky?
Percentage of Population Employed in Community & Social Service in Kentucky is 10.3%.
What is the Percentage of Population Employed in Community & Social Service in the United States?
Percentage of Population Employed in Community & Social Service in the United States is 11.2%.