Zip Codes with the Highest Percentage of Population Employed in Agriculture, Fishing & Hunting in Bowling Green, KY
RELATED REPORTS & OPTIONS
Agriculture, Fishing & Hunting
Bowling Green
Compare Zip Codes
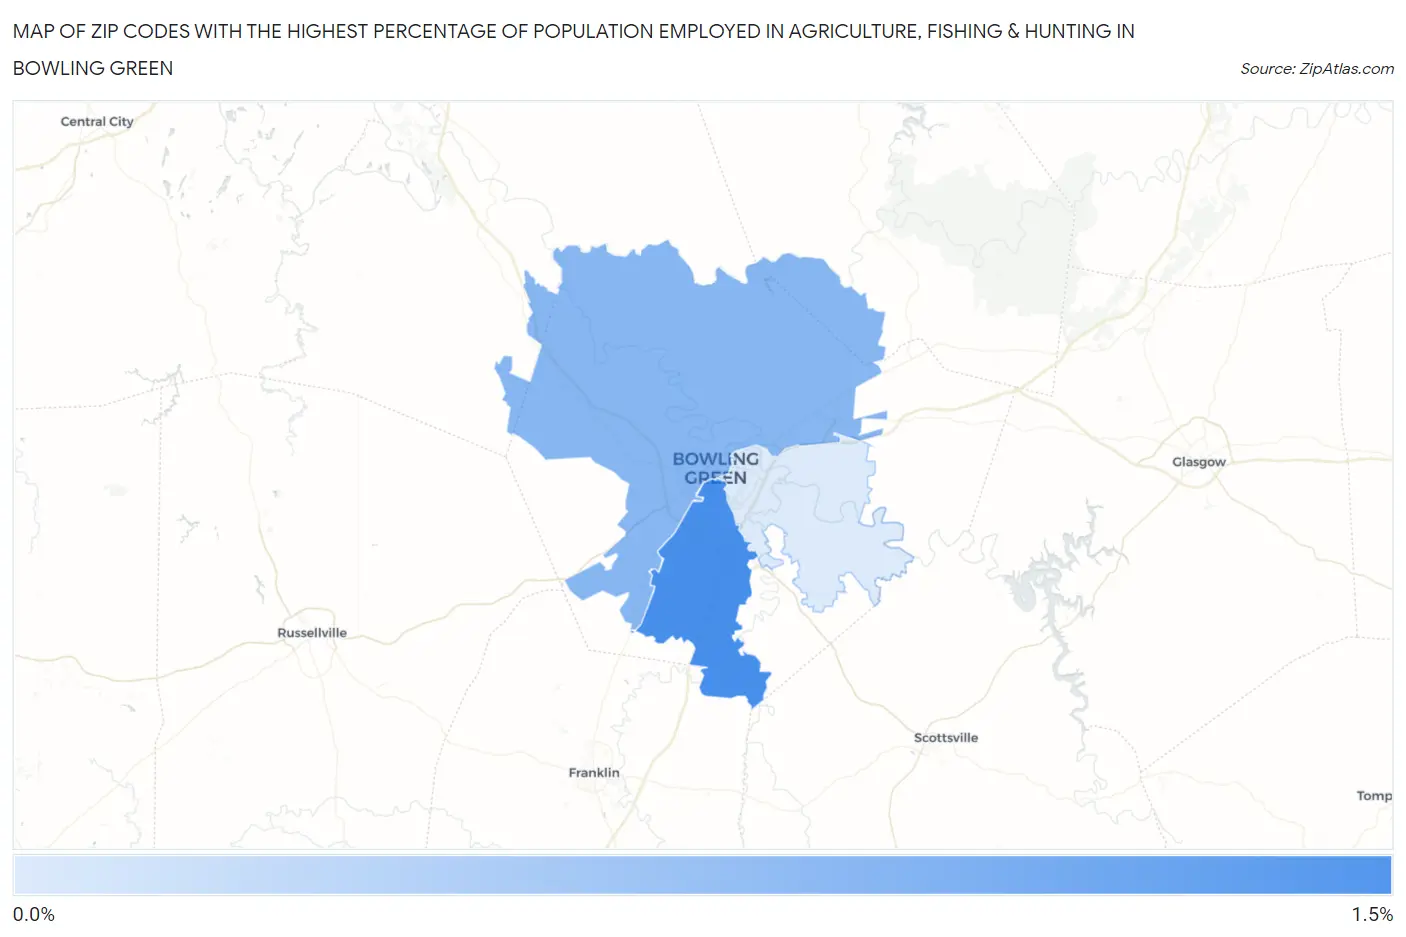
Map of Zip Codes with the Highest Percentage of Population Employed in Agriculture, Fishing & Hunting in Bowling Green
0.32%
1.2%
Zip Codes with the Highest Percentage of Population Employed in Agriculture, Fishing & Hunting in Bowling Green, KY
| Zip Code | % Employed | vs State | vs National | |
| 1. | 42104 | 1.2% | 1.3%(-0.155)#262 | 1.2%(-0.040)#15,562 |
| 2. | 42101 | 0.80% | 1.3%(-0.513)#299 | 1.2%(-0.398)#17,230 |
| 3. | 42103 | 0.32% | 1.3%(-0.994)#354 | 1.2%(-0.879)#20,941 |
1
Common Questions
What are the Top Zip Codes with the Highest Percentage of Population Employed in Agriculture, Fishing & Hunting in Bowling Green, KY?
Top Zip Codes with the Highest Percentage of Population Employed in Agriculture, Fishing & Hunting in Bowling Green, KY are:
What zip code has the Highest Percentage of Population Employed in Agriculture, Fishing & Hunting in Bowling Green, KY?
42104 has the Highest Percentage of Population Employed in Agriculture, Fishing & Hunting in Bowling Green, KY with 1.2%.
What is the Percentage of Population Employed in Agriculture, Fishing & Hunting in Bowling Green, KY?
Percentage of Population Employed in Agriculture, Fishing & Hunting in Bowling Green is 0.38%.
What is the Percentage of Population Employed in Agriculture, Fishing & Hunting in Kentucky?
Percentage of Population Employed in Agriculture, Fishing & Hunting in Kentucky is 1.3%.
What is the Percentage of Population Employed in Agriculture, Fishing & Hunting in the United States?
Percentage of Population Employed in Agriculture, Fishing & Hunting in the United States is 1.2%.