Zip Codes with the Highest Percentage of Population Employed in Business & Financial in Bowling Green, KY
RELATED REPORTS & OPTIONS
Business & Financial
Bowling Green
Compare Zip Codes
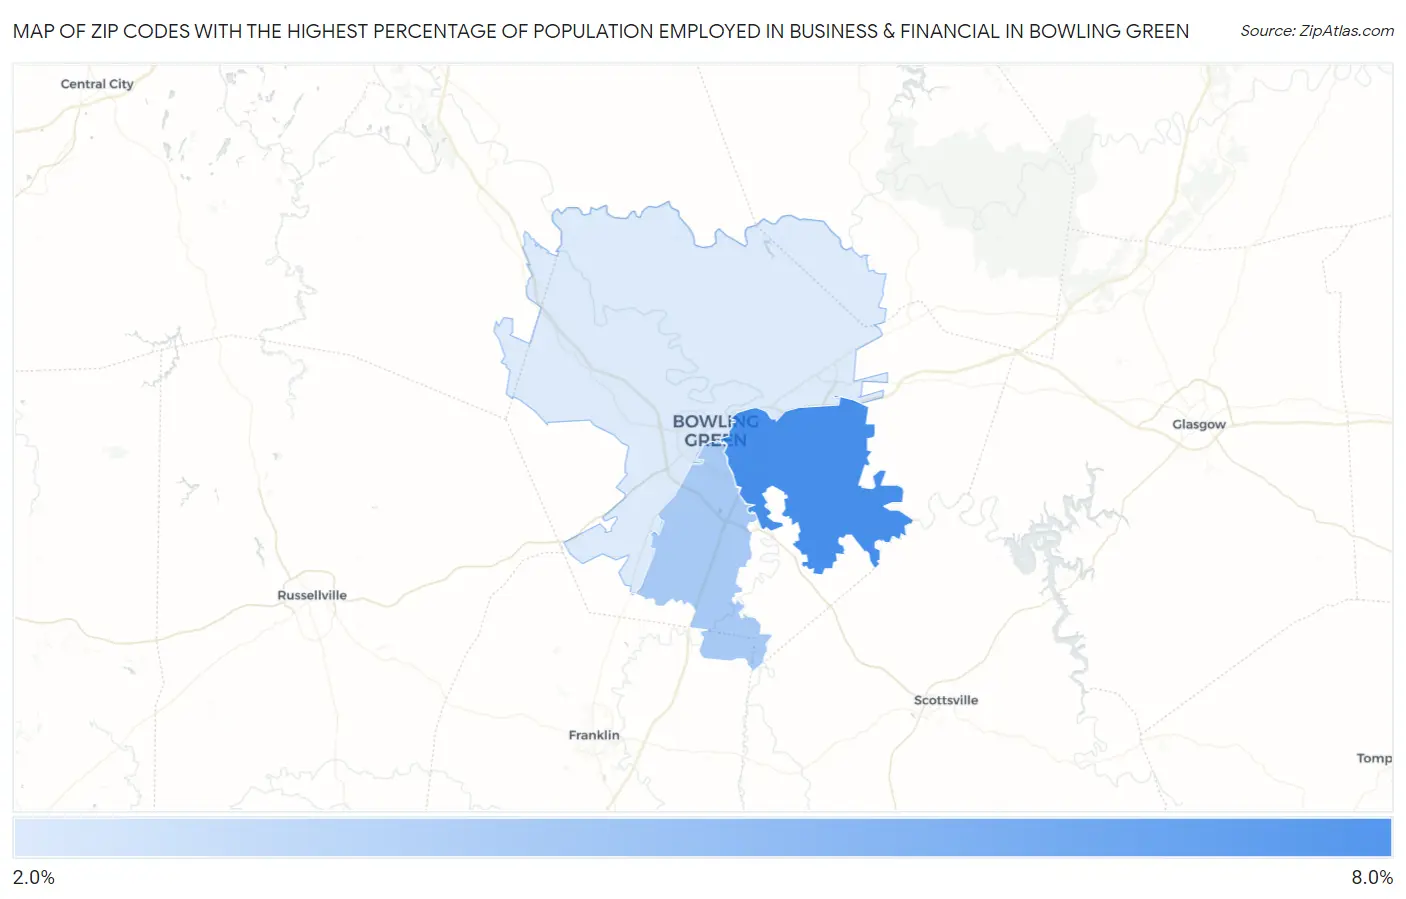
Map of Zip Codes with the Highest Percentage of Population Employed in Business & Financial in Bowling Green
2.9%
7.9%
Zip Codes with the Highest Percentage of Population Employed in Business & Financial in Bowling Green, KY
| Zip Code | % Employed | vs State | vs National | |
| 1. | 42103 | 7.9% | 4.6%(+3.31)#63 | 5.8%(+2.16)#4,347 |
| 2. | 42104 | 4.6% | 4.6%(+0.021)#176 | 5.8%(-1.12)#11,628 |
| 3. | 42101 | 2.9% | 4.6%(-1.74)#300 | 5.8%(-2.88)#18,298 |
1
Common Questions
What are the Top Zip Codes with the Highest Percentage of Population Employed in Business & Financial in Bowling Green, KY?
Top Zip Codes with the Highest Percentage of Population Employed in Business & Financial in Bowling Green, KY are:
What zip code has the Highest Percentage of Population Employed in Business & Financial in Bowling Green, KY?
42103 has the Highest Percentage of Population Employed in Business & Financial in Bowling Green, KY with 7.9%.
What is the Percentage of Population Employed in Business & Financial in Bowling Green, KY?
Percentage of Population Employed in Business & Financial in Bowling Green is 4.6%.
What is the Percentage of Population Employed in Business & Financial in Kentucky?
Percentage of Population Employed in Business & Financial in Kentucky is 4.6%.
What is the Percentage of Population Employed in Business & Financial in the United States?
Percentage of Population Employed in Business & Financial in the United States is 5.8%.