Zip Codes with the Highest Percentage of Population Employed in Health Diagnosing & Treating in Bowling Green, KY
RELATED REPORTS & OPTIONS
Health Diagnosing & Treating
Bowling Green
Compare Zip Codes
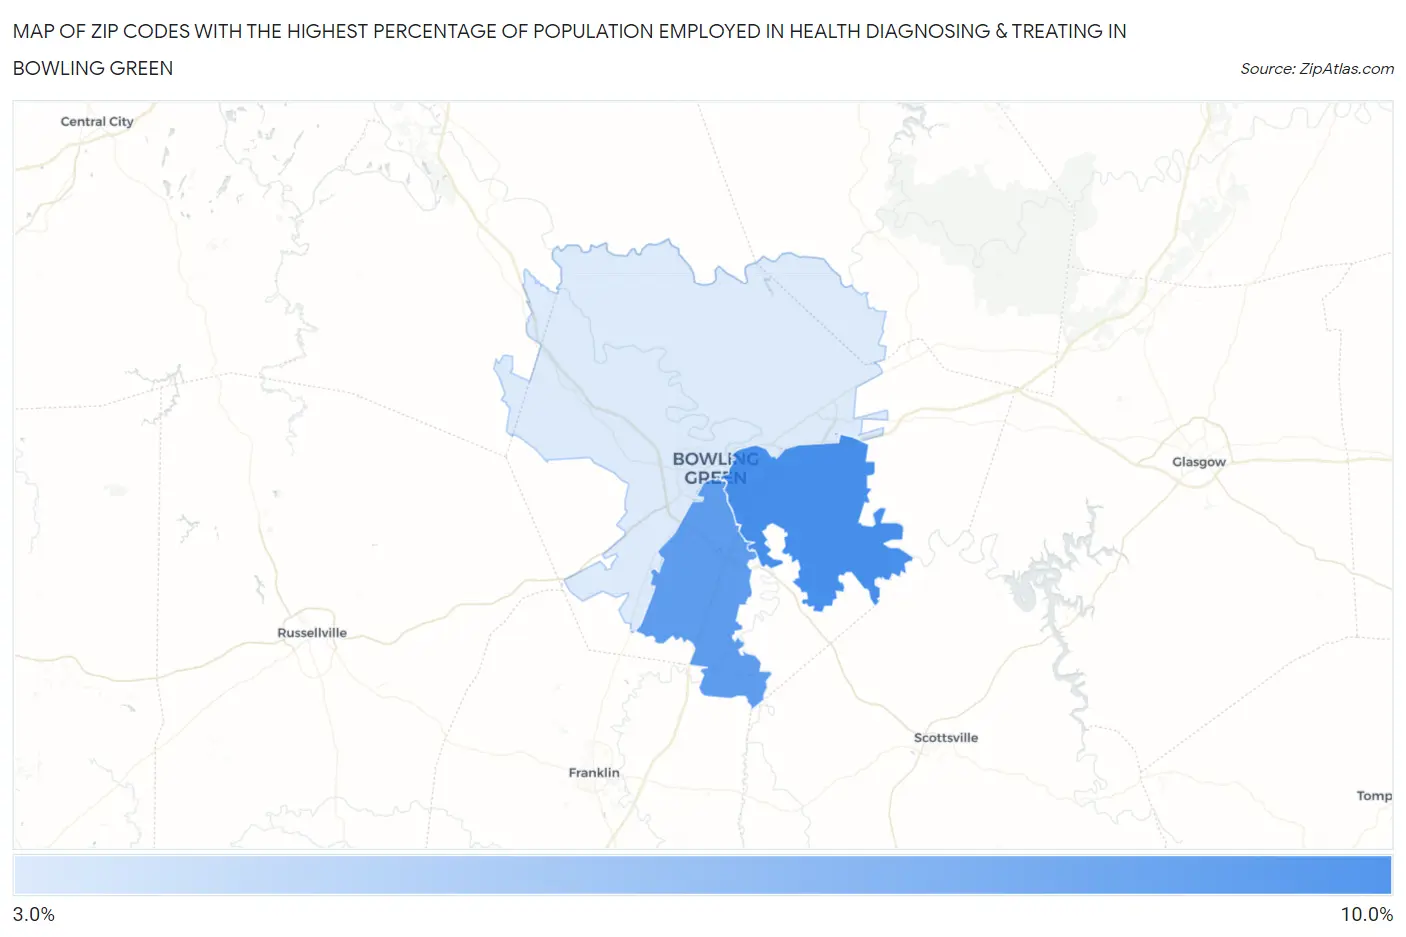
Map of Zip Codes with the Highest Percentage of Population Employed in Health Diagnosing & Treating in Bowling Green
3.7%
8.6%
Zip Codes with the Highest Percentage of Population Employed in Health Diagnosing & Treating in Bowling Green, KY
| Zip Code | % Employed | vs State | vs National | |
| 1. | 42103 | 8.6% | 7.2%(+1.34)#211 | 6.2%(+2.31)#6,232 |
| 2. | 42104 | 7.8% | 7.2%(+0.611)#254 | 6.2%(+1.58)#7,942 |
| 3. | 42101 | 3.7% | 7.2%(-3.54)#493 | 6.2%(-2.57)#22,375 |
1
Common Questions
What are the Top Zip Codes with the Highest Percentage of Population Employed in Health Diagnosing & Treating in Bowling Green, KY?
Top Zip Codes with the Highest Percentage of Population Employed in Health Diagnosing & Treating in Bowling Green, KY are:
What zip code has the Highest Percentage of Population Employed in Health Diagnosing & Treating in Bowling Green, KY?
42103 has the Highest Percentage of Population Employed in Health Diagnosing & Treating in Bowling Green, KY with 8.6%.
What is the Percentage of Population Employed in Health Diagnosing & Treating in Bowling Green, KY?
Percentage of Population Employed in Health Diagnosing & Treating in Bowling Green is 5.7%.
What is the Percentage of Population Employed in Health Diagnosing & Treating in Kentucky?
Percentage of Population Employed in Health Diagnosing & Treating in Kentucky is 7.2%.
What is the Percentage of Population Employed in Health Diagnosing & Treating in the United States?
Percentage of Population Employed in Health Diagnosing & Treating in the United States is 6.2%.