Zimbabwean vs Immigrants from Costa Rica Median Household Income
COMPARE
Zimbabwean
Immigrants from Costa Rica
Median Household Income
Median Household Income Comparison
Zimbabweans
Immigrants from Costa Rica
$90,618
MEDIAN HOUSEHOLD INCOME
97.2/ 100
METRIC RATING
108th/ 347
METRIC RANK
$85,054
MEDIAN HOUSEHOLD INCOME
49.2/ 100
METRIC RATING
175th/ 347
METRIC RANK
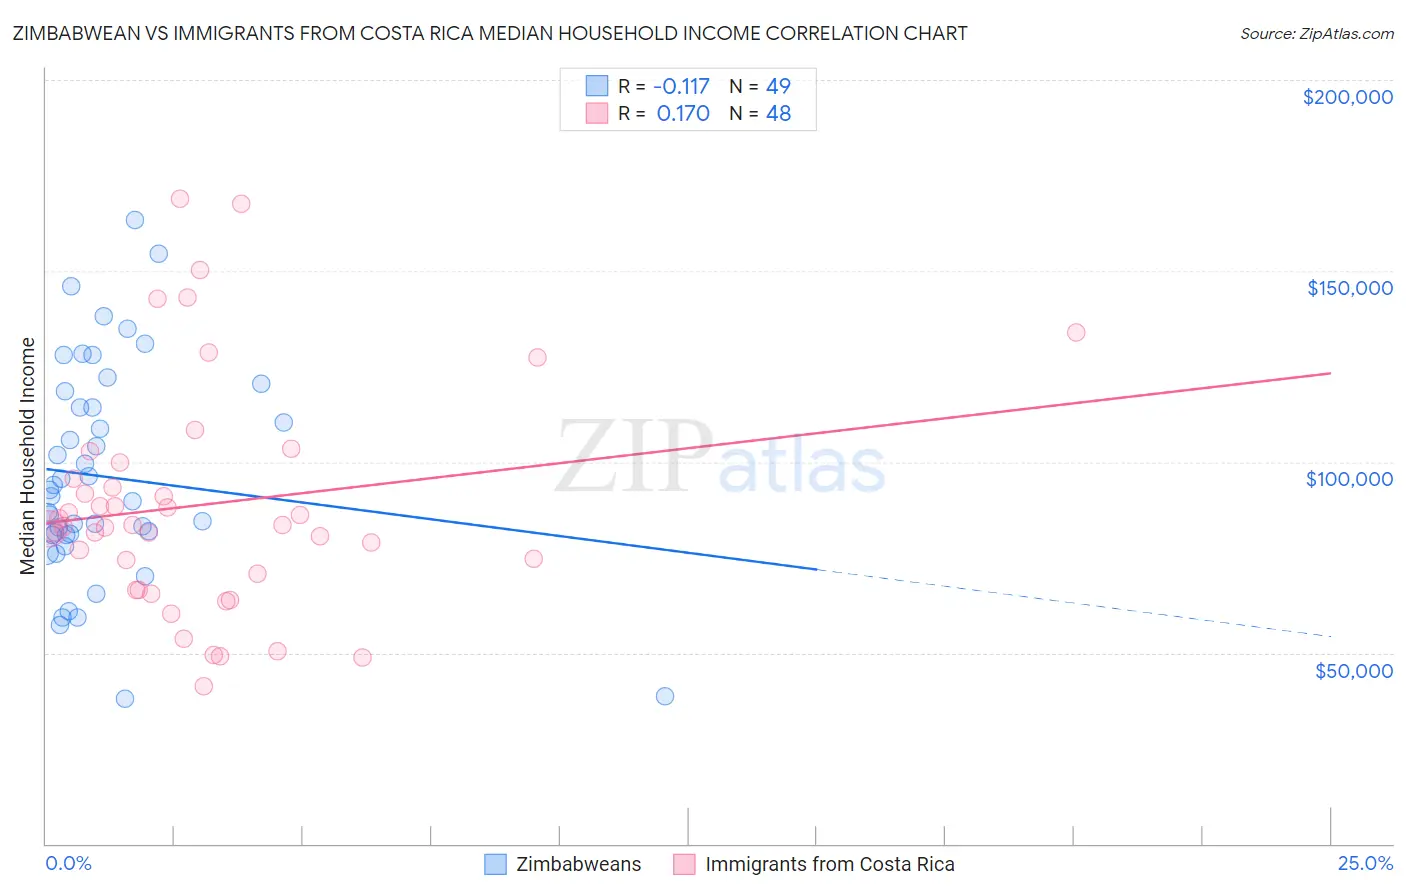
Zimbabwean vs Immigrants from Costa Rica Median Household Income Correlation Chart
The statistical analysis conducted on geographies consisting of 69,185,411 people shows a poor negative correlation between the proportion of Zimbabweans and median household income in the United States with a correlation coefficient (R) of -0.117 and weighted average of $90,618. Similarly, the statistical analysis conducted on geographies consisting of 204,222,655 people shows a poor positive correlation between the proportion of Immigrants from Costa Rica and median household income in the United States with a correlation coefficient (R) of 0.170 and weighted average of $85,054, a difference of 6.5%.
Median Household Income Correlation Summary
| Measurement | Zimbabwean | Immigrants from Costa Rica |
| Minimum | $38,056 | $41,250 |
| Maximum | $163,274 | $168,837 |
| Range | $125,218 | $127,587 |
| Mean | $96,050 | $88,867 |
| Median | $90,998 | $83,191 |
| Interquartile 25% (IQ1) | $80,817 | $68,706 |
| Interquartile 75% (IQ3) | $116,275 | $97,715 |
| Interquartile Range (IQR) | $35,458 | $29,008 |
| Standard Deviation (Sample) | $28,116 | $30,266 |
| Standard Deviation (Population) | $27,827 | $29,949 |
Similar Demographics by Median Household Income
Demographics Similar to Zimbabweans by Median Household Income
In terms of median household income, the demographic groups most similar to Zimbabweans are Chilean ($90,605, a difference of 0.020%), Palestinian ($90,574, a difference of 0.050%), Croatian ($90,685, a difference of 0.070%), Immigrants from Poland ($90,549, a difference of 0.080%), and Macedonian ($90,761, a difference of 0.16%).
| Demographics | Rating | Rank | Median Household Income |
| Immigrants | Moldova | 98.3 /100 | #101 | Exceptional $91,446 |
| Austrians | 98.2 /100 | #102 | Exceptional $91,339 |
| Immigrants | Ukraine | 98.0 /100 | #103 | Exceptional $91,124 |
| Immigrants | Kazakhstan | 97.8 /100 | #104 | Exceptional $91,015 |
| Immigrants | Brazil | 97.7 /100 | #105 | Exceptional $90,907 |
| Macedonians | 97.4 /100 | #106 | Exceptional $90,761 |
| Croatians | 97.3 /100 | #107 | Exceptional $90,685 |
| Zimbabweans | 97.2 /100 | #108 | Exceptional $90,618 |
| Chileans | 97.2 /100 | #109 | Exceptional $90,605 |
| Palestinians | 97.1 /100 | #110 | Exceptional $90,574 |
| Immigrants | Poland | 97.1 /100 | #111 | Exceptional $90,549 |
| Northern Europeans | 96.9 /100 | #112 | Exceptional $90,446 |
| Peruvians | 96.5 /100 | #113 | Exceptional $90,261 |
| Immigrants | Northern Africa | 95.9 /100 | #114 | Exceptional $90,026 |
| Immigrants | Western Asia | 95.9 /100 | #115 | Exceptional $90,005 |
Demographics Similar to Immigrants from Costa Rica by Median Household Income
In terms of median household income, the demographic groups most similar to Immigrants from Costa Rica are Alsatian ($85,053, a difference of 0.0%), Immigrants from Eritrea ($85,025, a difference of 0.030%), Scottish ($85,101, a difference of 0.050%), Czechoslovakian ($84,965, a difference of 0.10%), and English ($84,915, a difference of 0.16%).
| Demographics | Rating | Rank | Median Household Income |
| Icelanders | 61.0 /100 | #168 | Good $85,797 |
| Colombians | 59.7 /100 | #169 | Average $85,716 |
| Swiss | 59.2 /100 | #170 | Average $85,681 |
| Immigrants | South America | 58.1 /100 | #171 | Average $85,611 |
| Slovenes | 57.4 /100 | #172 | Average $85,562 |
| Immigrants | Cameroon | 53.4 /100 | #173 | Average $85,314 |
| Scottish | 50.0 /100 | #174 | Average $85,101 |
| Immigrants | Costa Rica | 49.2 /100 | #175 | Average $85,054 |
| Alsatians | 49.2 /100 | #176 | Average $85,053 |
| Immigrants | Eritrea | 48.8 /100 | #177 | Average $85,025 |
| Czechoslovakians | 47.8 /100 | #178 | Average $84,965 |
| English | 47.0 /100 | #179 | Average $84,915 |
| Immigrants | Portugal | 44.2 /100 | #180 | Average $84,740 |
| Hawaiians | 44.1 /100 | #181 | Average $84,729 |
| Uruguayans | 43.5 /100 | #182 | Average $84,691 |