Zimbabwean vs Colombian Per Capita Income
COMPARE
Zimbabwean
Colombian
Per Capita Income
Per Capita Income Comparison
Zimbabweans
Colombians
$45,804
PER CAPITA INCOME
91.7/ 100
METRIC RATING
125th/ 347
METRIC RANK
$43,661
PER CAPITA INCOME
50.0/ 100
METRIC RATING
174th/ 347
METRIC RANK
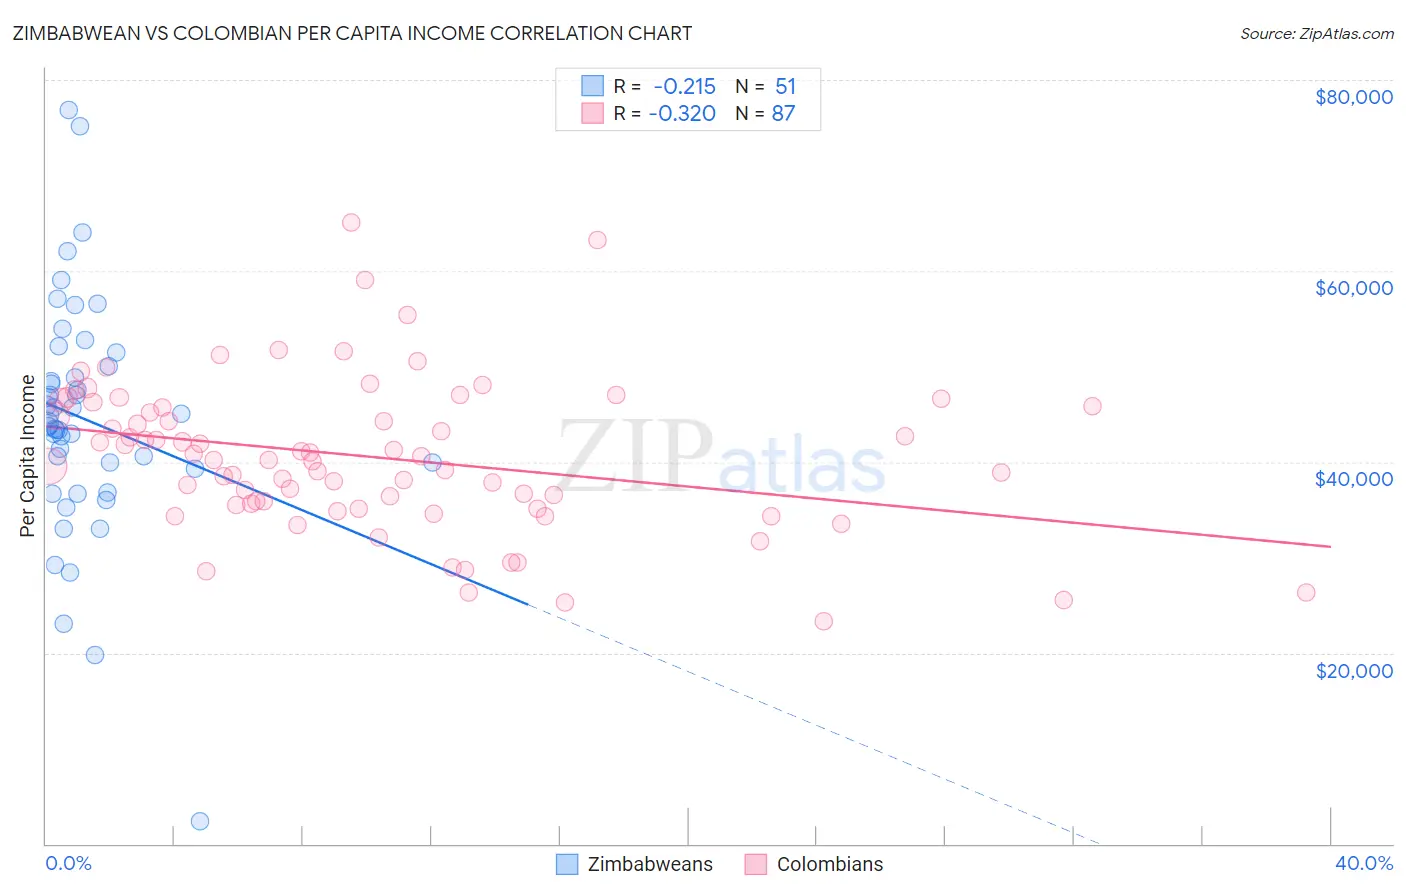
Zimbabwean vs Colombian Per Capita Income Correlation Chart
The statistical analysis conducted on geographies consisting of 69,200,621 people shows a weak negative correlation between the proportion of Zimbabweans and per capita income in the United States with a correlation coefficient (R) of -0.215 and weighted average of $45,804. Similarly, the statistical analysis conducted on geographies consisting of 419,718,902 people shows a mild negative correlation between the proportion of Colombians and per capita income in the United States with a correlation coefficient (R) of -0.320 and weighted average of $43,661, a difference of 4.9%.
Per Capita Income Correlation Summary
| Measurement | Zimbabwean | Colombian |
| Minimum | $2,302 | $23,272 |
| Maximum | $76,842 | $65,011 |
| Range | $74,540 | $41,739 |
| Mean | $44,445 | $40,509 |
| Median | $44,038 | $40,249 |
| Interquartile 25% (IQ1) | $39,330 | $35,498 |
| Interquartile 75% (IQ3) | $50,052 | $45,774 |
| Interquartile Range (IQR) | $10,722 | $10,276 |
| Standard Deviation (Sample) | $12,469 | $7,993 |
| Standard Deviation (Population) | $12,346 | $7,947 |
Similar Demographics by Per Capita Income
Demographics Similar to Zimbabweans by Per Capita Income
In terms of per capita income, the demographic groups most similar to Zimbabweans are Palestinian ($45,790, a difference of 0.030%), European ($45,836, a difference of 0.070%), Lebanese ($45,840, a difference of 0.080%), Moroccan ($45,854, a difference of 0.11%), and Canadian ($45,858, a difference of 0.12%).
| Demographics | Rating | Rank | Per Capita Income |
| Immigrants | Saudi Arabia | 93.3 /100 | #118 | Exceptional $46,008 |
| Immigrants | Poland | 93.1 /100 | #119 | Exceptional $45,979 |
| Immigrants | Ethiopia | 92.7 /100 | #120 | Exceptional $45,923 |
| Canadians | 92.2 /100 | #121 | Exceptional $45,858 |
| Moroccans | 92.1 /100 | #122 | Exceptional $45,854 |
| Lebanese | 92.0 /100 | #123 | Exceptional $45,840 |
| Europeans | 92.0 /100 | #124 | Exceptional $45,836 |
| Zimbabweans | 91.7 /100 | #125 | Exceptional $45,804 |
| Palestinians | 91.6 /100 | #126 | Exceptional $45,790 |
| Immigrants | Germany | 91.3 /100 | #127 | Exceptional $45,751 |
| Swedes | 91.3 /100 | #128 | Exceptional $45,750 |
| Luxembourgers | 90.4 /100 | #129 | Exceptional $45,663 |
| Arabs | 90.4 /100 | #130 | Exceptional $45,662 |
| Immigrants | North Macedonia | 90.0 /100 | #131 | Exceptional $45,622 |
| Jordanians | 89.9 /100 | #132 | Excellent $45,605 |
Demographics Similar to Colombians by Per Capita Income
In terms of per capita income, the demographic groups most similar to Colombians are French ($43,685, a difference of 0.060%), Celtic ($43,621, a difference of 0.090%), Immigrants from South Eastern Asia ($43,539, a difference of 0.28%), Czechoslovakian ($43,806, a difference of 0.33%), and Tlingit-Haida ($43,516, a difference of 0.33%).
| Demographics | Rating | Rank | Per Capita Income |
| English | 58.9 /100 | #167 | Average $43,982 |
| Belgians | 58.1 /100 | #168 | Average $43,951 |
| Immigrants | Peru | 55.3 /100 | #169 | Average $43,852 |
| Scandinavians | 55.2 /100 | #170 | Average $43,848 |
| Immigrants | Eastern Africa | 54.9 /100 | #171 | Average $43,838 |
| Czechoslovakians | 54.1 /100 | #172 | Average $43,806 |
| French | 50.7 /100 | #173 | Average $43,685 |
| Colombians | 50.0 /100 | #174 | Average $43,661 |
| Celtics | 48.9 /100 | #175 | Average $43,621 |
| Immigrants | South Eastern Asia | 46.6 /100 | #176 | Average $43,539 |
| Tlingit-Haida | 45.9 /100 | #177 | Average $43,516 |
| Immigrants | Costa Rica | 44.5 /100 | #178 | Average $43,464 |
| Finns | 44.4 /100 | #179 | Average $43,461 |
| Sierra Leoneans | 42.9 /100 | #180 | Average $43,405 |
| Welsh | 38.2 /100 | #181 | Fair $43,233 |