Yup'ik vs Scandinavian Median Male Earnings
COMPARE
Yup'ik
Scandinavian
Median Male Earnings
Median Male Earnings Comparison
Yup'ik
Scandinavians
$39,504
MEDIAN MALE EARNINGS
0.0/ 100
METRIC RATING
347th/ 347
METRIC RANK
$55,527
MEDIAN MALE EARNINGS
73.4/ 100
METRIC RATING
155th/ 347
METRIC RANK
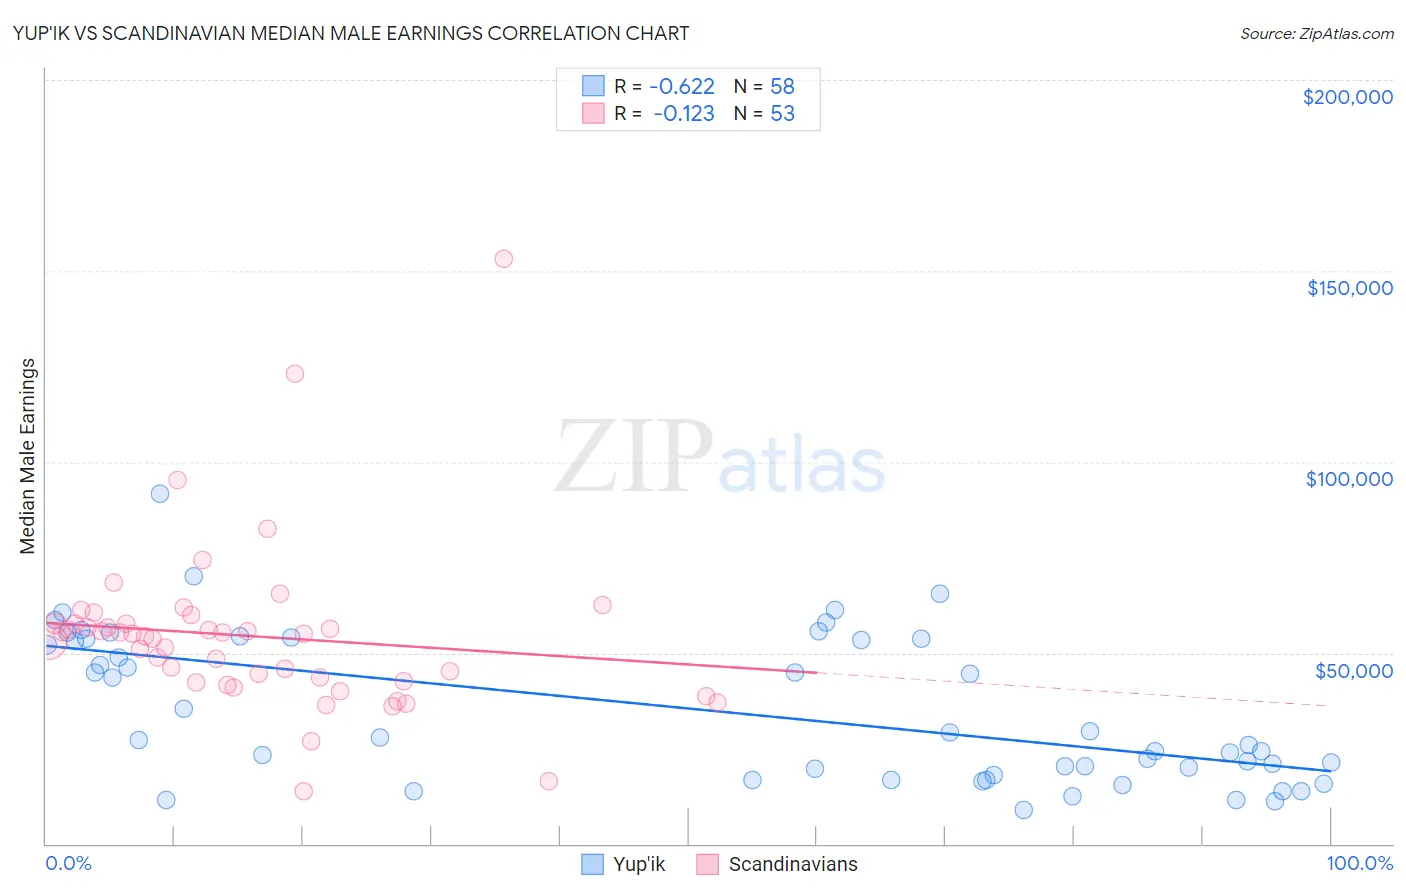
Yup'ik vs Scandinavian Median Male Earnings Correlation Chart
The statistical analysis conducted on geographies consisting of 39,949,304 people shows a significant negative correlation between the proportion of Yup'ik and median male earnings in the United States with a correlation coefficient (R) of -0.622 and weighted average of $39,504. Similarly, the statistical analysis conducted on geographies consisting of 472,245,233 people shows a poor negative correlation between the proportion of Scandinavians and median male earnings in the United States with a correlation coefficient (R) of -0.123 and weighted average of $55,527, a difference of 40.6%.
Median Male Earnings Correlation Summary
| Measurement | Yup'ik | Scandinavian |
| Minimum | $8,859 | $13,865 |
| Maximum | $91,667 | $153,203 |
| Range | $82,808 | $139,338 |
| Mean | $35,016 | $54,403 |
| Median | $27,549 | $55,045 |
| Interquartile 25% (IQ1) | $18,125 | $42,380 |
| Interquartile 75% (IQ3) | $53,694 | $57,674 |
| Interquartile Range (IQR) | $35,569 | $15,293 |
| Standard Deviation (Sample) | $19,492 | $21,926 |
| Standard Deviation (Population) | $19,323 | $21,718 |
Similar Demographics by Median Male Earnings
Demographics Similar to Yup'ik by Median Male Earnings
In terms of median male earnings, the demographic groups most similar to Yup'ik are Tohono O'odham ($39,543, a difference of 0.10%), Puerto Rican ($40,071, a difference of 1.4%), Pueblo ($41,314, a difference of 4.6%), Lumbee ($41,715, a difference of 5.6%), and Arapaho ($41,758, a difference of 5.7%).
| Demographics | Rating | Rank | Median Male Earnings |
| Immigrants | Congo | 0.0 /100 | #333 | Tragic $44,204 |
| Immigrants | Yemen | 0.0 /100 | #334 | Tragic $44,083 |
| Spanish American Indians | 0.0 /100 | #335 | Tragic $44,010 |
| Immigrants | Cuba | 0.0 /100 | #336 | Tragic $43,461 |
| Menominee | 0.0 /100 | #337 | Tragic $42,581 |
| Crow | 0.0 /100 | #338 | Tragic $42,434 |
| Pima | 0.0 /100 | #339 | Tragic $42,357 |
| Navajo | 0.0 /100 | #340 | Tragic $42,098 |
| Hopi | 0.0 /100 | #341 | Tragic $42,060 |
| Arapaho | 0.0 /100 | #342 | Tragic $41,758 |
| Lumbee | 0.0 /100 | #343 | Tragic $41,715 |
| Pueblo | 0.0 /100 | #344 | Tragic $41,314 |
| Puerto Ricans | 0.0 /100 | #345 | Tragic $40,071 |
| Tohono O'odham | 0.0 /100 | #346 | Tragic $39,543 |
| Yup'ik | 0.0 /100 | #347 | Tragic $39,504 |
Demographics Similar to Scandinavians by Median Male Earnings
In terms of median male earnings, the demographic groups most similar to Scandinavians are Taiwanese ($55,556, a difference of 0.050%), Immigrants from Nepal ($55,615, a difference of 0.16%), Immigrants from Ethiopia ($55,434, a difference of 0.17%), Icelander ($55,415, a difference of 0.20%), and Peruvian ($55,659, a difference of 0.24%).
| Demographics | Rating | Rank | Median Male Earnings |
| Scottish | 78.2 /100 | #148 | Good $55,793 |
| English | 77.4 /100 | #149 | Good $55,747 |
| Swiss | 77.1 /100 | #150 | Good $55,731 |
| Immigrants | Oceania | 76.8 /100 | #151 | Good $55,712 |
| Peruvians | 75.8 /100 | #152 | Good $55,659 |
| Immigrants | Nepal | 75.0 /100 | #153 | Good $55,615 |
| Taiwanese | 73.9 /100 | #154 | Good $55,556 |
| Scandinavians | 73.4 /100 | #155 | Good $55,527 |
| Immigrants | Ethiopia | 71.6 /100 | #156 | Good $55,434 |
| Icelanders | 71.2 /100 | #157 | Good $55,415 |
| Czechoslovakians | 70.5 /100 | #158 | Good $55,382 |
| Alsatians | 70.5 /100 | #159 | Good $55,380 |
| Basques | 70.3 /100 | #160 | Good $55,370 |
| Belgians | 70.1 /100 | #161 | Good $55,361 |
| French | 69.9 /100 | #162 | Good $55,350 |