Yup'ik vs Immigrants from Jamaica Median Male Earnings
COMPARE
Yup'ik
Immigrants from Jamaica
Median Male Earnings
Median Male Earnings Comparison
Yup'ik
Immigrants from Jamaica
$39,504
MEDIAN MALE EARNINGS
0.0/ 100
METRIC RATING
347th/ 347
METRIC RANK
$48,040
MEDIAN MALE EARNINGS
0.2/ 100
METRIC RATING
283rd/ 347
METRIC RANK
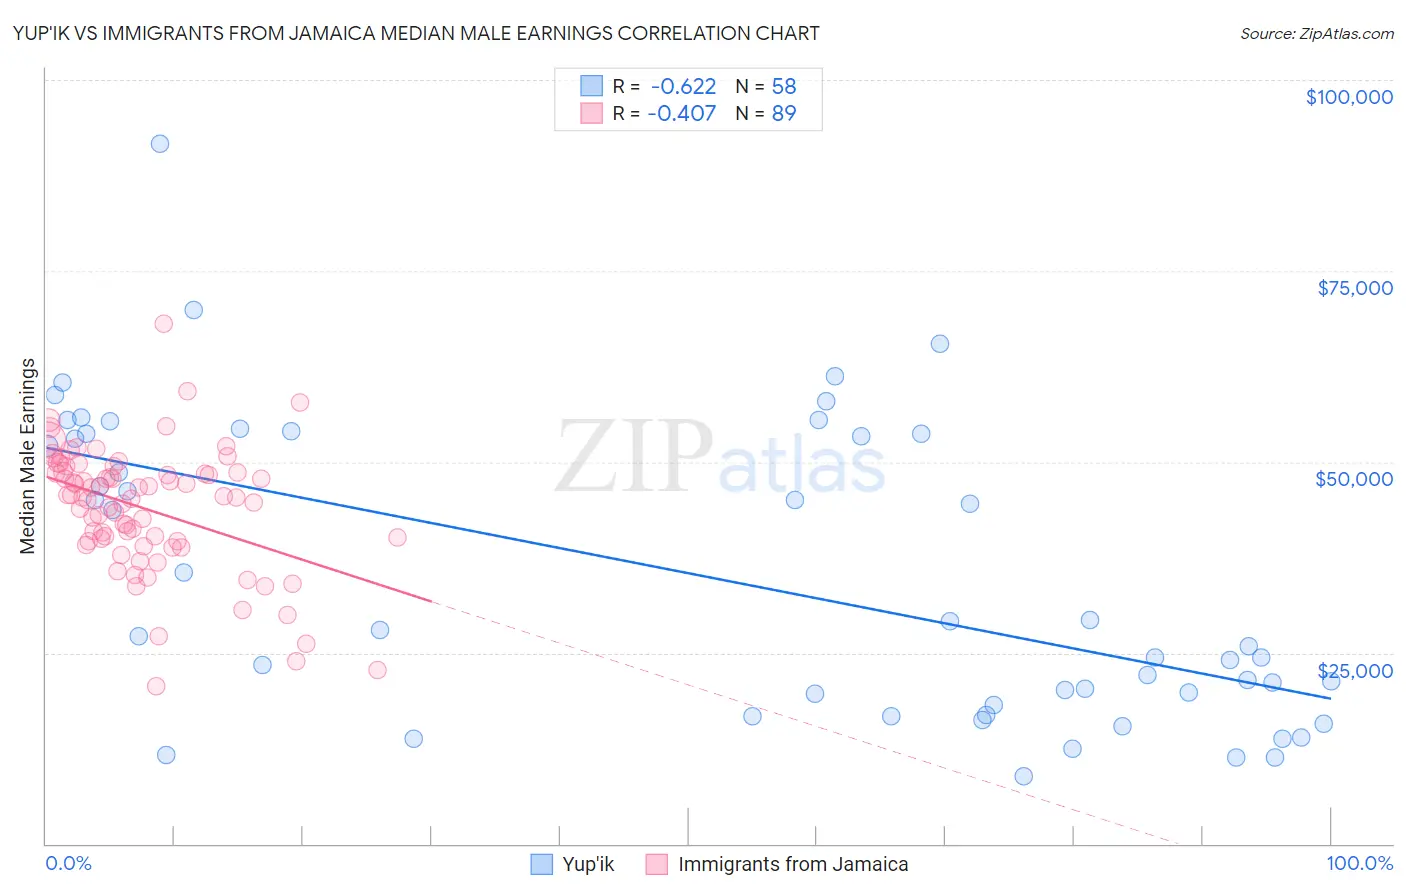
Yup'ik vs Immigrants from Jamaica Median Male Earnings Correlation Chart
The statistical analysis conducted on geographies consisting of 39,949,304 people shows a significant negative correlation between the proportion of Yup'ik and median male earnings in the United States with a correlation coefficient (R) of -0.622 and weighted average of $39,504. Similarly, the statistical analysis conducted on geographies consisting of 301,762,663 people shows a moderate negative correlation between the proportion of Immigrants from Jamaica and median male earnings in the United States with a correlation coefficient (R) of -0.407 and weighted average of $48,040, a difference of 21.6%.
Median Male Earnings Correlation Summary
| Measurement | Yup'ik | Immigrants from Jamaica |
| Minimum | $8,859 | $20,648 |
| Maximum | $91,667 | $68,125 |
| Range | $82,808 | $47,477 |
| Mean | $35,016 | $43,924 |
| Median | $27,549 | $45,397 |
| Interquartile 25% (IQ1) | $18,125 | $39,601 |
| Interquartile 75% (IQ3) | $53,694 | $48,697 |
| Interquartile Range (IQR) | $35,569 | $9,096 |
| Standard Deviation (Sample) | $19,492 | $8,088 |
| Standard Deviation (Population) | $19,323 | $8,042 |
Similar Demographics by Median Male Earnings
Demographics Similar to Yup'ik by Median Male Earnings
In terms of median male earnings, the demographic groups most similar to Yup'ik are Tohono O'odham ($39,543, a difference of 0.10%), Puerto Rican ($40,071, a difference of 1.4%), Pueblo ($41,314, a difference of 4.6%), Lumbee ($41,715, a difference of 5.6%), and Arapaho ($41,758, a difference of 5.7%).
| Demographics | Rating | Rank | Median Male Earnings |
| Immigrants | Congo | 0.0 /100 | #333 | Tragic $44,204 |
| Immigrants | Yemen | 0.0 /100 | #334 | Tragic $44,083 |
| Spanish American Indians | 0.0 /100 | #335 | Tragic $44,010 |
| Immigrants | Cuba | 0.0 /100 | #336 | Tragic $43,461 |
| Menominee | 0.0 /100 | #337 | Tragic $42,581 |
| Crow | 0.0 /100 | #338 | Tragic $42,434 |
| Pima | 0.0 /100 | #339 | Tragic $42,357 |
| Navajo | 0.0 /100 | #340 | Tragic $42,098 |
| Hopi | 0.0 /100 | #341 | Tragic $42,060 |
| Arapaho | 0.0 /100 | #342 | Tragic $41,758 |
| Lumbee | 0.0 /100 | #343 | Tragic $41,715 |
| Pueblo | 0.0 /100 | #344 | Tragic $41,314 |
| Puerto Ricans | 0.0 /100 | #345 | Tragic $40,071 |
| Tohono O'odham | 0.0 /100 | #346 | Tragic $39,543 |
| Yup'ik | 0.0 /100 | #347 | Tragic $39,504 |
Demographics Similar to Immigrants from Jamaica by Median Male Earnings
In terms of median male earnings, the demographic groups most similar to Immigrants from Jamaica are African ($47,994, a difference of 0.090%), Paiute ($47,991, a difference of 0.10%), Mexican American Indian ($47,990, a difference of 0.10%), Central American ($48,093, a difference of 0.11%), and Immigrants from El Salvador ($47,973, a difference of 0.14%).
| Demographics | Rating | Rank | Median Male Earnings |
| Blackfeet | 0.3 /100 | #276 | Tragic $48,402 |
| Belizeans | 0.2 /100 | #277 | Tragic $48,358 |
| Immigrants | Liberia | 0.2 /100 | #278 | Tragic $48,317 |
| Hmong | 0.2 /100 | #279 | Tragic $48,254 |
| Comanche | 0.2 /100 | #280 | Tragic $48,202 |
| Marshallese | 0.2 /100 | #281 | Tragic $48,137 |
| Central Americans | 0.2 /100 | #282 | Tragic $48,093 |
| Immigrants | Jamaica | 0.2 /100 | #283 | Tragic $48,040 |
| Africans | 0.2 /100 | #284 | Tragic $47,994 |
| Paiute | 0.2 /100 | #285 | Tragic $47,991 |
| Mexican American Indians | 0.2 /100 | #286 | Tragic $47,990 |
| Immigrants | El Salvador | 0.2 /100 | #287 | Tragic $47,973 |
| Shoshone | 0.2 /100 | #288 | Tragic $47,930 |
| Chickasaw | 0.1 /100 | #289 | Tragic $47,832 |
| Immigrants | Belize | 0.1 /100 | #290 | Tragic $47,809 |