White/Caucasian vs Puerto Rican Per Capita Income
COMPARE
White/Caucasian
Puerto Rican
Per Capita Income
Per Capita Income Comparison
Whites/Caucasians
Puerto Ricans
$42,180
PER CAPITA INCOME
15.9/ 100
METRIC RATING
205th/ 347
METRIC RANK
$31,268
PER CAPITA INCOME
0.0/ 100
METRIC RATING
341st/ 347
METRIC RANK
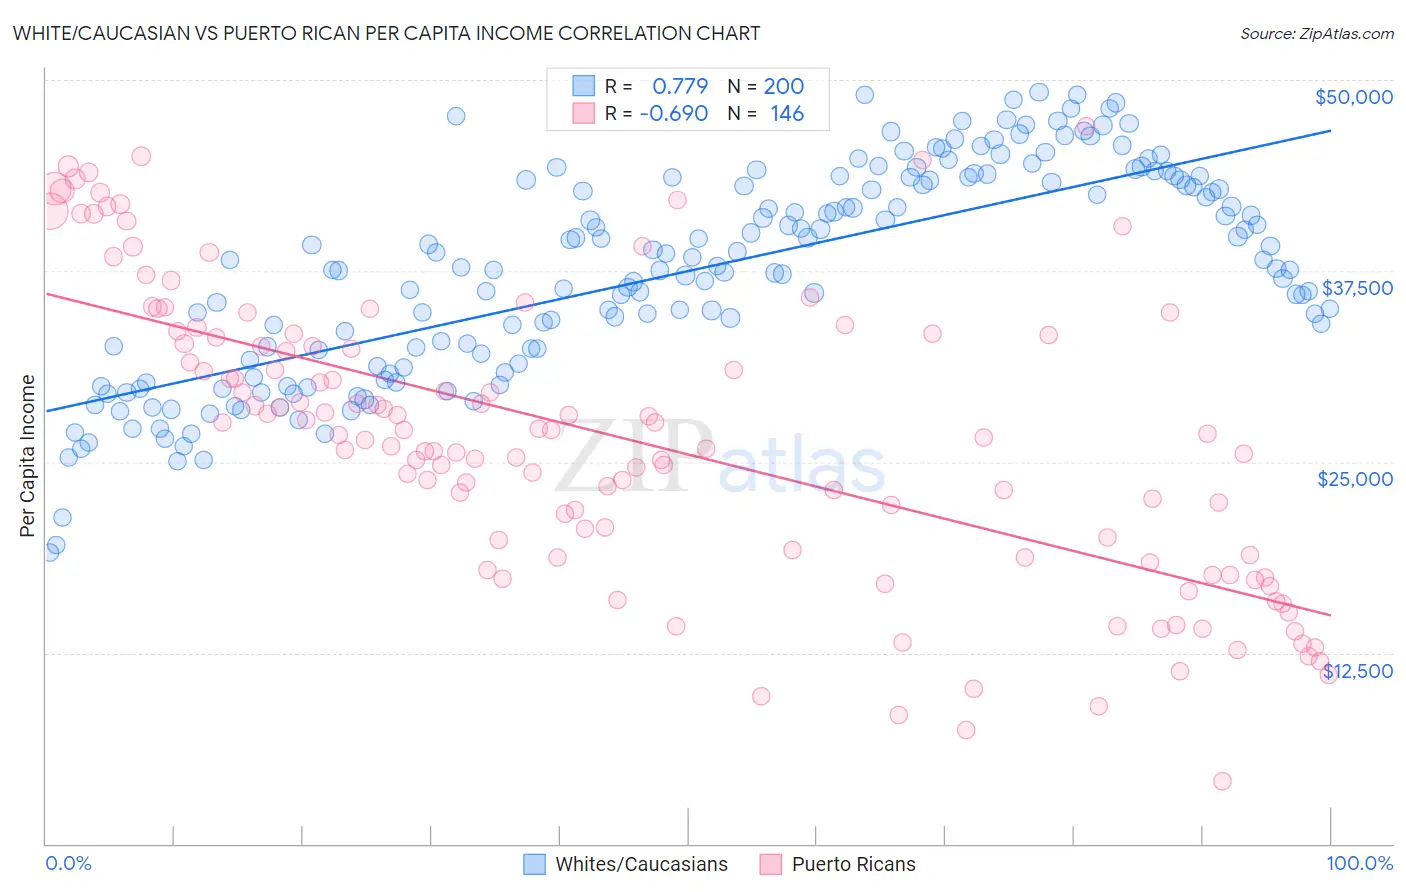
White/Caucasian vs Puerto Rican Per Capita Income Correlation Chart
The statistical analysis conducted on geographies consisting of 585,276,990 people shows a strong positive correlation between the proportion of Whites/Caucasians and per capita income in the United States with a correlation coefficient (R) of 0.779 and weighted average of $42,180. Similarly, the statistical analysis conducted on geographies consisting of 528,362,553 people shows a significant negative correlation between the proportion of Puerto Ricans and per capita income in the United States with a correlation coefficient (R) of -0.690 and weighted average of $31,268, a difference of 34.9%.
Per Capita Income Correlation Summary
| Measurement | White/Caucasian | Puerto Rican |
| Minimum | $19,081 | $4,085 |
| Maximum | $49,196 | $46,990 |
| Range | $30,115 | $42,905 |
| Mean | $37,504 | $26,618 |
| Median | $37,771 | $26,784 |
| Interquartile 25% (IQ1) | $31,862 | $18,902 |
| Interquartile 75% (IQ3) | $43,459 | $33,347 |
| Interquartile Range (IQR) | $11,597 | $14,444 |
| Standard Deviation (Sample) | $6,823 | $9,544 |
| Standard Deviation (Population) | $6,806 | $9,511 |
Similar Demographics by Per Capita Income
Demographics Similar to Whites/Caucasians by Per Capita Income
In terms of per capita income, the demographic groups most similar to Whites/Caucasians are Ghanaian ($42,164, a difference of 0.040%), Aleut ($42,210, a difference of 0.070%), Spanish ($42,249, a difference of 0.16%), Immigrants from Bosnia and Herzegovina ($42,278, a difference of 0.23%), and Venezuelan ($42,074, a difference of 0.25%).
| Demographics | Rating | Rank | Per Capita Income |
| Immigrants | Portugal | 19.7 /100 | #198 | Poor $42,412 |
| Barbadians | 19.6 /100 | #199 | Poor $42,406 |
| Vietnamese | 19.0 /100 | #200 | Poor $42,368 |
| Immigrants | Thailand | 17.6 /100 | #201 | Poor $42,289 |
| Immigrants | Bosnia and Herzegovina | 17.5 /100 | #202 | Poor $42,278 |
| Spanish | 17.0 /100 | #203 | Poor $42,249 |
| Aleuts | 16.4 /100 | #204 | Poor $42,210 |
| Whites/Caucasians | 15.9 /100 | #205 | Poor $42,180 |
| Ghanaians | 15.7 /100 | #206 | Poor $42,164 |
| Venezuelans | 14.4 /100 | #207 | Poor $42,074 |
| Panamanians | 13.9 /100 | #208 | Poor $42,035 |
| Immigrants | Sudan | 13.2 /100 | #209 | Poor $41,986 |
| Ecuadorians | 12.9 /100 | #210 | Poor $41,958 |
| Immigrants | Panama | 11.6 /100 | #211 | Poor $41,853 |
| Immigrants | Senegal | 11.3 /100 | #212 | Poor $41,830 |
Demographics Similar to Puerto Ricans by Per Capita Income
In terms of per capita income, the demographic groups most similar to Puerto Ricans are Hopi ($31,177, a difference of 0.29%), Crow ($31,729, a difference of 1.5%), Pima ($30,644, a difference of 2.0%), Pueblo ($32,012, a difference of 2.4%), and Yup'ik ($30,518, a difference of 2.5%).
| Demographics | Rating | Rank | Per Capita Income |
| Immigrants | Yemen | 0.0 /100 | #333 | Tragic $33,696 |
| Natives/Alaskans | 0.0 /100 | #334 | Tragic $33,279 |
| Yuman | 0.0 /100 | #335 | Tragic $33,236 |
| Yakama | 0.0 /100 | #336 | Tragic $33,009 |
| Houma | 0.0 /100 | #337 | Tragic $32,996 |
| Arapaho | 0.0 /100 | #338 | Tragic $32,345 |
| Pueblo | 0.0 /100 | #339 | Tragic $32,012 |
| Crow | 0.0 /100 | #340 | Tragic $31,729 |
| Puerto Ricans | 0.0 /100 | #341 | Tragic $31,268 |
| Hopi | 0.0 /100 | #342 | Tragic $31,177 |
| Pima | 0.0 /100 | #343 | Tragic $30,644 |
| Yup'ik | 0.0 /100 | #344 | Tragic $30,518 |
| Tohono O'odham | 0.0 /100 | #345 | Tragic $30,256 |
| Lumbee | 0.0 /100 | #346 | Tragic $29,845 |
| Navajo | 0.0 /100 | #347 | Tragic $29,031 |