Immigrants from Western Africa vs Puerto Rican Per Capita Income
COMPARE
Immigrants from Western Africa
Puerto Rican
Per Capita Income
Per Capita Income Comparison
Immigrants from Western Africa
Puerto Ricans
$40,294
PER CAPITA INCOME
2.2/ 100
METRIC RATING
242nd/ 347
METRIC RANK
$31,268
PER CAPITA INCOME
0.0/ 100
METRIC RATING
341st/ 347
METRIC RANK
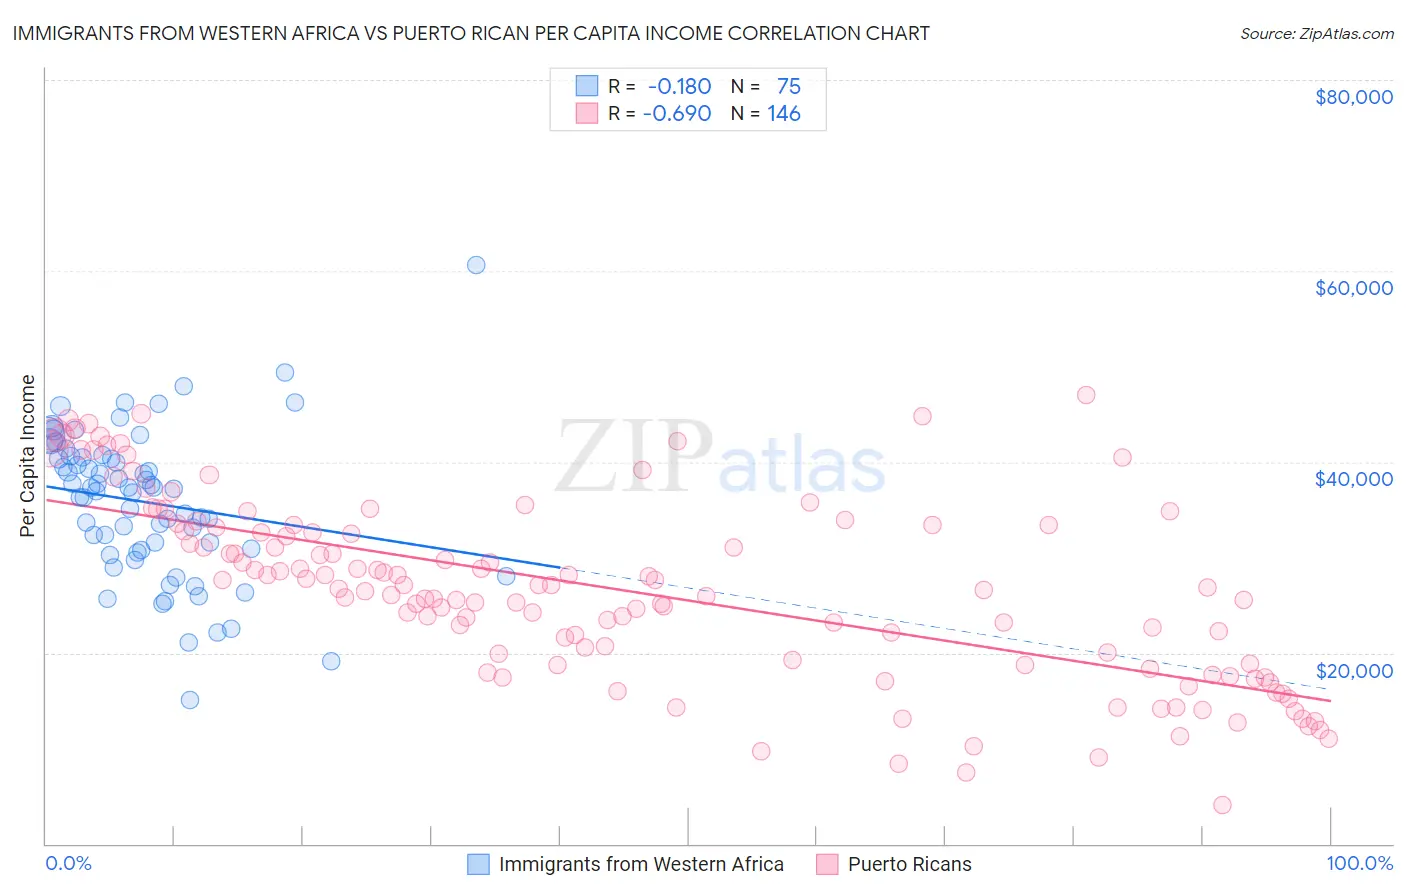
Immigrants from Western Africa vs Puerto Rican Per Capita Income Correlation Chart
The statistical analysis conducted on geographies consisting of 357,903,871 people shows a poor negative correlation between the proportion of Immigrants from Western Africa and per capita income in the United States with a correlation coefficient (R) of -0.180 and weighted average of $40,294. Similarly, the statistical analysis conducted on geographies consisting of 528,362,553 people shows a significant negative correlation between the proportion of Puerto Ricans and per capita income in the United States with a correlation coefficient (R) of -0.690 and weighted average of $31,268, a difference of 28.9%.
Per Capita Income Correlation Summary
| Measurement | Immigrants from Western Africa | Puerto Rican |
| Minimum | $15,041 | $4,085 |
| Maximum | $60,586 | $46,990 |
| Range | $45,545 | $42,905 |
| Mean | $35,763 | $26,618 |
| Median | $37,211 | $26,784 |
| Interquartile 25% (IQ1) | $30,829 | $18,902 |
| Interquartile 75% (IQ3) | $40,508 | $33,347 |
| Interquartile Range (IQR) | $9,679 | $14,444 |
| Standard Deviation (Sample) | $7,739 | $9,544 |
| Standard Deviation (Population) | $7,688 | $9,511 |
Similar Demographics by Per Capita Income
Demographics Similar to Immigrants from Western Africa by Per Capita Income
In terms of per capita income, the demographic groups most similar to Immigrants from Western Africa are German Russian ($40,266, a difference of 0.070%), British West Indian ($40,330, a difference of 0.090%), Immigrants from Nigeria ($40,339, a difference of 0.11%), Tsimshian ($40,344, a difference of 0.12%), and French American Indian ($40,244, a difference of 0.13%).
| Demographics | Rating | Rank | Per Capita Income |
| Immigrants | Guyana | 3.6 /100 | #235 | Tragic $40,742 |
| Immigrants | Nonimmigrants | 3.4 /100 | #236 | Tragic $40,669 |
| Immigrants | Cambodia | 2.6 /100 | #237 | Tragic $40,434 |
| Somalis | 2.4 /100 | #238 | Tragic $40,367 |
| Tsimshian | 2.4 /100 | #239 | Tragic $40,344 |
| Immigrants | Nigeria | 2.3 /100 | #240 | Tragic $40,339 |
| British West Indians | 2.3 /100 | #241 | Tragic $40,330 |
| Immigrants | Western Africa | 2.2 /100 | #242 | Tragic $40,294 |
| German Russians | 2.2 /100 | #243 | Tragic $40,266 |
| French American Indians | 2.1 /100 | #244 | Tragic $40,244 |
| Sub-Saharan Africans | 1.9 /100 | #245 | Tragic $40,152 |
| Cree | 1.7 /100 | #246 | Tragic $40,056 |
| Immigrants | Somalia | 1.6 /100 | #247 | Tragic $39,974 |
| Cape Verdeans | 1.5 /100 | #248 | Tragic $39,935 |
| Japanese | 1.4 /100 | #249 | Tragic $39,870 |
Demographics Similar to Puerto Ricans by Per Capita Income
In terms of per capita income, the demographic groups most similar to Puerto Ricans are Hopi ($31,177, a difference of 0.29%), Crow ($31,729, a difference of 1.5%), Pima ($30,644, a difference of 2.0%), Pueblo ($32,012, a difference of 2.4%), and Yup'ik ($30,518, a difference of 2.5%).
| Demographics | Rating | Rank | Per Capita Income |
| Immigrants | Yemen | 0.0 /100 | #333 | Tragic $33,696 |
| Natives/Alaskans | 0.0 /100 | #334 | Tragic $33,279 |
| Yuman | 0.0 /100 | #335 | Tragic $33,236 |
| Yakama | 0.0 /100 | #336 | Tragic $33,009 |
| Houma | 0.0 /100 | #337 | Tragic $32,996 |
| Arapaho | 0.0 /100 | #338 | Tragic $32,345 |
| Pueblo | 0.0 /100 | #339 | Tragic $32,012 |
| Crow | 0.0 /100 | #340 | Tragic $31,729 |
| Puerto Ricans | 0.0 /100 | #341 | Tragic $31,268 |
| Hopi | 0.0 /100 | #342 | Tragic $31,177 |
| Pima | 0.0 /100 | #343 | Tragic $30,644 |
| Yup'ik | 0.0 /100 | #344 | Tragic $30,518 |
| Tohono O'odham | 0.0 /100 | #345 | Tragic $30,256 |
| Lumbee | 0.0 /100 | #346 | Tragic $29,845 |
| Navajo | 0.0 /100 | #347 | Tragic $29,031 |