White/Caucasian vs Immigrants from Kenya Householder Income Ages 45 - 64 years
COMPARE
White/Caucasian
Immigrants from Kenya
Householder Income Ages 45 - 64 years
Householder Income Ages 45 - 64 years Comparison
Whites/Caucasians
Immigrants from Kenya
$98,091
HOUSEHOLDER INCOME AGES 45 - 64 YEARS
24.6/ 100
METRIC RATING
199th/ 347
METRIC RANK
$97,964
HOUSEHOLDER INCOME AGES 45 - 64 YEARS
23.5/ 100
METRIC RATING
200th/ 347
METRIC RANK
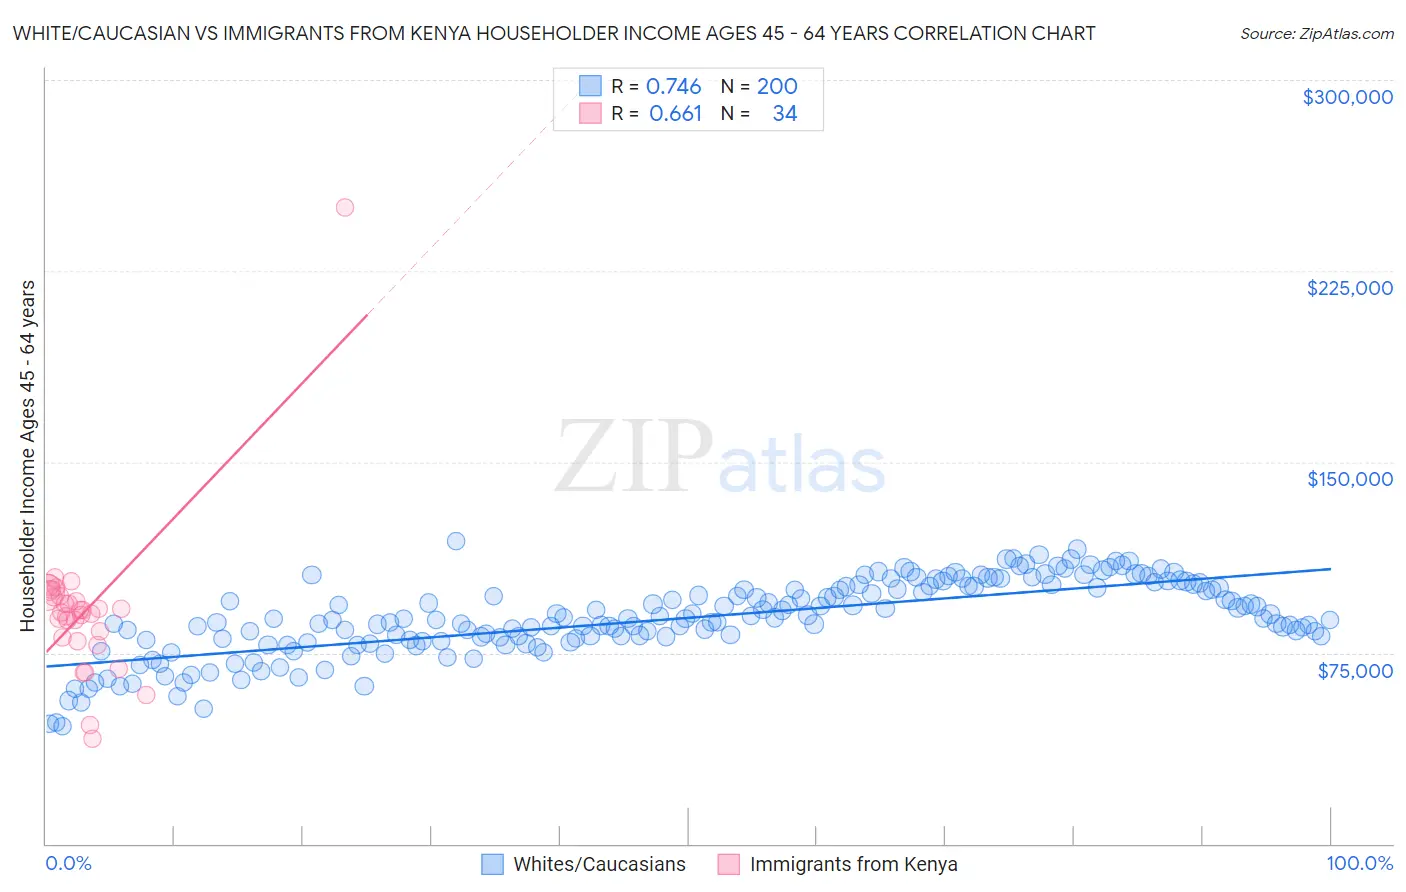
White/Caucasian vs Immigrants from Kenya Householder Income Ages 45 - 64 years Correlation Chart
The statistical analysis conducted on geographies consisting of 579,240,232 people shows a strong positive correlation between the proportion of Whites/Caucasians and household income with householder between the ages 45 and 64 in the United States with a correlation coefficient (R) of 0.746 and weighted average of $98,091. Similarly, the statistical analysis conducted on geographies consisting of 217,894,820 people shows a significant positive correlation between the proportion of Immigrants from Kenya and household income with householder between the ages 45 and 64 in the United States with a correlation coefficient (R) of 0.661 and weighted average of $97,964, a difference of 0.13%.
Householder Income Ages 45 - 64 years Correlation Summary
| Measurement | White/Caucasian | Immigrants from Kenya |
| Minimum | $46,068 | $41,343 |
| Maximum | $118,717 | $250,001 |
| Range | $72,649 | $208,658 |
| Mean | $88,743 | $91,195 |
| Median | $88,408 | $91,314 |
| Interquartile 25% (IQ1) | $80,288 | $80,833 |
| Interquartile 75% (IQ3) | $101,075 | $97,063 |
| Interquartile Range (IQR) | $20,787 | $16,231 |
| Standard Deviation (Sample) | $14,868 | $31,961 |
| Standard Deviation (Population) | $14,830 | $31,487 |
Demographics Similar to Whites/Caucasians and Immigrants from Kenya by Householder Income Ages 45 - 64 years
In terms of householder income ages 45 - 64 years, the demographic groups most similar to Whites/Caucasians are Immigrants from Iraq ($98,201, a difference of 0.11%), Puget Sound Salish ($98,340, a difference of 0.25%), Immigrants from Eastern Africa ($98,467, a difference of 0.38%), Spanish ($98,554, a difference of 0.47%), and Yugoslavian ($97,558, a difference of 0.55%). Similarly, the demographic groups most similar to Immigrants from Kenya are Immigrants from Iraq ($98,201, a difference of 0.24%), Puget Sound Salish ($98,340, a difference of 0.38%), Yugoslavian ($97,558, a difference of 0.42%), Immigrants from Eastern Africa ($98,467, a difference of 0.51%), and Tlingit-Haida ($97,417, a difference of 0.56%).
| Demographics | Rating | Rank | Householder Income Ages 45 - 64 years |
| Immigrants | South America | 35.4 /100 | #189 | Fair $99,126 |
| French Canadians | 35.1 /100 | #190 | Fair $99,093 |
| Kenyans | 33.7 /100 | #191 | Fair $98,970 |
| Celtics | 32.9 /100 | #192 | Fair $98,896 |
| Hawaiians | 31.6 /100 | #193 | Fair $98,778 |
| Uruguayans | 30.3 /100 | #194 | Fair $98,660 |
| Spanish | 29.2 /100 | #195 | Fair $98,554 |
| Immigrants | Eastern Africa | 28.3 /100 | #196 | Fair $98,467 |
| Puget Sound Salish | 27.0 /100 | #197 | Fair $98,340 |
| Immigrants | Iraq | 25.7 /100 | #198 | Fair $98,201 |
| Whites/Caucasians | 24.6 /100 | #199 | Fair $98,091 |
| Immigrants | Kenya | 23.5 /100 | #200 | Fair $97,964 |
| Yugoslavians | 20.0 /100 | #201 | Fair $97,558 |
| Tlingit-Haida | 18.9 /100 | #202 | Poor $97,417 |
| Immigrants | Thailand | 18.8 /100 | #203 | Poor $97,400 |
| Immigrants | Eritrea | 18.6 /100 | #204 | Poor $97,373 |
| Immigrants | Colombia | 18.0 /100 | #205 | Poor $97,290 |
| Immigrants | Africa | 17.9 /100 | #206 | Poor $97,284 |
| Ghanaians | 17.9 /100 | #207 | Poor $97,277 |
| Scotch-Irish | 16.4 /100 | #208 | Poor $97,073 |
| Japanese | 14.8 /100 | #209 | Poor $96,834 |