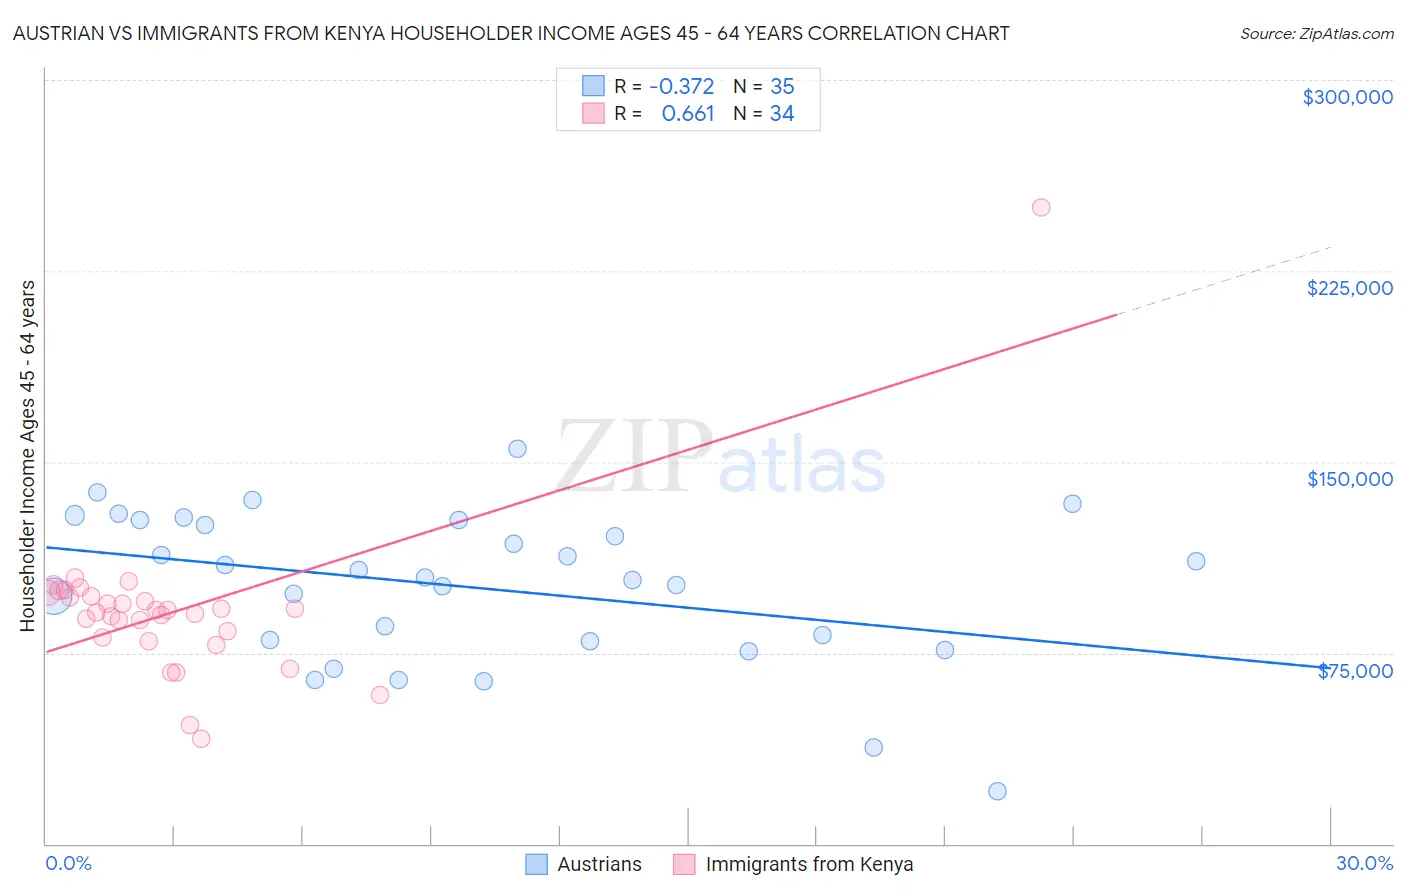
Austrian vs Immigrants from Kenya Householder Income Ages 45 - 64 years
COMPARE
Austrian
Immigrants from Kenya
Householder Income Ages 45 - 64 years
Householder Income Ages 45 - 64 years Comparison
Austrians
Immigrants from Kenya
$108,692
HOUSEHOLDER INCOME AGES 45 - 64 YEARS
98.5/ 100
METRIC RATING
86th/ 347
METRIC RANK
$97,964
HOUSEHOLDER INCOME AGES 45 - 64 YEARS
23.5/ 100
METRIC RATING
200th/ 347
METRIC RANK
Austrian vs Immigrants from Kenya Householder Income Ages 45 - 64 years Correlation Chart
The statistical analysis conducted on geographies consisting of 451,173,379 people shows a mild negative correlation between the proportion of Austrians and household income with householder between the ages 45 and 64 in the United States with a correlation coefficient (R) of -0.372 and weighted average of $108,692. Similarly, the statistical analysis conducted on geographies consisting of 217,894,820 people shows a significant positive correlation between the proportion of Immigrants from Kenya and household income with householder between the ages 45 and 64 in the United States with a correlation coefficient (R) of 0.661 and weighted average of $97,964, a difference of 11.0%.
Householder Income Ages 45 - 64 years Correlation Summary
| Measurement | Austrian | Immigrants from Kenya |
| Minimum | $20,833 | $41,343 |
| Maximum | $155,000 | $250,001 |
| Range | $134,167 | $208,658 |
| Mean | $100,755 | $91,195 |
| Median | $104,463 | $91,314 |
| Interquartile 25% (IQ1) | $79,395 | $80,833 |
| Interquartile 75% (IQ3) | $126,954 | $97,063 |
| Interquartile Range (IQR) | $47,559 | $16,231 |
| Standard Deviation (Sample) | $29,820 | $31,961 |
| Standard Deviation (Population) | $29,391 | $31,487 |
Similar Demographics by Householder Income Ages 45 - 64 years
Demographics Similar to Austrians by Householder Income Ages 45 - 64 years
In terms of householder income ages 45 - 64 years, the demographic groups most similar to Austrians are Tongan ($108,643, a difference of 0.040%), Romanian ($108,609, a difference of 0.080%), Immigrants from Afghanistan ($108,785, a difference of 0.090%), Immigrants from Western Europe ($108,824, a difference of 0.12%), and Ukrainian ($108,475, a difference of 0.20%).
| Demographics | Rating | Rank | Householder Income Ages 45 - 64 years |
| Immigrants | Bulgaria | 98.9 /100 | #79 | Exceptional $109,379 |
| Jordanians | 98.9 /100 | #80 | Exceptional $109,376 |
| Immigrants | Eastern Europe | 98.9 /100 | #81 | Exceptional $109,335 |
| Immigrants | North America | 98.8 /100 | #82 | Exceptional $109,198 |
| Immigrants | Spain | 98.8 /100 | #83 | Exceptional $109,051 |
| Immigrants | Western Europe | 98.6 /100 | #84 | Exceptional $108,824 |
| Immigrants | Afghanistan | 98.6 /100 | #85 | Exceptional $108,785 |
| Austrians | 98.5 /100 | #86 | Exceptional $108,692 |
| Tongans | 98.5 /100 | #87 | Exceptional $108,643 |
| Romanians | 98.5 /100 | #88 | Exceptional $108,609 |
| Ukrainians | 98.3 /100 | #89 | Exceptional $108,475 |
| Immigrants | Philippines | 98.3 /100 | #90 | Exceptional $108,471 |
| Immigrants | Lebanon | 98.3 /100 | #91 | Exceptional $108,471 |
| Croatians | 98.3 /100 | #92 | Exceptional $108,383 |
| Immigrants | Croatia | 98.2 /100 | #93 | Exceptional $108,304 |
Demographics Similar to Immigrants from Kenya by Householder Income Ages 45 - 64 years
In terms of householder income ages 45 - 64 years, the demographic groups most similar to Immigrants from Kenya are White/Caucasian ($98,091, a difference of 0.13%), Immigrants from Iraq ($98,201, a difference of 0.24%), Puget Sound Salish ($98,340, a difference of 0.38%), Yugoslavian ($97,558, a difference of 0.42%), and Immigrants from Eastern Africa ($98,467, a difference of 0.51%).
| Demographics | Rating | Rank | Householder Income Ages 45 - 64 years |
| Hawaiians | 31.6 /100 | #193 | Fair $98,778 |
| Uruguayans | 30.3 /100 | #194 | Fair $98,660 |
| Spanish | 29.2 /100 | #195 | Fair $98,554 |
| Immigrants | Eastern Africa | 28.3 /100 | #196 | Fair $98,467 |
| Puget Sound Salish | 27.0 /100 | #197 | Fair $98,340 |
| Immigrants | Iraq | 25.7 /100 | #198 | Fair $98,201 |
| Whites/Caucasians | 24.6 /100 | #199 | Fair $98,091 |
| Immigrants | Kenya | 23.5 /100 | #200 | Fair $97,964 |
| Yugoslavians | 20.0 /100 | #201 | Fair $97,558 |
| Tlingit-Haida | 18.9 /100 | #202 | Poor $97,417 |
| Immigrants | Thailand | 18.8 /100 | #203 | Poor $97,400 |
| Immigrants | Eritrea | 18.6 /100 | #204 | Poor $97,373 |
| Immigrants | Colombia | 18.0 /100 | #205 | Poor $97,290 |
| Immigrants | Africa | 17.9 /100 | #206 | Poor $97,284 |
| Ghanaians | 17.9 /100 | #207 | Poor $97,277 |