Venezuelan vs British Median Earnings
COMPARE
Venezuelan
British
Median Earnings
Median Earnings Comparison
Venezuelans
British
$44,580
MEDIAN EARNINGS
6.9/ 100
METRIC RATING
235th/ 347
METRIC RANK
$48,189
MEDIAN EARNINGS
92.2/ 100
METRIC RATING
132nd/ 347
METRIC RANK
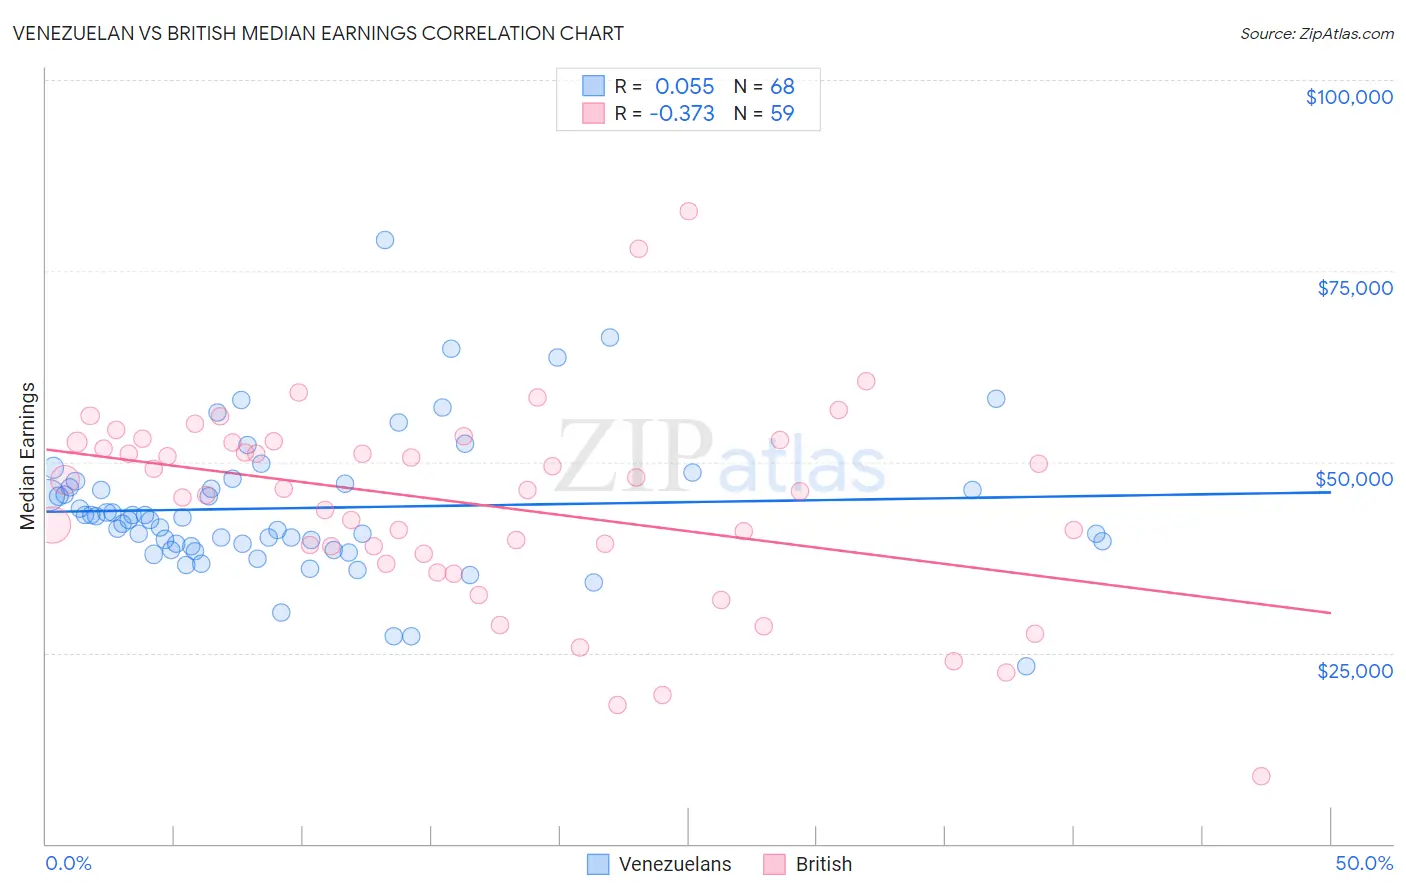
Venezuelan vs British Median Earnings Correlation Chart
The statistical analysis conducted on geographies consisting of 306,328,741 people shows a slight positive correlation between the proportion of Venezuelans and median earnings in the United States with a correlation coefficient (R) of 0.055 and weighted average of $44,580. Similarly, the statistical analysis conducted on geographies consisting of 531,344,409 people shows a mild negative correlation between the proportion of British and median earnings in the United States with a correlation coefficient (R) of -0.373 and weighted average of $48,189, a difference of 8.1%.
Median Earnings Correlation Summary
| Measurement | Venezuelan | British |
| Minimum | $23,314 | $8,915 |
| Maximum | $78,969 | $82,773 |
| Range | $55,655 | $73,858 |
| Mean | $43,969 | $44,491 |
| Median | $42,571 | $46,291 |
| Interquartile 25% (IQ1) | $39,048 | $37,889 |
| Interquartile 75% (IQ3) | $46,866 | $52,582 |
| Interquartile Range (IQR) | $7,818 | $14,693 |
| Standard Deviation (Sample) | $9,261 | $13,191 |
| Standard Deviation (Population) | $9,192 | $13,079 |
Similar Demographics by Median Earnings
Demographics Similar to Venezuelans by Median Earnings
In terms of median earnings, the demographic groups most similar to Venezuelans are British West Indian ($44,552, a difference of 0.060%), Cape Verdean ($44,640, a difference of 0.14%), Immigrants from Ecuador ($44,462, a difference of 0.27%), Sudanese ($44,419, a difference of 0.36%), and Immigrants from Sudan ($44,767, a difference of 0.42%).
| Demographics | Rating | Rank | Median Earnings |
| Immigrants | Iraq | 11.6 /100 | #228 | Poor $44,988 |
| Scotch-Irish | 10.7 /100 | #229 | Poor $44,924 |
| Immigrants | Western Africa | 10.3 /100 | #230 | Poor $44,893 |
| Japanese | 9.5 /100 | #231 | Tragic $44,825 |
| Delaware | 9.0 /100 | #232 | Tragic $44,783 |
| Immigrants | Sudan | 8.8 /100 | #233 | Tragic $44,767 |
| Cape Verdeans | 7.5 /100 | #234 | Tragic $44,640 |
| Venezuelans | 6.9 /100 | #235 | Tragic $44,580 |
| British West Indians | 6.7 /100 | #236 | Tragic $44,552 |
| Immigrants | Ecuador | 5.9 /100 | #237 | Tragic $44,462 |
| Sudanese | 5.6 /100 | #238 | Tragic $44,419 |
| Senegalese | 5.3 /100 | #239 | Tragic $44,373 |
| Aleuts | 4.4 /100 | #240 | Tragic $44,241 |
| Samoans | 4.2 /100 | #241 | Tragic $44,206 |
| Immigrants | Venezuela | 4.0 /100 | #242 | Tragic $44,163 |
Demographics Similar to British by Median Earnings
In terms of median earnings, the demographic groups most similar to British are Zimbabwean ($48,229, a difference of 0.080%), Lebanese ($48,226, a difference of 0.080%), Pakistani ($48,254, a difference of 0.14%), Immigrants from Philippines ($48,266, a difference of 0.16%), and Sierra Leonean ($48,286, a difference of 0.20%).
| Demographics | Rating | Rank | Median Earnings |
| Immigrants | Fiji | 93.3 /100 | #125 | Exceptional $48,305 |
| Assyrians/Chaldeans/Syriacs | 93.3 /100 | #126 | Exceptional $48,304 |
| Sierra Leoneans | 93.1 /100 | #127 | Exceptional $48,286 |
| Immigrants | Philippines | 92.9 /100 | #128 | Exceptional $48,266 |
| Pakistanis | 92.8 /100 | #129 | Exceptional $48,254 |
| Zimbabweans | 92.6 /100 | #130 | Exceptional $48,229 |
| Lebanese | 92.5 /100 | #131 | Exceptional $48,226 |
| British | 92.2 /100 | #132 | Exceptional $48,189 |
| Immigrants | Uganda | 90.5 /100 | #133 | Exceptional $48,041 |
| Sri Lankans | 90.5 /100 | #134 | Exceptional $48,040 |
| Portuguese | 90.4 /100 | #135 | Exceptional $48,032 |
| Slovenes | 90.0 /100 | #136 | Excellent $47,995 |
| Immigrants | Nepal | 89.0 /100 | #137 | Excellent $47,925 |
| Europeans | 88.9 /100 | #138 | Excellent $47,915 |
| Canadians | 88.8 /100 | #139 | Excellent $47,911 |