Venezuelan vs Austrian Median Earnings
COMPARE
Venezuelan
Austrian
Median Earnings
Median Earnings Comparison
Venezuelans
Austrians
$44,580
MEDIAN EARNINGS
6.9/ 100
METRIC RATING
235th/ 347
METRIC RANK
$49,501
MEDIAN EARNINGS
98.7/ 100
METRIC RATING
103rd/ 347
METRIC RANK
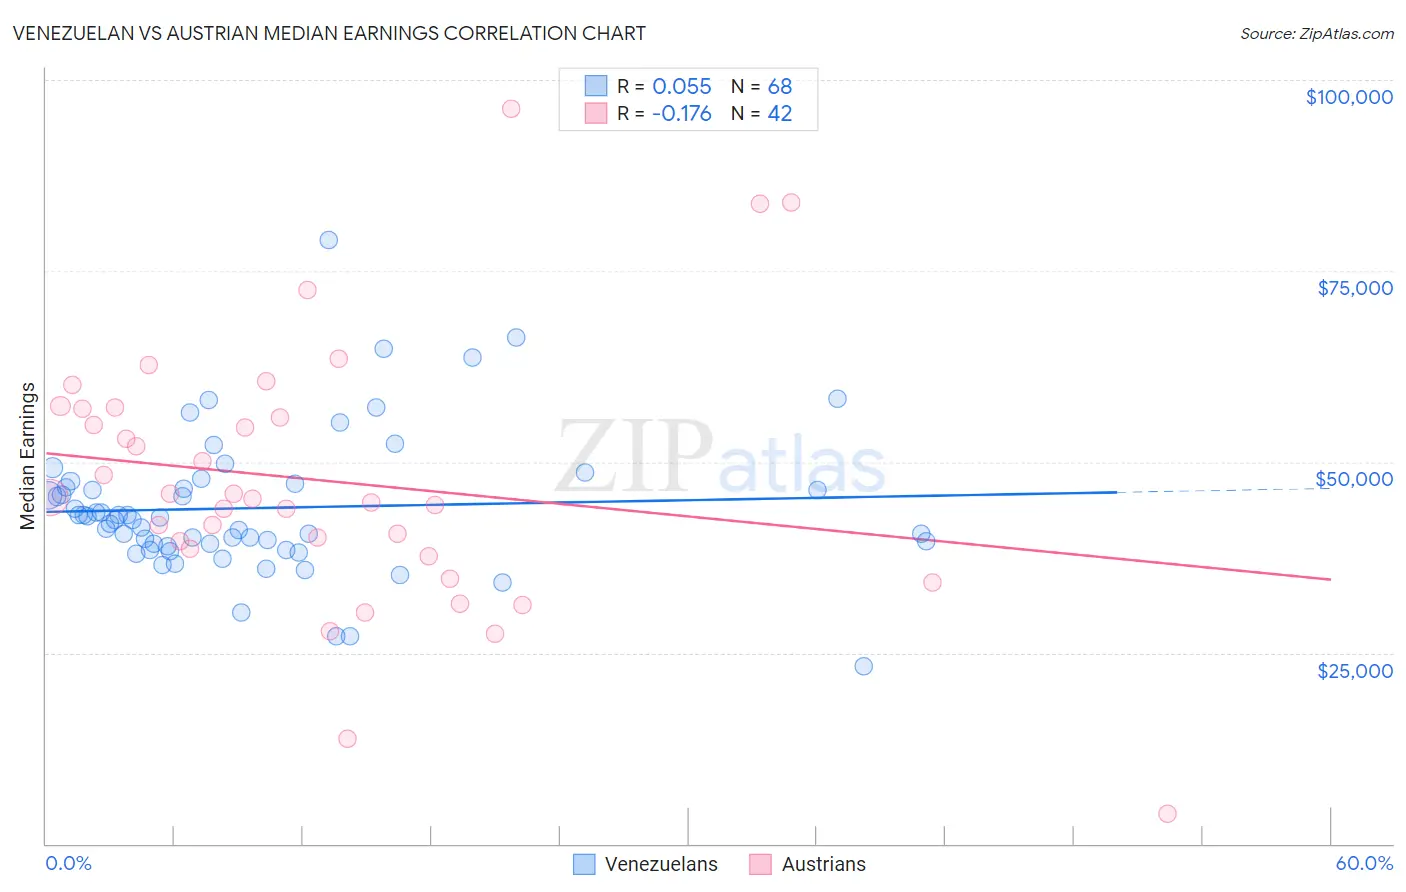
Venezuelan vs Austrian Median Earnings Correlation Chart
The statistical analysis conducted on geographies consisting of 306,328,741 people shows a slight positive correlation between the proportion of Venezuelans and median earnings in the United States with a correlation coefficient (R) of 0.055 and weighted average of $44,580. Similarly, the statistical analysis conducted on geographies consisting of 452,042,983 people shows a poor negative correlation between the proportion of Austrians and median earnings in the United States with a correlation coefficient (R) of -0.176 and weighted average of $49,501, a difference of 11.0%.
Median Earnings Correlation Summary
| Measurement | Venezuelan | Austrian |
| Minimum | $23,314 | $3,902 |
| Maximum | $78,969 | $96,250 |
| Range | $55,655 | $92,348 |
| Mean | $43,969 | $47,542 |
| Median | $42,571 | $45,255 |
| Interquartile 25% (IQ1) | $39,048 | $38,609 |
| Interquartile 75% (IQ3) | $46,866 | $56,967 |
| Interquartile Range (IQR) | $7,818 | $18,358 |
| Standard Deviation (Sample) | $9,261 | $17,409 |
| Standard Deviation (Population) | $9,192 | $17,200 |
Similar Demographics by Median Earnings
Demographics Similar to Venezuelans by Median Earnings
In terms of median earnings, the demographic groups most similar to Venezuelans are British West Indian ($44,552, a difference of 0.060%), Cape Verdean ($44,640, a difference of 0.14%), Immigrants from Ecuador ($44,462, a difference of 0.27%), Sudanese ($44,419, a difference of 0.36%), and Immigrants from Sudan ($44,767, a difference of 0.42%).
| Demographics | Rating | Rank | Median Earnings |
| Immigrants | Iraq | 11.6 /100 | #228 | Poor $44,988 |
| Scotch-Irish | 10.7 /100 | #229 | Poor $44,924 |
| Immigrants | Western Africa | 10.3 /100 | #230 | Poor $44,893 |
| Japanese | 9.5 /100 | #231 | Tragic $44,825 |
| Delaware | 9.0 /100 | #232 | Tragic $44,783 |
| Immigrants | Sudan | 8.8 /100 | #233 | Tragic $44,767 |
| Cape Verdeans | 7.5 /100 | #234 | Tragic $44,640 |
| Venezuelans | 6.9 /100 | #235 | Tragic $44,580 |
| British West Indians | 6.7 /100 | #236 | Tragic $44,552 |
| Immigrants | Ecuador | 5.9 /100 | #237 | Tragic $44,462 |
| Sudanese | 5.6 /100 | #238 | Tragic $44,419 |
| Senegalese | 5.3 /100 | #239 | Tragic $44,373 |
| Aleuts | 4.4 /100 | #240 | Tragic $44,241 |
| Samoans | 4.2 /100 | #241 | Tragic $44,206 |
| Immigrants | Venezuela | 4.0 /100 | #242 | Tragic $44,163 |
Demographics Similar to Austrians by Median Earnings
In terms of median earnings, the demographic groups most similar to Austrians are Immigrants from Brazil ($49,463, a difference of 0.080%), Ethiopian ($49,572, a difference of 0.14%), Immigrants from Western Asia ($49,389, a difference of 0.23%), Immigrants from Albania ($49,377, a difference of 0.25%), and Immigrants from Poland ($49,633, a difference of 0.27%).
| Demographics | Rating | Rank | Median Earnings |
| Immigrants | Lebanon | 99.0 /100 | #96 | Exceptional $49,682 |
| Immigrants | North Macedonia | 98.9 /100 | #97 | Exceptional $49,658 |
| Immigrants | Northern Africa | 98.9 /100 | #98 | Exceptional $49,648 |
| Immigrants | Afghanistan | 98.9 /100 | #99 | Exceptional $49,645 |
| Immigrants | Poland | 98.9 /100 | #100 | Exceptional $49,633 |
| Jordanians | 98.9 /100 | #101 | Exceptional $49,632 |
| Ethiopians | 98.8 /100 | #102 | Exceptional $49,572 |
| Austrians | 98.7 /100 | #103 | Exceptional $49,501 |
| Immigrants | Brazil | 98.6 /100 | #104 | Exceptional $49,463 |
| Immigrants | Western Asia | 98.4 /100 | #105 | Exceptional $49,389 |
| Immigrants | Albania | 98.4 /100 | #106 | Exceptional $49,377 |
| Immigrants | Morocco | 98.4 /100 | #107 | Exceptional $49,368 |
| Palestinians | 98.0 /100 | #108 | Exceptional $49,209 |
| Syrians | 97.1 /100 | #109 | Exceptional $48,934 |
| Immigrants | Ethiopia | 97.1 /100 | #110 | Exceptional $48,924 |