Ute vs Shoshone Median Earnings
COMPARE
Ute
Shoshone
Median Earnings
Median Earnings Comparison
Ute
Shoshone
$41,051
MEDIAN EARNINGS
0.1/ 100
METRIC RATING
300th/ 347
METRIC RANK
$40,932
MEDIAN EARNINGS
0.0/ 100
METRIC RATING
302nd/ 347
METRIC RANK
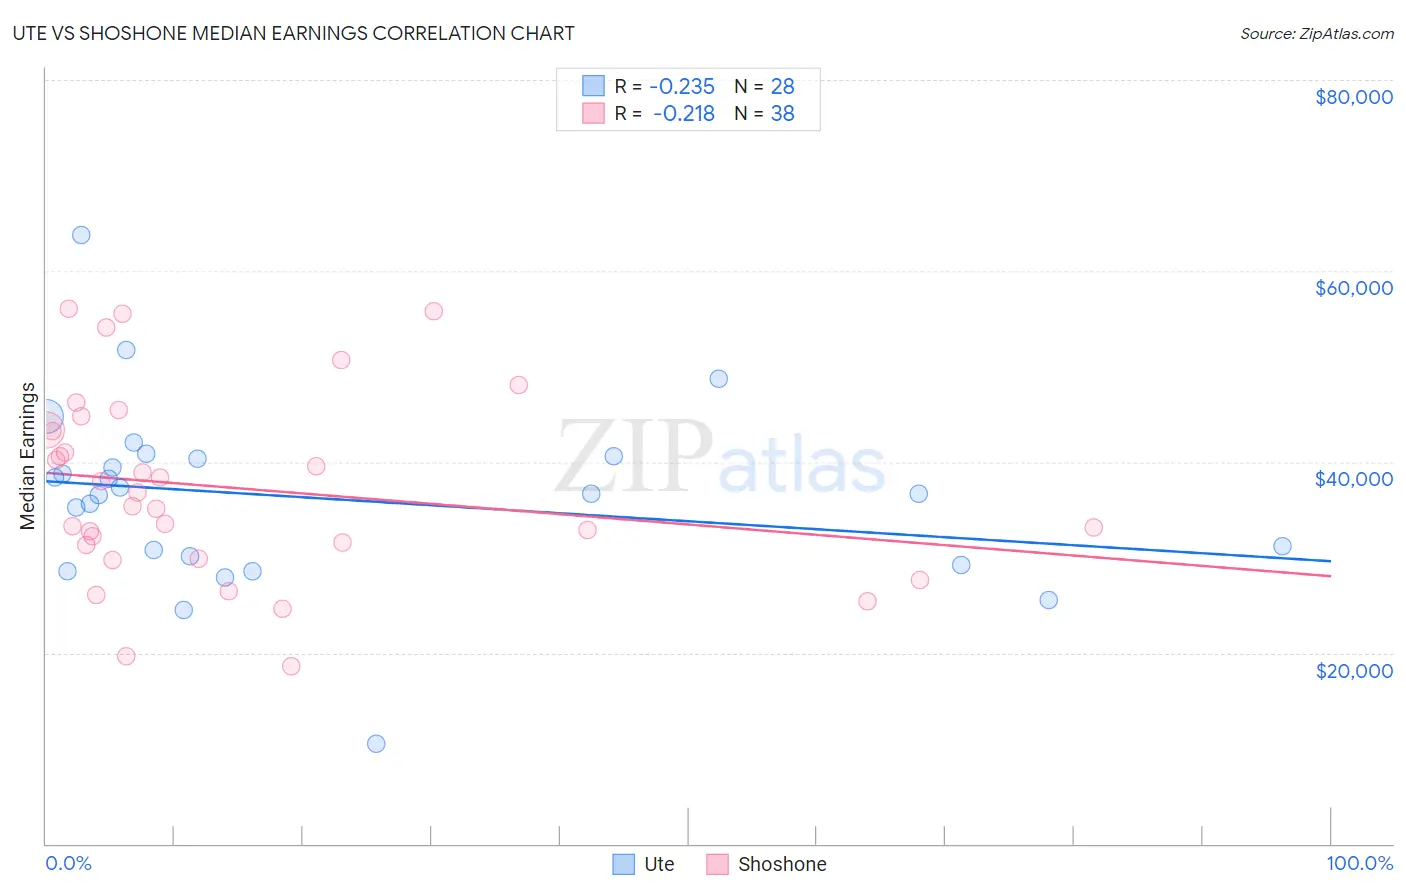
Ute vs Shoshone Median Earnings Correlation Chart
The statistical analysis conducted on geographies consisting of 55,664,253 people shows a weak negative correlation between the proportion of Ute and median earnings in the United States with a correlation coefficient (R) of -0.235 and weighted average of $41,051. Similarly, the statistical analysis conducted on geographies consisting of 66,619,980 people shows a weak negative correlation between the proportion of Shoshone and median earnings in the United States with a correlation coefficient (R) of -0.218 and weighted average of $40,932, a difference of 0.29%.
Median Earnings Correlation Summary
| Measurement | Ute | Shoshone |
| Minimum | $10,500 | $18,625 |
| Maximum | $63,719 | $56,007 |
| Range | $53,219 | $37,382 |
| Mean | $36,165 | $37,253 |
| Median | $36,686 | $36,104 |
| Interquartile 25% (IQ1) | $29,690 | $31,272 |
| Interquartile 75% (IQ3) | $40,497 | $43,286 |
| Interquartile Range (IQR) | $10,807 | $12,015 |
| Standard Deviation (Sample) | $9,794 | $9,755 |
| Standard Deviation (Population) | $9,618 | $9,625 |
Demographics Similar to Ute and Shoshone by Median Earnings
In terms of median earnings, the demographic groups most similar to Ute are Immigrants from Latin America ($41,049, a difference of 0.010%), Immigrants from Caribbean ($41,119, a difference of 0.17%), Immigrants from Micronesia ($41,133, a difference of 0.20%), Haitian ($40,918, a difference of 0.32%), and Guatemalan ($41,205, a difference of 0.37%). Similarly, the demographic groups most similar to Shoshone are Haitian ($40,918, a difference of 0.030%), Immigrants from Guatemala ($40,851, a difference of 0.20%), Immigrants from Latin America ($41,049, a difference of 0.29%), Immigrants from Caribbean ($41,119, a difference of 0.46%), and Immigrants from Micronesia ($41,133, a difference of 0.49%).
| Demographics | Rating | Rank | Median Earnings |
| Central American Indians | 0.1 /100 | #291 | Tragic $41,474 |
| U.S. Virgin Islanders | 0.1 /100 | #292 | Tragic $41,448 |
| Immigrants | Zaire | 0.1 /100 | #293 | Tragic $41,325 |
| Potawatomi | 0.1 /100 | #294 | Tragic $41,288 |
| Bangladeshis | 0.1 /100 | #295 | Tragic $41,263 |
| Cherokee | 0.1 /100 | #296 | Tragic $41,252 |
| Guatemalans | 0.1 /100 | #297 | Tragic $41,205 |
| Immigrants | Micronesia | 0.1 /100 | #298 | Tragic $41,133 |
| Immigrants | Caribbean | 0.1 /100 | #299 | Tragic $41,119 |
| Ute | 0.1 /100 | #300 | Tragic $41,051 |
| Immigrants | Latin America | 0.1 /100 | #301 | Tragic $41,049 |
| Shoshone | 0.0 /100 | #302 | Tragic $40,932 |
| Haitians | 0.0 /100 | #303 | Tragic $40,918 |
| Immigrants | Guatemala | 0.0 /100 | #304 | Tragic $40,851 |
| Chickasaw | 0.0 /100 | #305 | Tragic $40,672 |
| Yaqui | 0.0 /100 | #306 | Tragic $40,647 |
| Hondurans | 0.0 /100 | #307 | Tragic $40,638 |
| Cubans | 0.0 /100 | #308 | Tragic $40,619 |
| Immigrants | Haiti | 0.0 /100 | #309 | Tragic $40,550 |
| Apache | 0.0 /100 | #310 | Tragic $40,388 |
| Hispanics or Latinos | 0.0 /100 | #311 | Tragic $40,288 |