Ute vs Immigrants from Moldova Median Earnings
COMPARE
Ute
Immigrants from Moldova
Median Earnings
Median Earnings Comparison
Ute
Immigrants from Moldova
$41,051
MEDIAN EARNINGS
0.1/ 100
METRIC RATING
300th/ 347
METRIC RANK
$50,274
MEDIAN EARNINGS
99.5/ 100
METRIC RATING
82nd/ 347
METRIC RANK
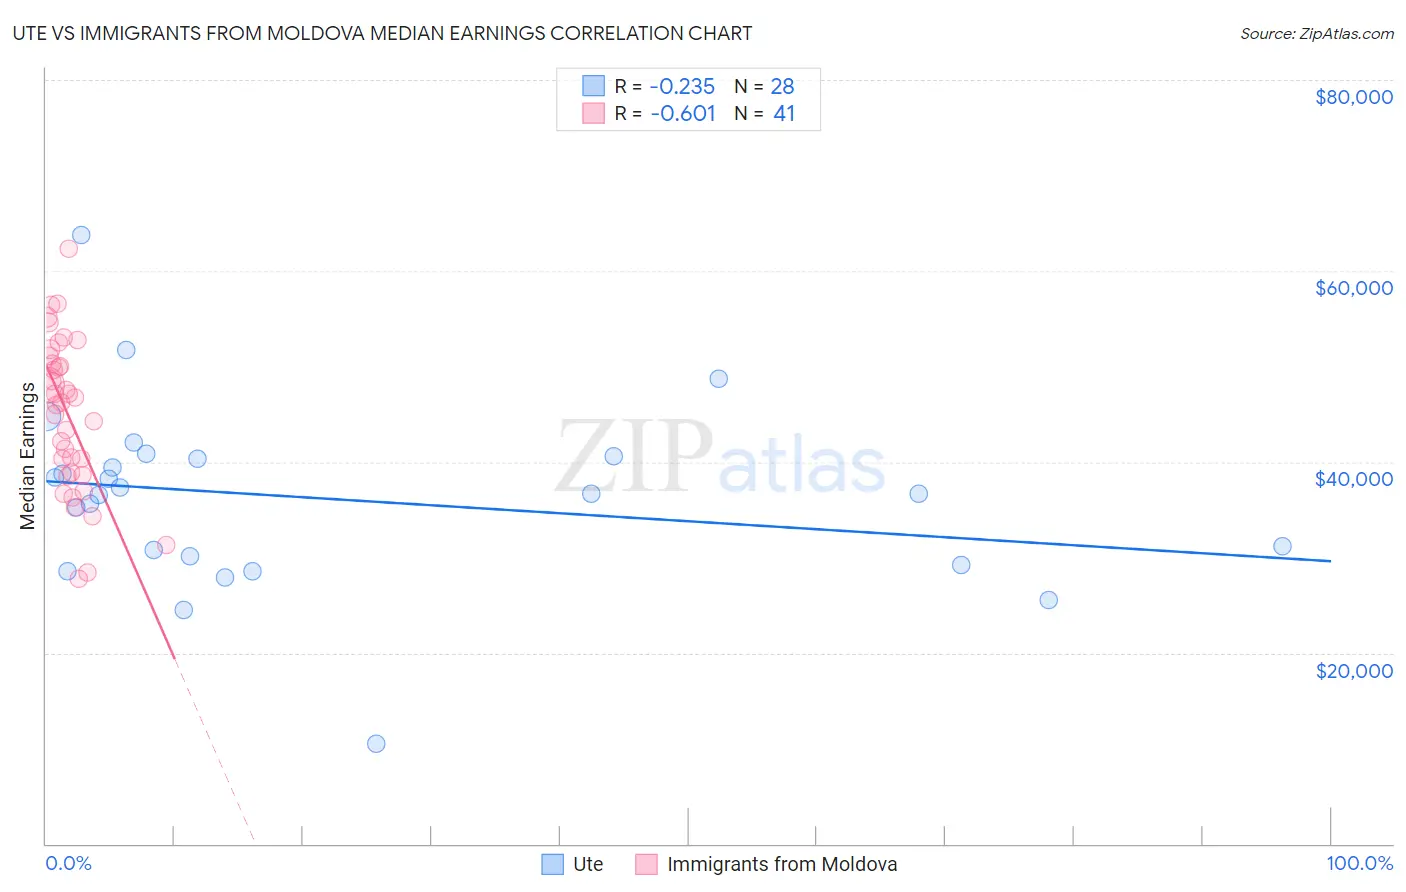
Ute vs Immigrants from Moldova Median Earnings Correlation Chart
The statistical analysis conducted on geographies consisting of 55,664,253 people shows a weak negative correlation between the proportion of Ute and median earnings in the United States with a correlation coefficient (R) of -0.235 and weighted average of $41,051. Similarly, the statistical analysis conducted on geographies consisting of 124,398,835 people shows a significant negative correlation between the proportion of Immigrants from Moldova and median earnings in the United States with a correlation coefficient (R) of -0.601 and weighted average of $50,274, a difference of 22.5%.
Median Earnings Correlation Summary
| Measurement | Ute | Immigrants from Moldova |
| Minimum | $10,500 | $27,768 |
| Maximum | $63,719 | $62,360 |
| Range | $53,219 | $34,592 |
| Mean | $36,165 | $44,970 |
| Median | $36,686 | $46,266 |
| Interquartile 25% (IQ1) | $29,690 | $38,796 |
| Interquartile 75% (IQ3) | $40,497 | $50,724 |
| Interquartile Range (IQR) | $10,807 | $11,928 |
| Standard Deviation (Sample) | $9,794 | $7,997 |
| Standard Deviation (Population) | $9,618 | $7,899 |
Similar Demographics by Median Earnings
Demographics Similar to Ute by Median Earnings
In terms of median earnings, the demographic groups most similar to Ute are Immigrants from Latin America ($41,049, a difference of 0.010%), Immigrants from Caribbean ($41,119, a difference of 0.17%), Immigrants from Micronesia ($41,133, a difference of 0.20%), Shoshone ($40,932, a difference of 0.29%), and Haitian ($40,918, a difference of 0.32%).
| Demographics | Rating | Rank | Median Earnings |
| Immigrants | Zaire | 0.1 /100 | #293 | Tragic $41,325 |
| Potawatomi | 0.1 /100 | #294 | Tragic $41,288 |
| Bangladeshis | 0.1 /100 | #295 | Tragic $41,263 |
| Cherokee | 0.1 /100 | #296 | Tragic $41,252 |
| Guatemalans | 0.1 /100 | #297 | Tragic $41,205 |
| Immigrants | Micronesia | 0.1 /100 | #298 | Tragic $41,133 |
| Immigrants | Caribbean | 0.1 /100 | #299 | Tragic $41,119 |
| Ute | 0.1 /100 | #300 | Tragic $41,051 |
| Immigrants | Latin America | 0.1 /100 | #301 | Tragic $41,049 |
| Shoshone | 0.0 /100 | #302 | Tragic $40,932 |
| Haitians | 0.0 /100 | #303 | Tragic $40,918 |
| Immigrants | Guatemala | 0.0 /100 | #304 | Tragic $40,851 |
| Chickasaw | 0.0 /100 | #305 | Tragic $40,672 |
| Yaqui | 0.0 /100 | #306 | Tragic $40,647 |
| Hondurans | 0.0 /100 | #307 | Tragic $40,638 |
Demographics Similar to Immigrants from Moldova by Median Earnings
In terms of median earnings, the demographic groups most similar to Immigrants from Moldova are Immigrants from Southern Europe ($50,280, a difference of 0.010%), Romanian ($50,244, a difference of 0.060%), Ukrainian ($50,320, a difference of 0.090%), Immigrants from Hungary ($50,227, a difference of 0.090%), and Immigrants from Kazakhstan ($50,225, a difference of 0.10%).
| Demographics | Rating | Rank | Median Earnings |
| Immigrants | Scotland | 99.8 /100 | #75 | Exceptional $50,741 |
| Immigrants | Italy | 99.7 /100 | #76 | Exceptional $50,581 |
| Immigrants | Western Europe | 99.7 /100 | #77 | Exceptional $50,549 |
| Argentineans | 99.6 /100 | #78 | Exceptional $50,399 |
| Laotians | 99.6 /100 | #79 | Exceptional $50,343 |
| Ukrainians | 99.6 /100 | #80 | Exceptional $50,320 |
| Immigrants | Southern Europe | 99.6 /100 | #81 | Exceptional $50,280 |
| Immigrants | Moldova | 99.5 /100 | #82 | Exceptional $50,274 |
| Romanians | 99.5 /100 | #83 | Exceptional $50,244 |
| Immigrants | Hungary | 99.5 /100 | #84 | Exceptional $50,227 |
| Immigrants | Kazakhstan | 99.5 /100 | #85 | Exceptional $50,225 |
| Immigrants | Canada | 99.5 /100 | #86 | Exceptional $50,192 |
| Immigrants | Uzbekistan | 99.5 /100 | #87 | Exceptional $50,151 |
| Albanians | 99.4 /100 | #88 | Exceptional $50,116 |
| Immigrants | North America | 99.4 /100 | #89 | Exceptional $50,108 |