Ugandan vs Slovene Median Family Income
COMPARE
Ugandan
Slovene
Median Family Income
Median Family Income Comparison
Ugandans
Slovenes
$106,541
MEDIAN FAMILY INCOME
87.8/ 100
METRIC RATING
133rd/ 347
METRIC RANK
$106,020
MEDIAN FAMILY INCOME
84.7/ 100
METRIC RATING
142nd/ 347
METRIC RANK
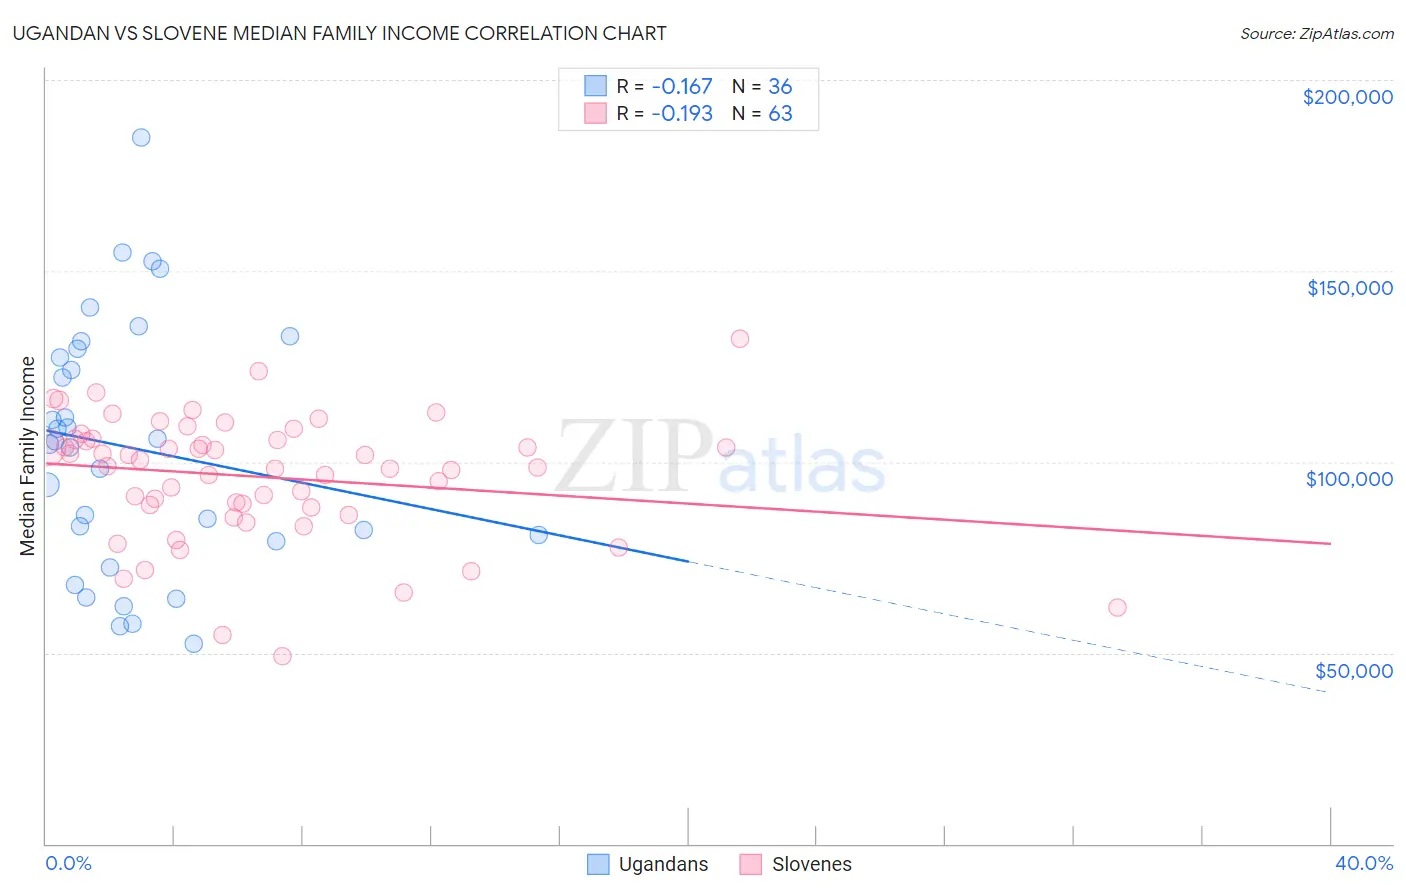
Ugandan vs Slovene Median Family Income Correlation Chart
The statistical analysis conducted on geographies consisting of 93,987,569 people shows a poor negative correlation between the proportion of Ugandans and median family income in the United States with a correlation coefficient (R) of -0.167 and weighted average of $106,541. Similarly, the statistical analysis conducted on geographies consisting of 261,214,906 people shows a poor negative correlation between the proportion of Slovenes and median family income in the United States with a correlation coefficient (R) of -0.193 and weighted average of $106,020, a difference of 0.49%.
Median Family Income Correlation Summary
| Measurement | Ugandan | Slovene |
| Minimum | $52,432 | $48,984 |
| Maximum | $184,887 | $132,096 |
| Range | $132,455 | $83,112 |
| Mean | $103,672 | $96,087 |
| Median | $104,959 | $98,910 |
| Interquartile 25% (IQ1) | $79,923 | $88,135 |
| Interquartile 75% (IQ3) | $128,589 | $105,910 |
| Interquartile Range (IQR) | $48,666 | $17,775 |
| Standard Deviation (Sample) | $32,416 | $16,283 |
| Standard Deviation (Population) | $31,963 | $16,153 |
Demographics Similar to Ugandans and Slovenes by Median Family Income
In terms of median family income, the demographic groups most similar to Ugandans are Immigrants from Fiji ($106,544, a difference of 0.0%), Canadian ($106,597, a difference of 0.050%), Immigrants from Oceania ($106,453, a difference of 0.080%), Portuguese ($106,286, a difference of 0.24%), and Immigrants from South Eastern Asia ($106,252, a difference of 0.27%). Similarly, the demographic groups most similar to Slovenes are Tongan ($105,967, a difference of 0.050%), Immigrants from Morocco ($105,964, a difference of 0.050%), Immigrants from Syria ($106,118, a difference of 0.090%), Danish ($105,900, a difference of 0.11%), and Norwegian ($106,144, a difference of 0.12%).
| Demographics | Rating | Rank | Median Family Income |
| Lebanese | 90.5 /100 | #127 | Exceptional $107,086 |
| Immigrants | Ethiopia | 90.0 /100 | #128 | Excellent $106,969 |
| Arabs | 89.9 /100 | #129 | Excellent $106,952 |
| Brazilians | 89.8 /100 | #130 | Excellent $106,942 |
| Canadians | 88.1 /100 | #131 | Excellent $106,597 |
| Immigrants | Fiji | 87.8 /100 | #132 | Excellent $106,544 |
| Ugandans | 87.8 /100 | #133 | Excellent $106,541 |
| Immigrants | Oceania | 87.3 /100 | #134 | Excellent $106,453 |
| Portuguese | 86.3 /100 | #135 | Excellent $106,286 |
| Immigrants | South Eastern Asia | 86.1 /100 | #136 | Excellent $106,252 |
| Immigrants | Uganda | 85.7 /100 | #137 | Excellent $106,188 |
| Immigrants | Vietnam | 85.7 /100 | #138 | Excellent $106,186 |
| Luxembourgers | 85.7 /100 | #139 | Excellent $106,183 |
| Norwegians | 85.5 /100 | #140 | Excellent $106,144 |
| Immigrants | Syria | 85.3 /100 | #141 | Excellent $106,118 |
| Slovenes | 84.7 /100 | #142 | Excellent $106,020 |
| Tongans | 84.3 /100 | #143 | Excellent $105,967 |
| Immigrants | Morocco | 84.3 /100 | #144 | Excellent $105,964 |
| Danes | 83.8 /100 | #145 | Excellent $105,900 |
| Czechs | 83.4 /100 | #146 | Excellent $105,839 |
| Immigrants | Chile | 82.1 /100 | #147 | Excellent $105,655 |