Immigrants from Argentina vs Slovene Median Family Income
COMPARE
Immigrants from Argentina
Slovene
Median Family Income
Median Family Income Comparison
Immigrants from Argentina
Slovenes
$110,873
MEDIAN FAMILY INCOME
98.5/ 100
METRIC RATING
89th/ 347
METRIC RANK
$106,020
MEDIAN FAMILY INCOME
84.7/ 100
METRIC RATING
142nd/ 347
METRIC RANK
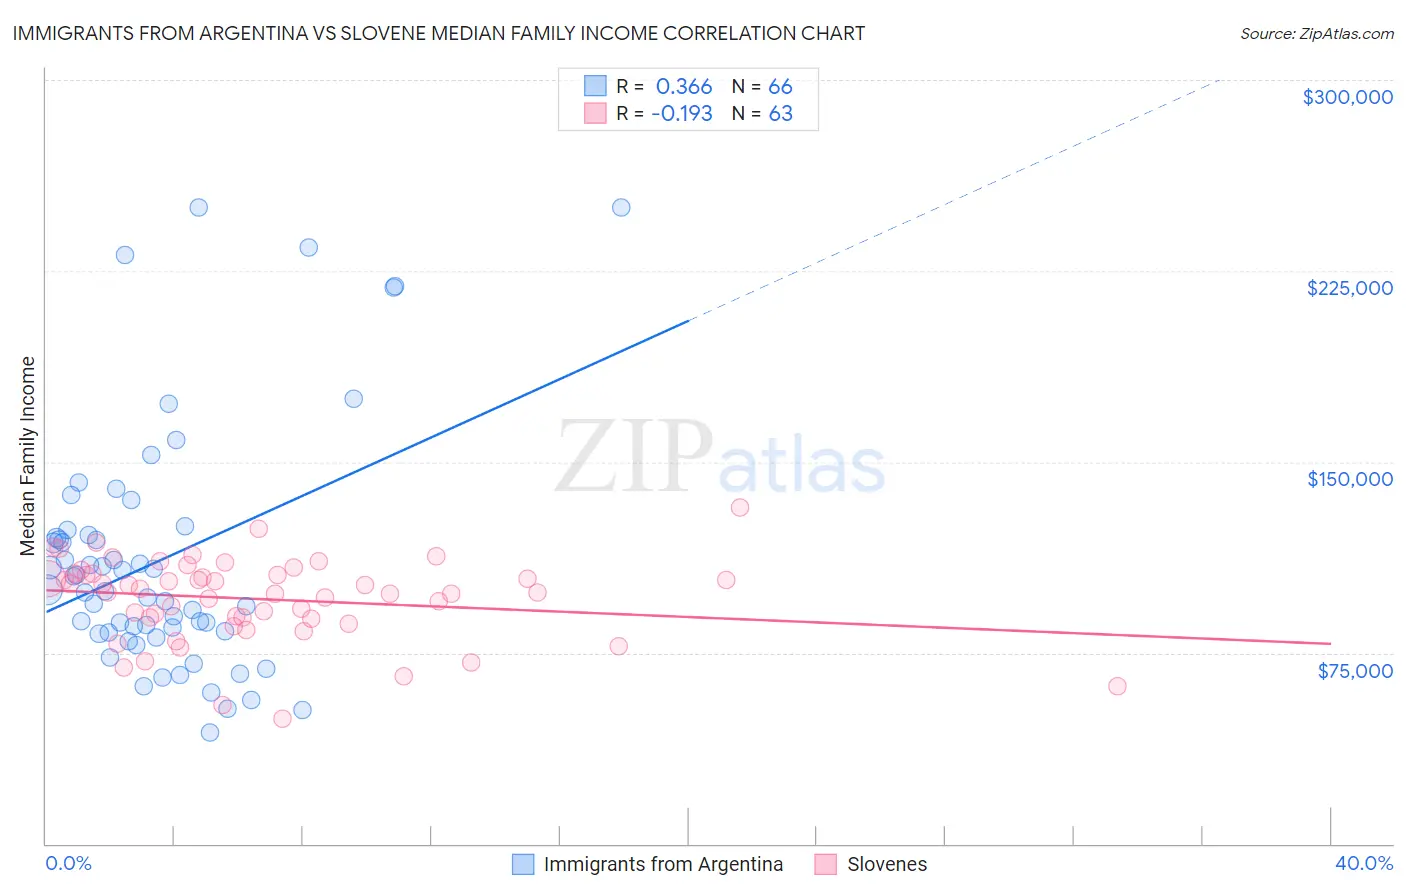
Immigrants from Argentina vs Slovene Median Family Income Correlation Chart
The statistical analysis conducted on geographies consisting of 264,326,105 people shows a mild positive correlation between the proportion of Immigrants from Argentina and median family income in the United States with a correlation coefficient (R) of 0.366 and weighted average of $110,873. Similarly, the statistical analysis conducted on geographies consisting of 261,214,906 people shows a poor negative correlation between the proportion of Slovenes and median family income in the United States with a correlation coefficient (R) of -0.193 and weighted average of $106,020, a difference of 4.6%.
Median Family Income Correlation Summary
| Measurement | Immigrants from Argentina | Slovene |
| Minimum | $43,750 | $48,984 |
| Maximum | $250,001 | $132,096 |
| Range | $206,251 | $83,112 |
| Mean | $111,446 | $96,087 |
| Median | $99,402 | $98,910 |
| Interquartile 25% (IQ1) | $83,128 | $88,135 |
| Interquartile 75% (IQ3) | $121,234 | $105,910 |
| Interquartile Range (IQR) | $38,106 | $17,775 |
| Standard Deviation (Sample) | $47,916 | $16,283 |
| Standard Deviation (Population) | $47,552 | $16,153 |
Similar Demographics by Median Family Income
Demographics Similar to Immigrants from Argentina by Median Family Income
In terms of median family income, the demographic groups most similar to Immigrants from Argentina are Northern European ($110,635, a difference of 0.21%), Immigrants from Southern Europe ($110,614, a difference of 0.23%), Romanian ($111,243, a difference of 0.33%), Austrian ($111,306, a difference of 0.39%), and Croatian ($111,370, a difference of 0.45%).
| Demographics | Rating | Rank | Median Family Income |
| Immigrants | England | 99.2 /100 | #82 | Exceptional $112,038 |
| Immigrants | Egypt | 99.0 /100 | #83 | Exceptional $111,689 |
| Immigrants | Hungary | 98.8 /100 | #84 | Exceptional $111,378 |
| Croatians | 98.8 /100 | #85 | Exceptional $111,370 |
| Ukrainians | 98.8 /100 | #86 | Exceptional $111,368 |
| Austrians | 98.8 /100 | #87 | Exceptional $111,306 |
| Romanians | 98.8 /100 | #88 | Exceptional $111,243 |
| Immigrants | Argentina | 98.5 /100 | #89 | Exceptional $110,873 |
| Northern Europeans | 98.3 /100 | #90 | Exceptional $110,635 |
| Immigrants | Southern Europe | 98.3 /100 | #91 | Exceptional $110,614 |
| Immigrants | Lebanon | 97.9 /100 | #92 | Exceptional $110,159 |
| Immigrants | Kazakhstan | 97.8 /100 | #93 | Exceptional $110,137 |
| Koreans | 97.8 /100 | #94 | Exceptional $110,103 |
| Zimbabweans | 97.7 /100 | #95 | Exceptional $110,011 |
| Immigrants | Moldova | 97.7 /100 | #96 | Exceptional $109,975 |
Demographics Similar to Slovenes by Median Family Income
In terms of median family income, the demographic groups most similar to Slovenes are Tongan ($105,967, a difference of 0.050%), Immigrants from Morocco ($105,964, a difference of 0.050%), Immigrants from Syria ($106,118, a difference of 0.090%), Danish ($105,900, a difference of 0.11%), and Norwegian ($106,144, a difference of 0.12%).
| Demographics | Rating | Rank | Median Family Income |
| Portuguese | 86.3 /100 | #135 | Excellent $106,286 |
| Immigrants | South Eastern Asia | 86.1 /100 | #136 | Excellent $106,252 |
| Immigrants | Uganda | 85.7 /100 | #137 | Excellent $106,188 |
| Immigrants | Vietnam | 85.7 /100 | #138 | Excellent $106,186 |
| Luxembourgers | 85.7 /100 | #139 | Excellent $106,183 |
| Norwegians | 85.5 /100 | #140 | Excellent $106,144 |
| Immigrants | Syria | 85.3 /100 | #141 | Excellent $106,118 |
| Slovenes | 84.7 /100 | #142 | Excellent $106,020 |
| Tongans | 84.3 /100 | #143 | Excellent $105,967 |
| Immigrants | Morocco | 84.3 /100 | #144 | Excellent $105,964 |
| Danes | 83.8 /100 | #145 | Excellent $105,900 |
| Czechs | 83.4 /100 | #146 | Excellent $105,839 |
| Immigrants | Chile | 82.1 /100 | #147 | Excellent $105,655 |
| Hungarians | 81.7 /100 | #148 | Excellent $105,609 |
| Immigrants | Germany | 80.9 /100 | #149 | Excellent $105,507 |