Tsimshian vs Immigrants from Australia Wage/Income Gap
COMPARE
Tsimshian
Immigrants from Australia
Wage/Income Gap
Wage/Income Gap Comparison
Tsimshian
Immigrants from Australia
23.9%
WAGE/INCOME GAP
98.9/ 100
METRIC RATING
103rd/ 347
METRIC RANK
28.2%
WAGE/INCOME GAP
0.3/ 100
METRIC RATING
292nd/ 347
METRIC RANK
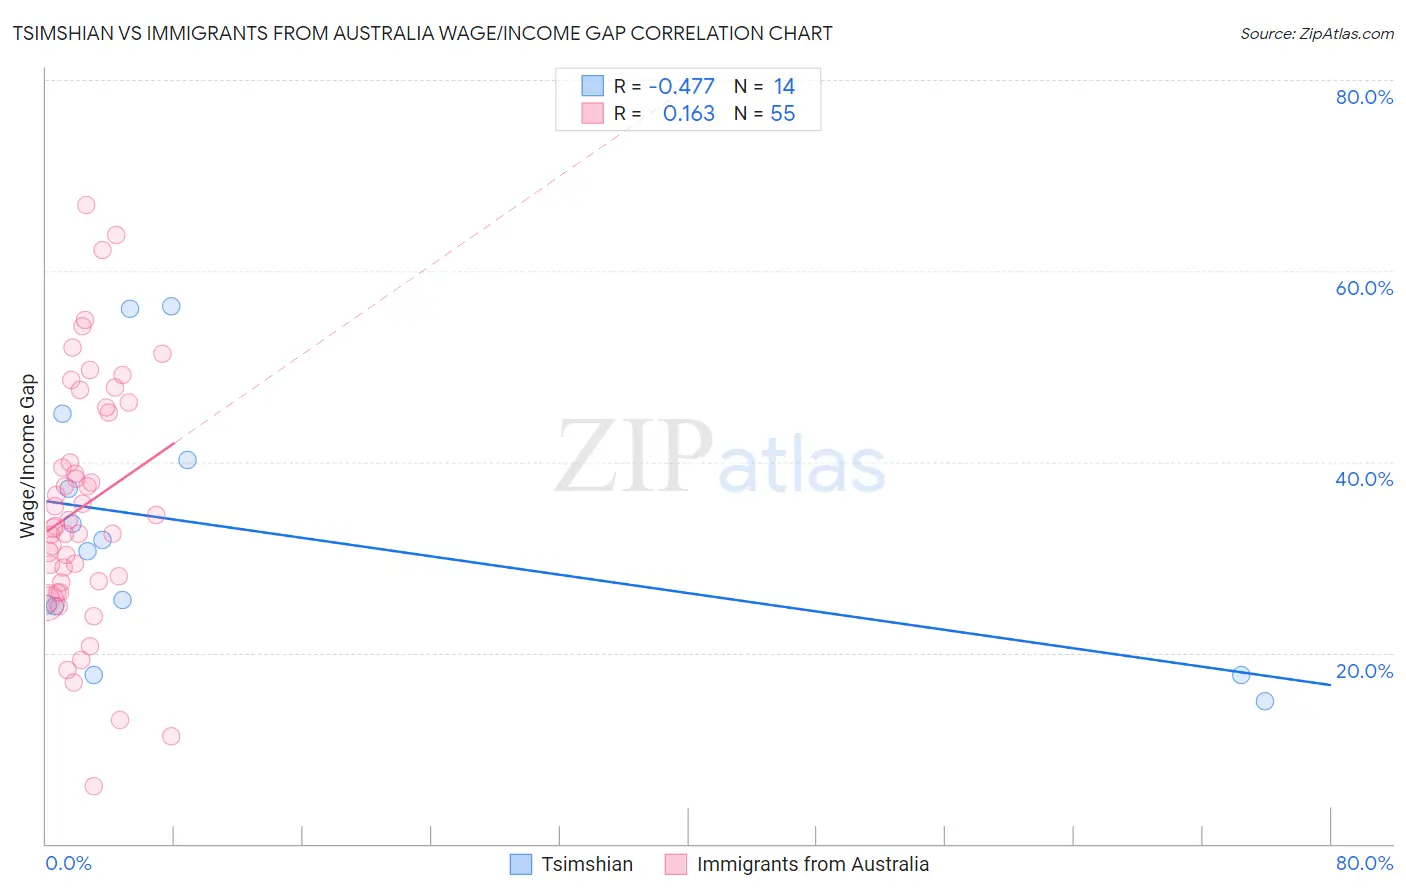
Tsimshian vs Immigrants from Australia Wage/Income Gap Correlation Chart
The statistical analysis conducted on geographies consisting of 15,623,634 people shows a moderate negative correlation between the proportion of Tsimshian and wage/income gap percentage in the United States with a correlation coefficient (R) of -0.477 and weighted average of 23.9%. Similarly, the statistical analysis conducted on geographies consisting of 227,127,530 people shows a poor positive correlation between the proportion of Immigrants from Australia and wage/income gap percentage in the United States with a correlation coefficient (R) of 0.163 and weighted average of 28.2%, a difference of 18.1%.
Wage/Income Gap Correlation Summary
| Measurement | Tsimshian | Immigrants from Australia |
| Minimum | 14.9% | 6.0% |
| Maximum | 56.3% | 66.9% |
| Range | 41.4% | 60.9% |
| Mean | 32.6% | 35.4% |
| Median | 31.2% | 33.2% |
| Interquartile 25% (IQ1) | 24.9% | 27.4% |
| Interquartile 75% (IQ3) | 40.2% | 45.7% |
| Interquartile Range (IQR) | 15.3% | 18.3% |
| Standard Deviation (Sample) | 13.2% | 13.0% |
| Standard Deviation (Population) | 12.7% | 12.9% |
Similar Demographics by Wage/Income Gap
Demographics Similar to Tsimshian by Wage/Income Gap
In terms of wage/income gap, the demographic groups most similar to Tsimshian are Immigrants from Laos (23.8%, a difference of 0.23%), Tlingit-Haida (24.0%, a difference of 0.33%), Japanese (23.8%, a difference of 0.37%), Moroccan (24.0%, a difference of 0.39%), and Sudanese (24.0%, a difference of 0.39%).
| Demographics | Rating | Rank | Wage/Income Gap |
| Kiowa | 99.4 /100 | #96 | Exceptional 23.6% |
| Immigrants | Sudan | 99.4 /100 | #97 | Exceptional 23.6% |
| Immigrants | Latin America | 99.2 /100 | #98 | Exceptional 23.7% |
| Aleuts | 99.2 /100 | #99 | Exceptional 23.7% |
| Yakama | 99.2 /100 | #100 | Exceptional 23.7% |
| Japanese | 99.1 /100 | #101 | Exceptional 23.8% |
| Immigrants | Laos | 99.0 /100 | #102 | Exceptional 23.8% |
| Tsimshian | 98.9 /100 | #103 | Exceptional 23.9% |
| Tlingit-Haida | 98.7 /100 | #104 | Exceptional 24.0% |
| Moroccans | 98.6 /100 | #105 | Exceptional 24.0% |
| Sudanese | 98.6 /100 | #106 | Exceptional 24.0% |
| Yaqui | 98.4 /100 | #107 | Exceptional 24.0% |
| Immigrants | Albania | 98.4 /100 | #108 | Exceptional 24.0% |
| Ugandans | 98.3 /100 | #109 | Exceptional 24.1% |
| Immigrants | Morocco | 98.1 /100 | #110 | Exceptional 24.1% |
Demographics Similar to Immigrants from Australia by Wage/Income Gap
In terms of wage/income gap, the demographic groups most similar to Immigrants from Australia are Czechoslovakian (28.2%, a difference of 0.060%), Immigrants from Israel (28.2%, a difference of 0.11%), Australian (28.2%, a difference of 0.12%), Greek (28.2%, a difference of 0.13%), and Canadian (28.1%, a difference of 0.22%).
| Demographics | Rating | Rank | Wage/Income Gap |
| Italians | 0.4 /100 | #285 | Tragic 28.1% |
| Immigrants | Austria | 0.4 /100 | #286 | Tragic 28.1% |
| Okinawans | 0.4 /100 | #287 | Tragic 28.1% |
| Choctaw | 0.4 /100 | #288 | Tragic 28.1% |
| Canadians | 0.3 /100 | #289 | Tragic 28.1% |
| Australians | 0.3 /100 | #290 | Tragic 28.2% |
| Czechoslovakians | 0.3 /100 | #291 | Tragic 28.2% |
| Immigrants | Australia | 0.3 /100 | #292 | Tragic 28.2% |
| Immigrants | Israel | 0.3 /100 | #293 | Tragic 28.2% |
| Greeks | 0.3 /100 | #294 | Tragic 28.2% |
| Slovenes | 0.3 /100 | #295 | Tragic 28.3% |
| Northern Europeans | 0.3 /100 | #296 | Tragic 28.3% |
| Immigrants | North America | 0.2 /100 | #297 | Tragic 28.4% |
| Austrians | 0.2 /100 | #298 | Tragic 28.4% |
| Immigrants | North Macedonia | 0.2 /100 | #299 | Tragic 28.4% |