Tsimshian vs Colville Median Family Income
COMPARE
Tsimshian
Colville
Median Family Income
Median Family Income Comparison
Tsimshian
Colville
$101,543
MEDIAN FAMILY INCOME
35.9/ 100
METRIC RATING
182nd/ 347
METRIC RANK
$85,792
MEDIAN FAMILY INCOME
0.0/ 100
METRIC RATING
301st/ 347
METRIC RANK
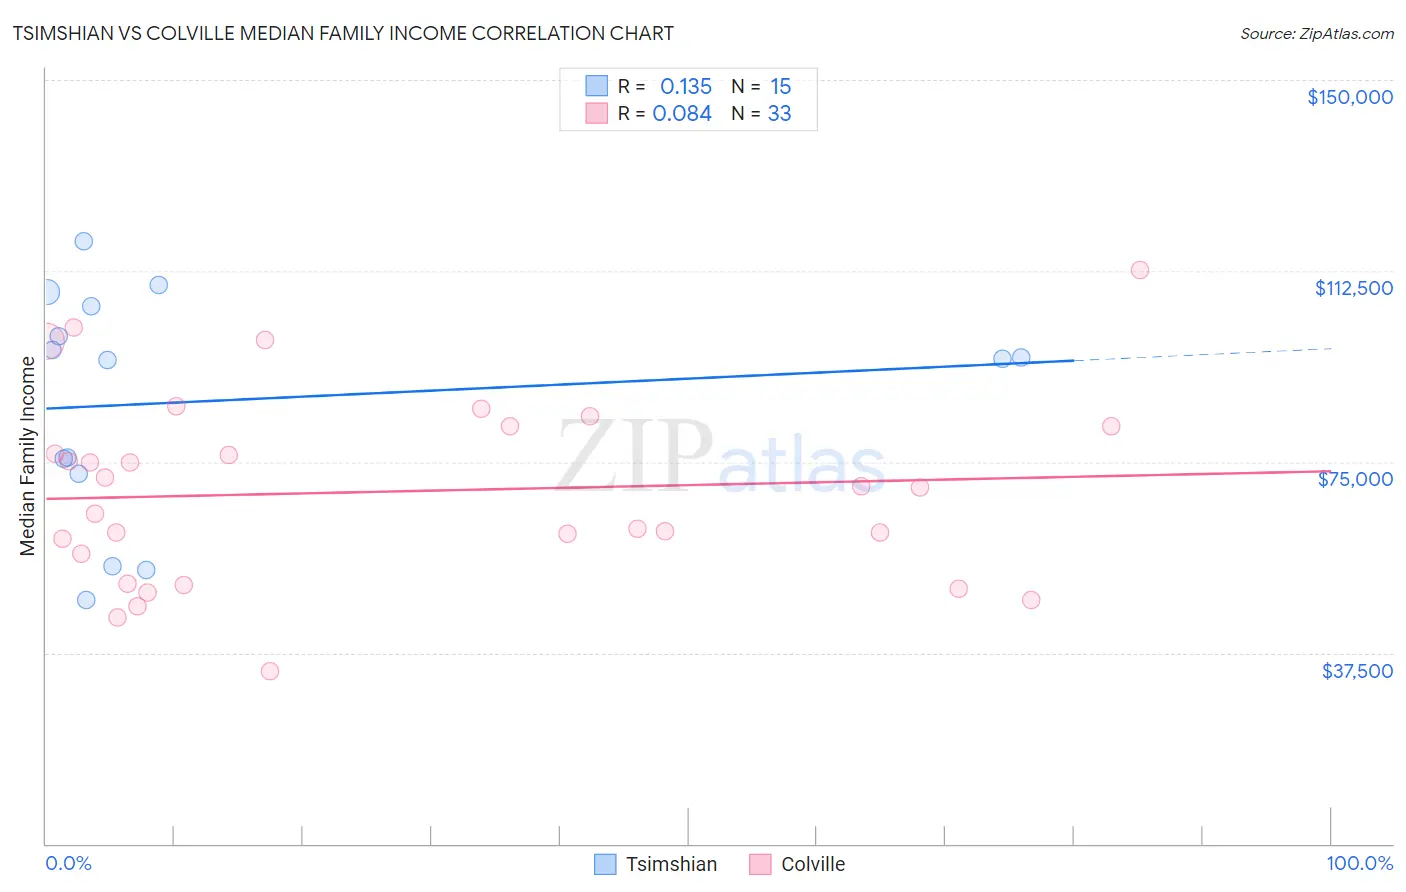
Tsimshian vs Colville Median Family Income Correlation Chart
The statistical analysis conducted on geographies consisting of 15,626,544 people shows a poor positive correlation between the proportion of Tsimshian and median family income in the United States with a correlation coefficient (R) of 0.135 and weighted average of $101,543. Similarly, the statistical analysis conducted on geographies consisting of 34,680,416 people shows a slight positive correlation between the proportion of Colville and median family income in the United States with a correlation coefficient (R) of 0.084 and weighted average of $85,792, a difference of 18.4%.
Median Family Income Correlation Summary
| Measurement | Tsimshian | Colville |
| Minimum | $47,917 | $33,824 |
| Maximum | $118,333 | $112,639 |
| Range | $70,416 | $78,815 |
| Mean | $86,976 | $69,185 |
| Median | $95,278 | $70,000 |
| Interquartile 25% (IQ1) | $72,646 | $53,997 |
| Interquartile 75% (IQ3) | $105,493 | $82,061 |
| Interquartile Range (IQR) | $32,847 | $28,064 |
| Standard Deviation (Sample) | $22,202 | $18,382 |
| Standard Deviation (Population) | $21,449 | $18,102 |
Similar Demographics by Median Family Income
Demographics Similar to Tsimshian by Median Family Income
In terms of median family income, the demographic groups most similar to Tsimshian are Spaniard ($101,617, a difference of 0.070%), French Canadian ($101,634, a difference of 0.090%), Kenyan ($101,417, a difference of 0.12%), Immigrants from Costa Rica ($101,354, a difference of 0.19%), and South American ($101,856, a difference of 0.31%).
| Demographics | Rating | Rank | Median Family Income |
| Immigrants | Eastern Africa | 47.1 /100 | #175 | Average $102,451 |
| French | 46.1 /100 | #176 | Average $102,368 |
| Germans | 44.6 /100 | #177 | Average $102,254 |
| Welsh | 43.3 /100 | #178 | Average $102,151 |
| South Americans | 39.7 /100 | #179 | Fair $101,856 |
| French Canadians | 37.0 /100 | #180 | Fair $101,634 |
| Spaniards | 36.8 /100 | #181 | Fair $101,617 |
| Tsimshian | 35.9 /100 | #182 | Fair $101,543 |
| Kenyans | 34.5 /100 | #183 | Fair $101,417 |
| Immigrants | Costa Rica | 33.7 /100 | #184 | Fair $101,354 |
| Dutch | 31.9 /100 | #185 | Fair $101,192 |
| Celtics | 31.3 /100 | #186 | Fair $101,139 |
| Tlingit-Haida | 30.8 /100 | #187 | Fair $101,092 |
| Guamanians/Chamorros | 30.5 /100 | #188 | Fair $101,061 |
| Immigrants | Portugal | 29.6 /100 | #189 | Fair $100,984 |
Demographics Similar to Colville by Median Family Income
In terms of median family income, the demographic groups most similar to Colville are Spanish American Indian ($85,728, a difference of 0.070%), Hispanic or Latino ($85,647, a difference of 0.17%), Mexican ($85,618, a difference of 0.20%), Paiute ($85,414, a difference of 0.44%), and Immigrants from Dominica ($85,411, a difference of 0.45%).
| Demographics | Rating | Rank | Median Family Income |
| Fijians | 0.0 /100 | #294 | Tragic $87,387 |
| Yaqui | 0.0 /100 | #295 | Tragic $87,289 |
| Immigrants | Guatemala | 0.0 /100 | #296 | Tragic $87,191 |
| Cajuns | 0.0 /100 | #297 | Tragic $87,157 |
| Immigrants | Latin America | 0.0 /100 | #298 | Tragic $86,989 |
| Chippewa | 0.0 /100 | #299 | Tragic $86,852 |
| Ottawa | 0.0 /100 | #300 | Tragic $86,380 |
| Colville | 0.0 /100 | #301 | Tragic $85,792 |
| Spanish American Indians | 0.0 /100 | #302 | Tragic $85,728 |
| Hispanics or Latinos | 0.0 /100 | #303 | Tragic $85,647 |
| Mexicans | 0.0 /100 | #304 | Tragic $85,618 |
| Paiute | 0.0 /100 | #305 | Tragic $85,414 |
| Immigrants | Dominica | 0.0 /100 | #306 | Tragic $85,411 |
| Chickasaw | 0.0 /100 | #307 | Tragic $85,356 |
| U.S. Virgin Islanders | 0.0 /100 | #308 | Tragic $85,294 |