Seminole vs Colville Median Family Income
COMPARE
Seminole
Colville
Median Family Income
Median Family Income Comparison
Seminole
Colville
$83,354
MEDIAN FAMILY INCOME
0.0/ 100
METRIC RATING
320th/ 347
METRIC RANK
$85,792
MEDIAN FAMILY INCOME
0.0/ 100
METRIC RATING
301st/ 347
METRIC RANK
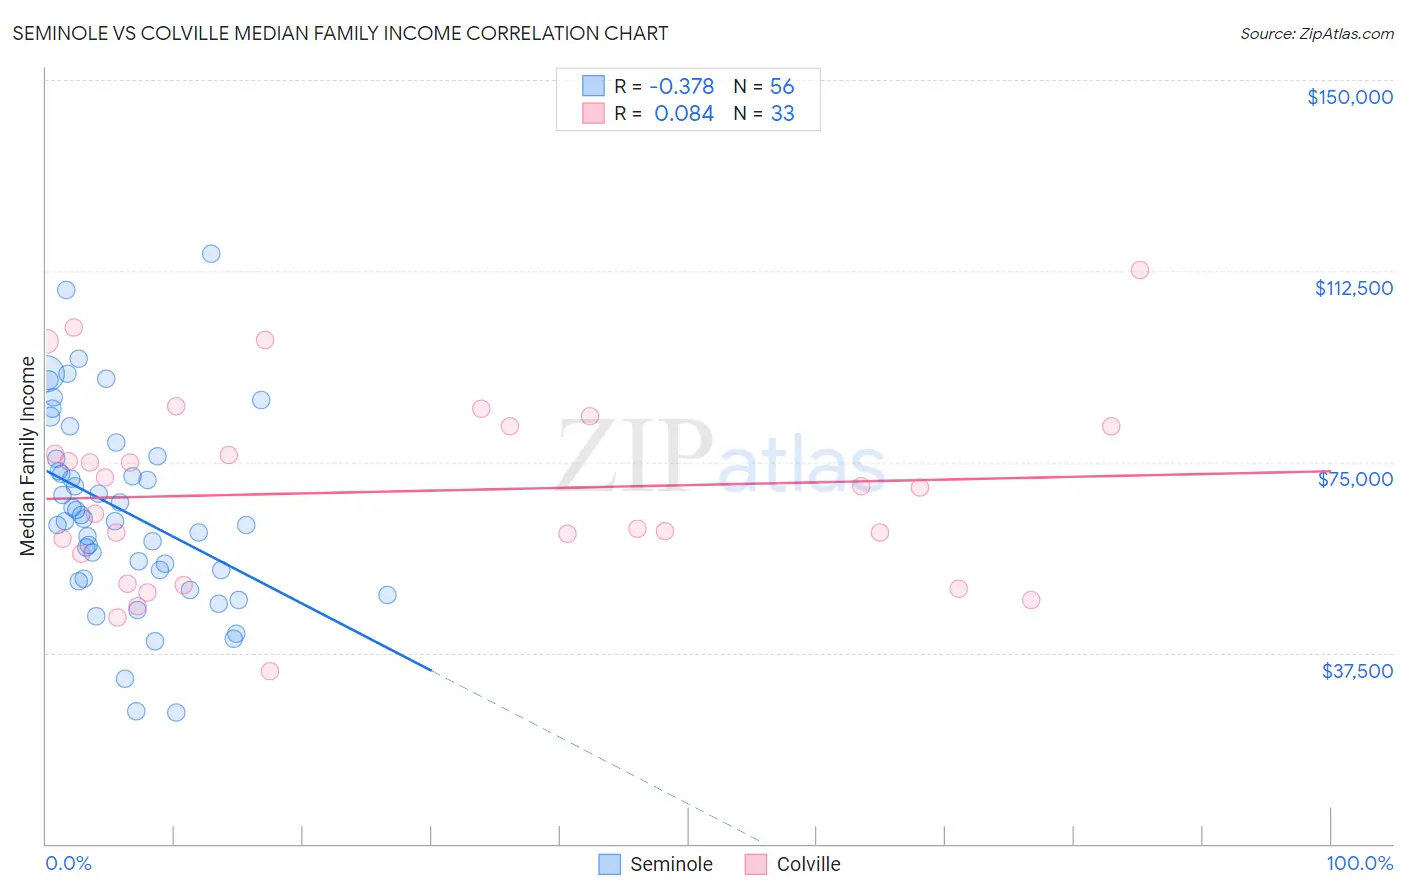
Seminole vs Colville Median Family Income Correlation Chart
The statistical analysis conducted on geographies consisting of 118,293,158 people shows a mild negative correlation between the proportion of Seminole and median family income in the United States with a correlation coefficient (R) of -0.378 and weighted average of $83,354. Similarly, the statistical analysis conducted on geographies consisting of 34,680,416 people shows a slight positive correlation between the proportion of Colville and median family income in the United States with a correlation coefficient (R) of 0.084 and weighted average of $85,792, a difference of 2.9%.
Median Family Income Correlation Summary
| Measurement | Seminole | Colville |
| Minimum | $25,806 | $33,824 |
| Maximum | $115,976 | $112,639 |
| Range | $90,170 | $78,815 |
| Mean | $65,304 | $69,185 |
| Median | $63,647 | $70,000 |
| Interquartile 25% (IQ1) | $52,915 | $53,997 |
| Interquartile 75% (IQ3) | $75,846 | $82,061 |
| Interquartile Range (IQR) | $22,930 | $28,064 |
| Standard Deviation (Sample) | $19,025 | $18,382 |
| Standard Deviation (Population) | $18,855 | $18,102 |
Demographics Similar to Seminole and Colville by Median Family Income
In terms of median family income, the demographic groups most similar to Seminole are Immigrants from Honduras ($83,618, a difference of 0.32%), Immigrants from Mexico ($83,639, a difference of 0.34%), Yakama ($83,932, a difference of 0.69%), Immigrants from Haiti ($84,018, a difference of 0.80%), and Apache ($84,451, a difference of 1.3%). Similarly, the demographic groups most similar to Colville are Spanish American Indian ($85,728, a difference of 0.070%), Hispanic or Latino ($85,647, a difference of 0.17%), Mexican ($85,618, a difference of 0.20%), Paiute ($85,414, a difference of 0.44%), and Immigrants from Dominica ($85,411, a difference of 0.45%).
| Demographics | Rating | Rank | Median Family Income |
| Ottawa | 0.0 /100 | #300 | Tragic $86,380 |
| Colville | 0.0 /100 | #301 | Tragic $85,792 |
| Spanish American Indians | 0.0 /100 | #302 | Tragic $85,728 |
| Hispanics or Latinos | 0.0 /100 | #303 | Tragic $85,647 |
| Mexicans | 0.0 /100 | #304 | Tragic $85,618 |
| Paiute | 0.0 /100 | #305 | Tragic $85,414 |
| Immigrants | Dominica | 0.0 /100 | #306 | Tragic $85,411 |
| Chickasaw | 0.0 /100 | #307 | Tragic $85,356 |
| U.S. Virgin Islanders | 0.0 /100 | #308 | Tragic $85,294 |
| Haitians | 0.0 /100 | #309 | Tragic $85,218 |
| Immigrants | Central America | 0.0 /100 | #310 | Tragic $85,050 |
| Hondurans | 0.0 /100 | #311 | Tragic $85,004 |
| Cubans | 0.0 /100 | #312 | Tragic $84,981 |
| Choctaw | 0.0 /100 | #313 | Tragic $84,835 |
| Immigrants | Bahamas | 0.0 /100 | #314 | Tragic $84,732 |
| Apache | 0.0 /100 | #315 | Tragic $84,451 |
| Immigrants | Haiti | 0.0 /100 | #316 | Tragic $84,018 |
| Yakama | 0.0 /100 | #317 | Tragic $83,932 |
| Immigrants | Mexico | 0.0 /100 | #318 | Tragic $83,639 |
| Immigrants | Honduras | 0.0 /100 | #319 | Tragic $83,618 |
| Seminole | 0.0 /100 | #320 | Tragic $83,354 |