Tongan vs Immigrants from Cuba Median Earnings
COMPARE
Tongan
Immigrants from Cuba
Median Earnings
Median Earnings Comparison
Tongans
Immigrants from Cuba
$45,665
MEDIAN EARNINGS
25.4/ 100
METRIC RATING
205th/ 347
METRIC RANK
$38,426
MEDIAN EARNINGS
0.0/ 100
METRIC RATING
337th/ 347
METRIC RANK
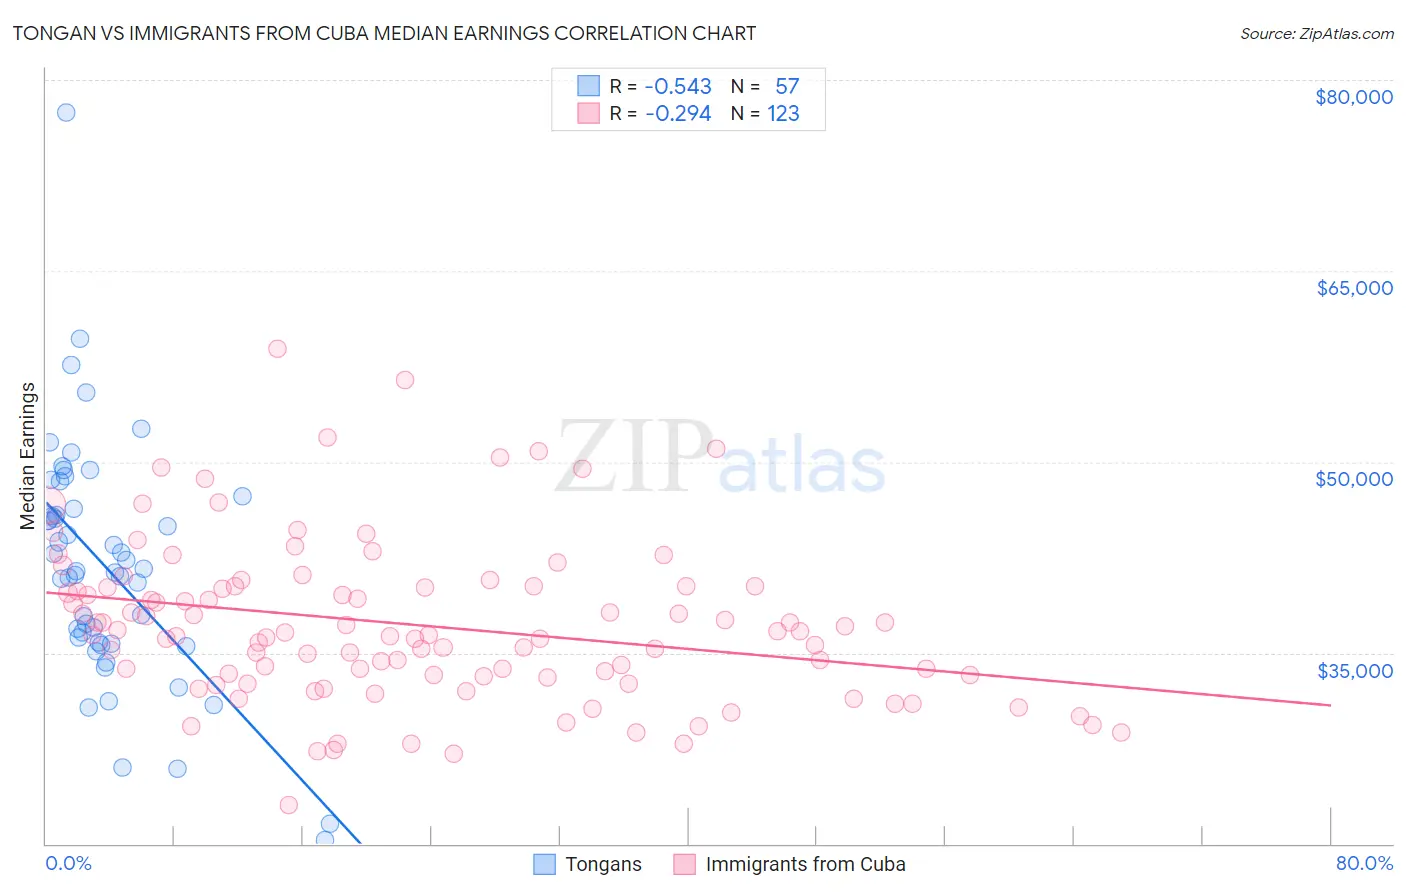
Tongan vs Immigrants from Cuba Median Earnings Correlation Chart
The statistical analysis conducted on geographies consisting of 102,906,626 people shows a substantial negative correlation between the proportion of Tongans and median earnings in the United States with a correlation coefficient (R) of -0.543 and weighted average of $45,665. Similarly, the statistical analysis conducted on geographies consisting of 326,004,649 people shows a weak negative correlation between the proportion of Immigrants from Cuba and median earnings in the United States with a correlation coefficient (R) of -0.294 and weighted average of $38,426, a difference of 18.8%.
Median Earnings Correlation Summary
| Measurement | Tongan | Immigrants from Cuba |
| Minimum | $20,292 | $23,000 |
| Maximum | $77,441 | $58,885 |
| Range | $57,149 | $35,885 |
| Mean | $41,730 | $37,187 |
| Median | $41,421 | $36,411 |
| Interquartile 25% (IQ1) | $35,786 | $33,147 |
| Interquartile 75% (IQ3) | $46,789 | $40,226 |
| Interquartile Range (IQR) | $11,003 | $7,079 |
| Standard Deviation (Sample) | $9,523 | $6,277 |
| Standard Deviation (Population) | $9,439 | $6,251 |
Similar Demographics by Median Earnings
Demographics Similar to Tongans by Median Earnings
In terms of median earnings, the demographic groups most similar to Tongans are Immigrants from Uruguay ($45,682, a difference of 0.040%), Immigrants from Ghana ($45,641, a difference of 0.050%), Welsh ($45,710, a difference of 0.10%), Immigrants from Senegal ($45,611, a difference of 0.12%), and Immigrants from Trinidad and Tobago ($45,729, a difference of 0.14%).
| Demographics | Rating | Rank | Median Earnings |
| Trinidadians and Tobagonians | 29.7 /100 | #198 | Fair $45,820 |
| Immigrants | Barbados | 29.6 /100 | #199 | Fair $45,816 |
| Immigrants | Azores | 29.5 /100 | #200 | Fair $45,812 |
| Celtics | 27.2 /100 | #201 | Fair $45,732 |
| Immigrants | Trinidad and Tobago | 27.1 /100 | #202 | Fair $45,729 |
| Welsh | 26.6 /100 | #203 | Fair $45,710 |
| Immigrants | Uruguay | 25.9 /100 | #204 | Fair $45,682 |
| Tongans | 25.4 /100 | #205 | Fair $45,665 |
| Immigrants | Ghana | 24.8 /100 | #206 | Fair $45,641 |
| Immigrants | Senegal | 24.0 /100 | #207 | Fair $45,611 |
| Immigrants | Bosnia and Herzegovina | 23.7 /100 | #208 | Fair $45,600 |
| Immigrants | Thailand | 23.7 /100 | #209 | Fair $45,598 |
| Immigrants | Grenada | 23.6 /100 | #210 | Fair $45,596 |
| Panamanians | 23.5 /100 | #211 | Fair $45,593 |
| Bermudans | 23.5 /100 | #212 | Fair $45,593 |
Demographics Similar to Immigrants from Cuba by Median Earnings
In terms of median earnings, the demographic groups most similar to Immigrants from Cuba are Pima ($38,285, a difference of 0.37%), Crow ($38,707, a difference of 0.73%), Native/Alaskan ($38,896, a difference of 1.2%), Spanish American Indian ($38,907, a difference of 1.3%), and Houma ($38,949, a difference of 1.4%).
| Demographics | Rating | Rank | Median Earnings |
| Immigrants | Congo | 0.0 /100 | #330 | Tragic $39,169 |
| Immigrants | Mexico | 0.0 /100 | #331 | Tragic $39,114 |
| Yakama | 0.0 /100 | #332 | Tragic $39,107 |
| Houma | 0.0 /100 | #333 | Tragic $38,949 |
| Spanish American Indians | 0.0 /100 | #334 | Tragic $38,907 |
| Natives/Alaskans | 0.0 /100 | #335 | Tragic $38,896 |
| Crow | 0.0 /100 | #336 | Tragic $38,707 |
| Immigrants | Cuba | 0.0 /100 | #337 | Tragic $38,426 |
| Pima | 0.0 /100 | #338 | Tragic $38,285 |
| Menominee | 0.0 /100 | #339 | Tragic $37,884 |
| Navajo | 0.0 /100 | #340 | Tragic $36,999 |
| Lumbee | 0.0 /100 | #341 | Tragic $36,876 |
| Hopi | 0.0 /100 | #342 | Tragic $36,871 |
| Pueblo | 0.0 /100 | #343 | Tragic $36,859 |
| Arapaho | 0.0 /100 | #344 | Tragic $36,586 |