Tongan vs Belizean Median Earnings
COMPARE
Tongan
Belizean
Median Earnings
Median Earnings Comparison
Tongans
Belizeans
$45,665
MEDIAN EARNINGS
25.4/ 100
METRIC RATING
205th/ 347
METRIC RANK
$42,702
MEDIAN EARNINGS
0.5/ 100
METRIC RATING
269th/ 347
METRIC RANK
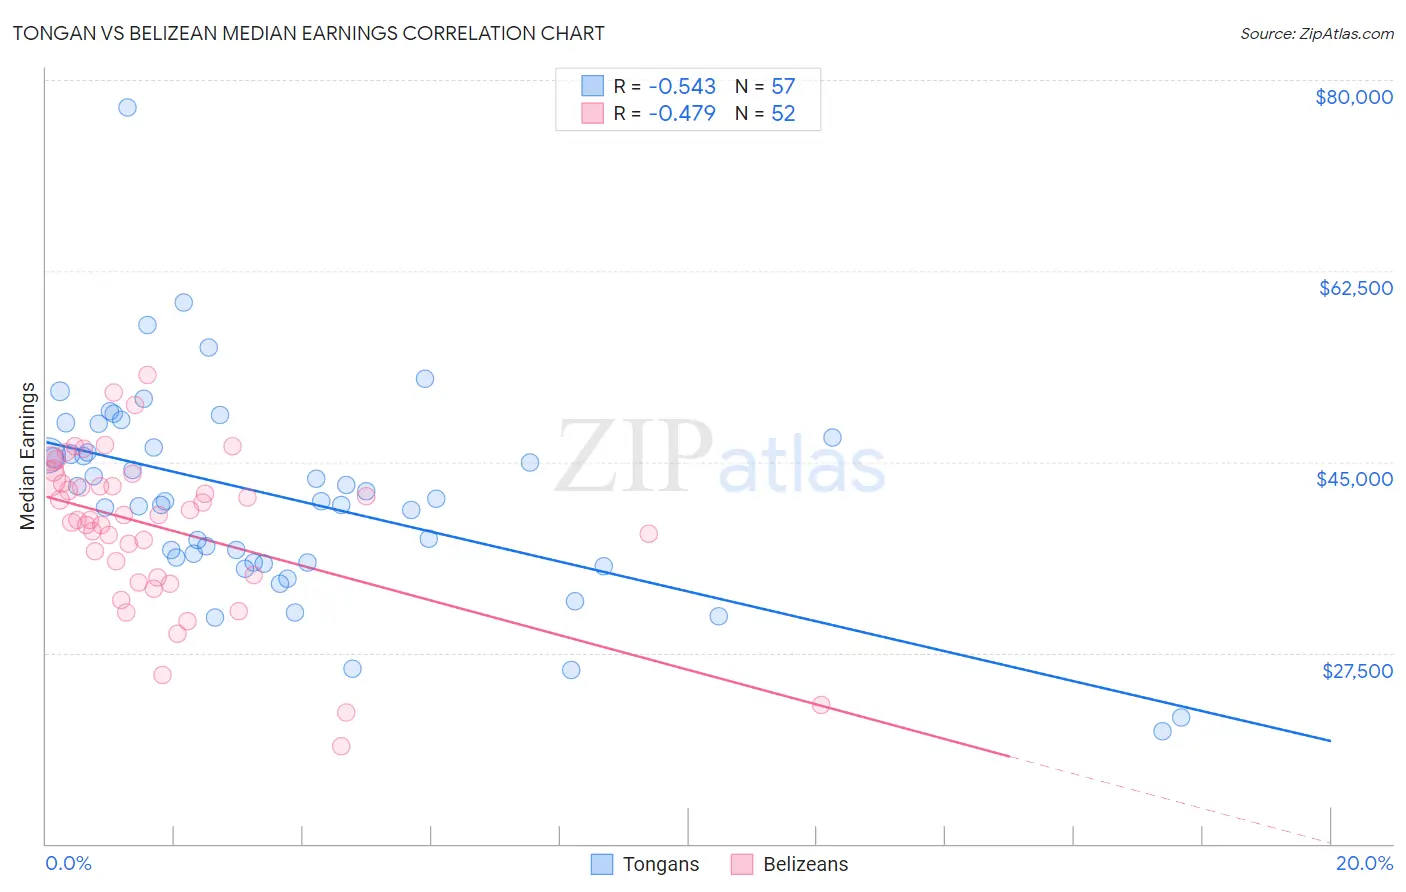
Tongan vs Belizean Median Earnings Correlation Chart
The statistical analysis conducted on geographies consisting of 102,906,626 people shows a substantial negative correlation between the proportion of Tongans and median earnings in the United States with a correlation coefficient (R) of -0.543 and weighted average of $45,665. Similarly, the statistical analysis conducted on geographies consisting of 144,215,704 people shows a moderate negative correlation between the proportion of Belizeans and median earnings in the United States with a correlation coefficient (R) of -0.479 and weighted average of $42,702, a difference of 6.9%.
Median Earnings Correlation Summary
| Measurement | Tongan | Belizean |
| Minimum | $20,292 | $18,932 |
| Maximum | $77,441 | $52,967 |
| Range | $57,149 | $34,035 |
| Mean | $41,730 | $38,949 |
| Median | $41,421 | $39,910 |
| Interquartile 25% (IQ1) | $35,786 | $34,513 |
| Interquartile 75% (IQ3) | $46,789 | $43,245 |
| Interquartile Range (IQR) | $11,003 | $8,732 |
| Standard Deviation (Sample) | $9,523 | $7,165 |
| Standard Deviation (Population) | $9,439 | $7,096 |
Similar Demographics by Median Earnings
Demographics Similar to Tongans by Median Earnings
In terms of median earnings, the demographic groups most similar to Tongans are Immigrants from Uruguay ($45,682, a difference of 0.040%), Immigrants from Ghana ($45,641, a difference of 0.050%), Welsh ($45,710, a difference of 0.10%), Immigrants from Senegal ($45,611, a difference of 0.12%), and Immigrants from Trinidad and Tobago ($45,729, a difference of 0.14%).
| Demographics | Rating | Rank | Median Earnings |
| Trinidadians and Tobagonians | 29.7 /100 | #198 | Fair $45,820 |
| Immigrants | Barbados | 29.6 /100 | #199 | Fair $45,816 |
| Immigrants | Azores | 29.5 /100 | #200 | Fair $45,812 |
| Celtics | 27.2 /100 | #201 | Fair $45,732 |
| Immigrants | Trinidad and Tobago | 27.1 /100 | #202 | Fair $45,729 |
| Welsh | 26.6 /100 | #203 | Fair $45,710 |
| Immigrants | Uruguay | 25.9 /100 | #204 | Fair $45,682 |
| Tongans | 25.4 /100 | #205 | Fair $45,665 |
| Immigrants | Ghana | 24.8 /100 | #206 | Fair $45,641 |
| Immigrants | Senegal | 24.0 /100 | #207 | Fair $45,611 |
| Immigrants | Bosnia and Herzegovina | 23.7 /100 | #208 | Fair $45,600 |
| Immigrants | Thailand | 23.7 /100 | #209 | Fair $45,598 |
| Immigrants | Grenada | 23.6 /100 | #210 | Fair $45,596 |
| Panamanians | 23.5 /100 | #211 | Fair $45,593 |
| Bermudans | 23.5 /100 | #212 | Fair $45,593 |
Demographics Similar to Belizeans by Median Earnings
In terms of median earnings, the demographic groups most similar to Belizeans are American ($42,742, a difference of 0.090%), Osage ($42,651, a difference of 0.12%), Cree ($42,777, a difference of 0.17%), Pennsylvania German ($42,615, a difference of 0.21%), and Immigrants from Laos ($42,884, a difference of 0.43%).
| Demographics | Rating | Rank | Median Earnings |
| Nicaraguans | 0.8 /100 | #262 | Tragic $43,026 |
| Inupiat | 0.8 /100 | #263 | Tragic $43,000 |
| Immigrants | Liberia | 0.7 /100 | #264 | Tragic $42,923 |
| Salvadorans | 0.7 /100 | #265 | Tragic $42,912 |
| Immigrants | Laos | 0.7 /100 | #266 | Tragic $42,884 |
| Cree | 0.6 /100 | #267 | Tragic $42,777 |
| Americans | 0.6 /100 | #268 | Tragic $42,742 |
| Belizeans | 0.5 /100 | #269 | Tragic $42,702 |
| Osage | 0.5 /100 | #270 | Tragic $42,651 |
| Pennsylvania Germans | 0.5 /100 | #271 | Tragic $42,615 |
| Iroquois | 0.4 /100 | #272 | Tragic $42,430 |
| Immigrants | Dominica | 0.4 /100 | #273 | Tragic $42,420 |
| Immigrants | El Salvador | 0.4 /100 | #274 | Tragic $42,413 |
| Immigrants | Belize | 0.3 /100 | #275 | Tragic $42,339 |
| Spanish Americans | 0.3 /100 | #276 | Tragic $42,316 |