Tlingit-Haida vs Yakama Householder Income Over 65 years

COMPARE

Tlingit-Haida
Race
Ancestry
AfghanAfricanAlaska NativeAlaskan AthabascanAlbanianAleutAlsatianAmericanApacheArabArapahoArgentineanArmenianAssyrian/Chaldean/SyriacAustralianAustrianBahamianBangladeshiBarbadianBasqueBelgianBelizeanBermudanBhutaneseBlackfeetBolivianBrazilianBritishBritish West IndianBulgarianBurmeseCajunCambodianCanadianCape VerdeanCarpatho RusynCelticCentral AmericanCentral American IndianCherokeeCheyenneChickasawChileanChineseChippewaChoctawColombianColvilleComancheCosta RicanCreeCreekCroatianCrowCubanCypriotCzechCzechoslovakianDanishDelawareDominicanDutchDutch West IndianEastern EuropeanEcuadorianEgyptianEnglishEstonianEthiopianEuropeanFijianFilipinoFinnishFrenchFrench American IndianFrench CanadianGermanGerman RussianGhanaianGreekGuamanian/ChamorroGuatemalanGuyaneseHaitianHmongHonduranHopiHoumaHungarianIcelanderIndian (Asian)IndonesianInupiatIranianIraqiIrishIroquoisIsraeliItalianJamaicanJapaneseJordanianKenyanKiowaKoreanLaotianLatvianLebaneseLiberianLithuanianLumbeeLuxembourgerMacedonianMalaysianMalteseMarshalleseMenomineeMexicanMexican American IndianMongolianMoroccanNative HawaiianNavajoNepaleseNew ZealanderNicaraguanNigerianNorthern EuropeanNorwegianOkinawanOsageOttawaPaiutePakistaniPalestinianPanamanianParaguayanPennsylvania GermanPeruvianPimaPolishPortuguesePotawatomiPuebloPuerto RicanPuget Sound SalishRomanianRussianSalvadoranSamoanScandinavianScotch-IrishScottishSeminoleSenegaleseSerbianShoshoneSierra LeoneanSiouxSlavicSlovakSloveneSomaliSouth AfricanSouth AmericanSouth American IndianSoviet UnionSpaniardSpanishSpanish AmericanSpanish American IndianSri LankanSubsaharan AfricanSudaneseSwedishSwissSyrianTaiwaneseThaiTlingit-HaidaTohono O'OdhamTonganTrinidadian and TobagonianTsimshianTurkishU.S. Virgin IslanderUgandanUkrainianUruguayanUteVenezuelanVietnameseWelshWest IndianYaquiYugoslavianYumanYup'ikZimbabwean
Immigration
NonimmigrantsImmigrantsAfghanistanAfricaAlbaniaArgentinaArmeniaAsiaAustraliaAustriaBahamasBangladeshBarbadosBelarusBelgiumBelizeBoliviaBosnia and HerzegovinaBrazilBulgariaBurma/MyanmarCabo VerdeCambodiaCameroonCanadaCaribbeanCentral AmericaChileChinaColombiaCongoCosta RicaCroatiaCubaCzechoslovakiaDenmarkDominicaDominican RepublicEastern AfricaEastern AsiaEastern EuropeEcuadorEgyptEl SalvadorEnglandEritreaEthiopiaEuropeFijiFranceGermanyGhanaGreeceGrenadaGuatemalaGuyanaHaitiHondurasHong KongHungaryIndiaIndonesiaIranIraqIrelandIsraelItalyJamaicaJapanJordanKazakhstanKenyaKoreaKuwaitLaosLatin AmericaLatviaLebanonLiberiaLithuaniaMalaysiaMexicoMicronesiaMiddle AfricaMoldovaMoroccoNepalNetherlandsNicaraguaNigeriaNorth AmericaNorth MacedoniaNorthern AfricaNorthern EuropeNorwayOceaniaPakistanPanamaPeruPhilippinesPolandPortugalRomaniaRussiaSaudi ArabiaScotlandSenegalSerbiaSierra LeoneSingaporeSomaliaSouth AfricaSouth AmericaSouth Central AsiaSouth Eastern AsiaSouthern EuropeSpainSri LankaSt. Vincent and the GrenadinesSudanSwedenSwitzerlandSyriaTaiwanThailandTrinidad and TobagoTurkeyUgandaUkraineUruguayUzbekistanVenezuelaVietnamWest IndiesWestern AfricaWestern AsiaWestern EuropeYemenZaireZimbabweAzores
Yakama
Race
Ancestry
AfghanAfricanAlaska NativeAlaskan AthabascanAlbanianAleutAlsatianAmericanApacheArabArapahoArgentineanArmenianAssyrian/Chaldean/SyriacAustralianAustrianBahamianBangladeshiBarbadianBasqueBelgianBelizeanBermudanBhutaneseBlackfeetBolivianBrazilianBritishBritish West IndianBulgarianBurmeseCajunCambodianCanadianCape VerdeanCarpatho RusynCelticCentral AmericanCentral American IndianCherokeeCheyenneChickasawChileanChineseChippewaChoctawColombianColvilleComancheCosta RicanCreeCreekCroatianCrowCubanCypriotCzechCzechoslovakianDanishDelawareDominicanDutchDutch West IndianEastern EuropeanEcuadorianEgyptianEnglishEstonianEthiopianEuropeanFijianFilipinoFinnishFrenchFrench American IndianFrench CanadianGermanGerman RussianGhanaianGreekGuamanian/ChamorroGuatemalanGuyaneseHaitianHmongHonduranHopiHoumaHungarianIcelanderIndian (Asian)IndonesianInupiatIranianIraqiIrishIroquoisIsraeliItalianJamaicanJapaneseJordanianKenyanKiowaKoreanLaotianLatvianLebaneseLiberianLithuanianLumbeeLuxembourgerMacedonianMalaysianMalteseMarshalleseMenomineeMexicanMexican American IndianMongolianMoroccanNative HawaiianNavajoNepaleseNew ZealanderNicaraguanNigerianNorthern EuropeanNorwegianOkinawanOsageOttawaPaiutePakistaniPalestinianPanamanianParaguayanPennsylvania GermanPeruvianPimaPolishPortuguesePotawatomiPuebloPuerto RicanPuget Sound SalishRomanianRussianSalvadoranSamoanScandinavianScotch-IrishScottishSeminoleSenegaleseSerbianShoshoneSierra LeoneanSiouxSlavicSlovakSloveneSomaliSouth AfricanSouth AmericanSouth American IndianSoviet UnionSpaniardSpanishSpanish AmericanSpanish American IndianSri LankanSubsaharan AfricanSudaneseSwedishSwissSyrianTaiwaneseThaiTohono O'OdhamTonganTrinidadian and TobagonianTsimshianTurkishU.S. Virgin IslanderUgandanUkrainianUruguayanUteVenezuelanVietnameseWelshWest IndianYakamaYaquiYugoslavianYumanYup'ikZimbabwean
Immigration
NonimmigrantsImmigrantsAfghanistanAfricaAlbaniaArgentinaArmeniaAsiaAustraliaAustriaBahamasBangladeshBarbadosBelarusBelgiumBelizeBoliviaBosnia and HerzegovinaBrazilBulgariaBurma/MyanmarCabo VerdeCambodiaCameroonCanadaCaribbeanCentral AmericaChileChinaColombiaCongoCosta RicaCroatiaCubaCzechoslovakiaDenmarkDominicaDominican RepublicEastern AfricaEastern AsiaEastern EuropeEcuadorEgyptEl SalvadorEnglandEritreaEthiopiaEuropeFijiFranceGermanyGhanaGreeceGrenadaGuatemalaGuyanaHaitiHondurasHong KongHungaryIndiaIndonesiaIranIraqIrelandIsraelItalyJamaicaJapanJordanKazakhstanKenyaKoreaKuwaitLaosLatin AmericaLatviaLebanonLiberiaLithuaniaMalaysiaMexicoMicronesiaMiddle AfricaMoldovaMoroccoNepalNetherlandsNicaraguaNigeriaNorth AmericaNorth MacedoniaNorthern AfricaNorthern EuropeNorwayOceaniaPakistanPanamaPeruPhilippinesPolandPortugalRomaniaRussiaSaudi ArabiaScotlandSenegalSerbiaSierra LeoneSingaporeSomaliaSouth AfricaSouth AmericaSouth Central AsiaSouth Eastern AsiaSouthern EuropeSpainSri LankaSt. Vincent and the GrenadinesSudanSwedenSwitzerlandSyriaTaiwanThailandTrinidad and TobagoTurkeyUgandaUkraineUruguayUzbekistanVenezuelaVietnamWest IndiesWestern AfricaWestern AsiaWestern EuropeYemenZaireZimbabweAzores
Householder Income Over 65 years
Income
Poverty
Unemployment
Labor Participation
Family Structure
Vehicle Availability
Education Level
Disability

Householder Income Over 65 years Comparison

Tlingit-Haida

Yakama

Excellent
Tragic
$62,922
HOUSEHOLDER INCOME OVER 65 YEARS
88.6/ 100
METRIC RATING
123rd/ 347
METRIC RANK
$56,234
HOUSEHOLDER INCOME OVER 65 YEARS
0.7/ 100
METRIC RATING
247th/ 347
METRIC RANK

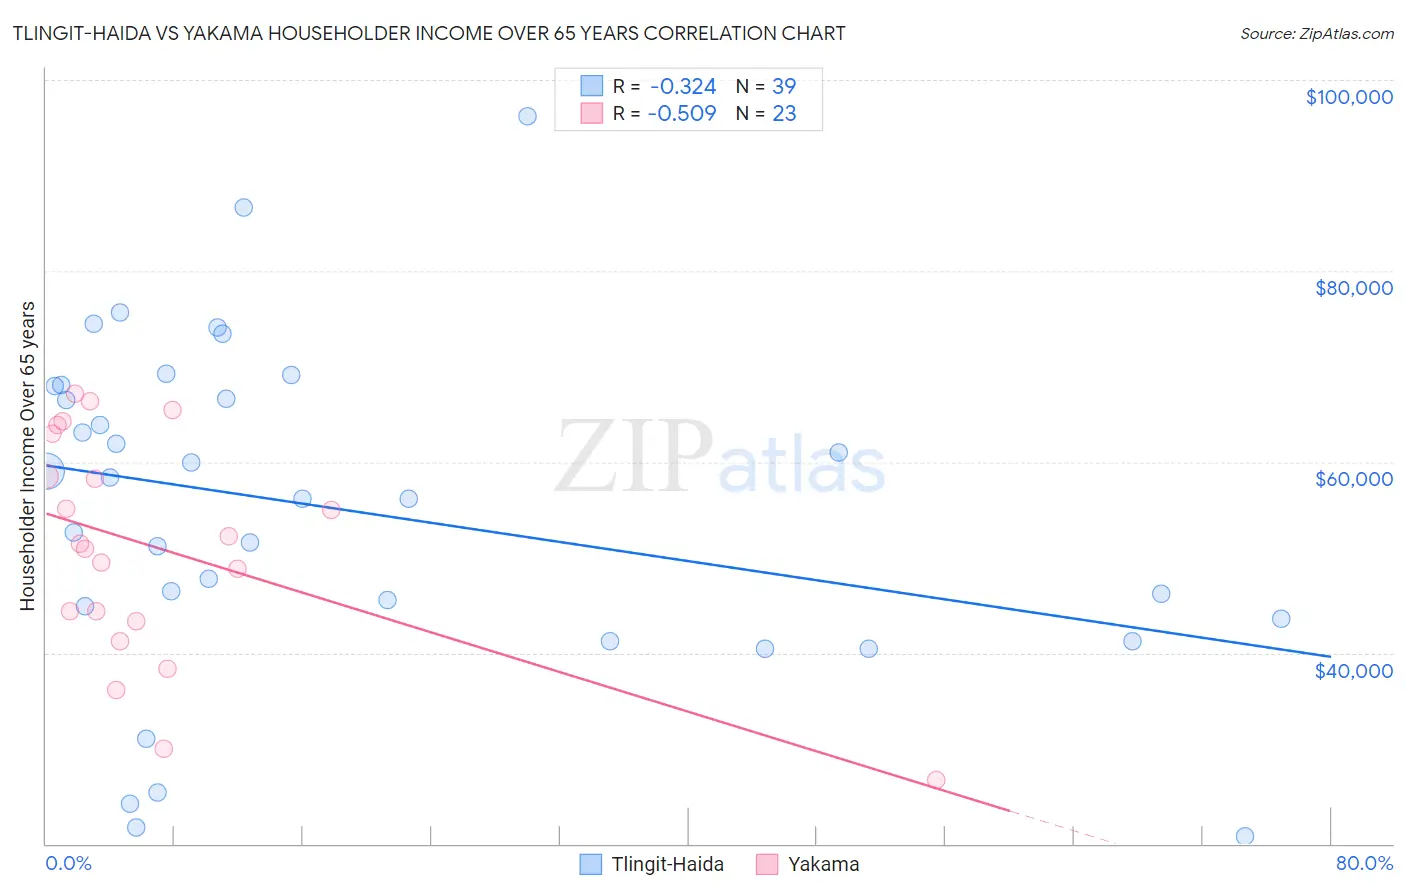
Tlingit-Haida vs Yakama Householder Income Over 65 years Correlation Chart

The statistical analysis conducted on geographies consisting of 60,750,081 people shows a mild negative correlation between the proportion of Tlingit-Haida and household income with householder over the age of 65 in the United States with a correlation coefficient (R) of -0.324 and weighted average of $62,922. Similarly, the statistical analysis conducted on geographies consisting of 19,889,958 people shows a substantial negative correlation between the proportion of Yakama and household income with householder over the age of 65 in the United States with a correlation coefficient (R) of -0.509 and weighted average of $56,234, a difference of 11.9%.
Tlingit-Haida vs Yakama Householder Income Over 65 years

Householder Income Over 65 years Correlation Summary

MeasurementTlingit-HaidaYakama
Minimum$20,833$26,667
Maximum$96,250$67,099
Range$75,417$40,432
Mean$54,963$51,039
Median$56,173$51,401
Interquartile 25% (IQ1)$43,571$43,321
Interquartile 75% (IQ3)$67,937$62,905
Interquartile Range (IQR)$24,366$19,584
Standard Deviation (Sample)$17,428$11,672
Standard Deviation (Population)$17,203$11,415

Similar Demographics by Householder Income Over 65 years

Demographics Similar to Tlingit-Haida by Householder Income Over 65 years

In terms of householder income over 65 years, the demographic groups most similar to Tlingit-Haida are Immigrants from Moldova ($62,939, a difference of 0.030%), Taiwanese ($62,894, a difference of 0.040%), Soviet Union ($62,848, a difference of 0.12%), Immigrants from Vietnam ($63,014, a difference of 0.15%), and Ukrainian ($63,032, a difference of 0.18%).
DemographicsRating | RankHouseholder Income Over 65 years
Guamanians/Chamorros
91.1
/100
|
#116
Exceptional
$63,187
Immigrants | Croatia
90.9
/100
|
#117
Exceptional
$63,168
Danes
90.5
/100
|
#118
Exceptional
$63,117
Immigrants | Jordan
89.8
/100
|
#119
Excellent
$63,041
Ukrainians
89.7
/100
|
#120
Excellent
$63,032
Immigrants | Vietnam
89.5
/100
|
#121
Excellent
$63,014
Immigrants | Moldova
88.7
/100
|
#122
Excellent
$62,939
Tlingit-Haida
88.6
/100
|
#123
Excellent
$62,922
Taiwanese
88.3
/100
|
#124
Excellent
$62,894
Soviet Union
87.8
/100
|
#125
Excellent
$62,848
Peruvians
86.8
/100
|
#126
Excellent
$62,766
Swedes
86.4
/100
|
#127
Excellent
$62,736
Aleuts
86.1
/100
|
#128
Excellent
$62,708
Immigrants | Eastern Europe
85.9
/100
|
#129
Excellent
$62,693
Basques
85.4
/100
|
#130
Excellent
$62,653

Demographics Similar to Yakama by Householder Income Over 65 years

In terms of householder income over 65 years, the demographic groups most similar to Yakama are Central American ($56,321, a difference of 0.15%), Vietnamese ($56,143, a difference of 0.16%), Immigrants from Uzbekistan ($56,331, a difference of 0.17%), Hmong ($56,339, a difference of 0.19%), and Guyanese ($56,351, a difference of 0.21%).
DemographicsRating | RankHouseholder Income Over 65 years
Sub-Saharan Africans
1.0
/100
|
#240
Tragic
$56,615
Immigrants | Guyana
0.9
/100
|
#241
Tragic
$56,495
Yaqui
0.8
/100
|
#242
Tragic
$56,417
Guyanese
0.8
/100
|
#243
Tragic
$56,351
Hmong
0.8
/100
|
#244
Tragic
$56,339
Immigrants | Uzbekistan
0.8
/100
|
#245
Tragic
$56,331
Central Americans
0.8
/100
|
#246
Tragic
$56,321
Yakama
0.7
/100
|
#247
Tragic
$56,234
Vietnamese
0.6
/100
|
#248
Tragic
$56,143
Mexican American Indians
0.6
/100
|
#249
Tragic
$56,089
Immigrants | Bosnia and Herzegovina
0.5
/100
|
#250
Tragic
$55,986
Immigrants | Portugal
0.5
/100
|
#251
Tragic
$55,924
Osage
0.4
/100
|
#252
Tragic
$55,677
Immigrants | Trinidad and Tobago
0.4
/100
|
#253
Tragic
$55,598
Americans
0.3
/100
|
#254
Tragic
$55,527