Tlingit-Haida vs Iranian Householder Income Over 65 years
COMPARE
Tlingit-Haida
Iranian
Householder Income Over 65 years
Householder Income Over 65 years Comparison
Tlingit-Haida
Iranians
$62,922
HOUSEHOLDER INCOME OVER 65 YEARS
88.6/ 100
METRIC RATING
123rd/ 347
METRIC RANK
$77,429
HOUSEHOLDER INCOME OVER 65 YEARS
100.0/ 100
METRIC RATING
2nd/ 347
METRIC RANK
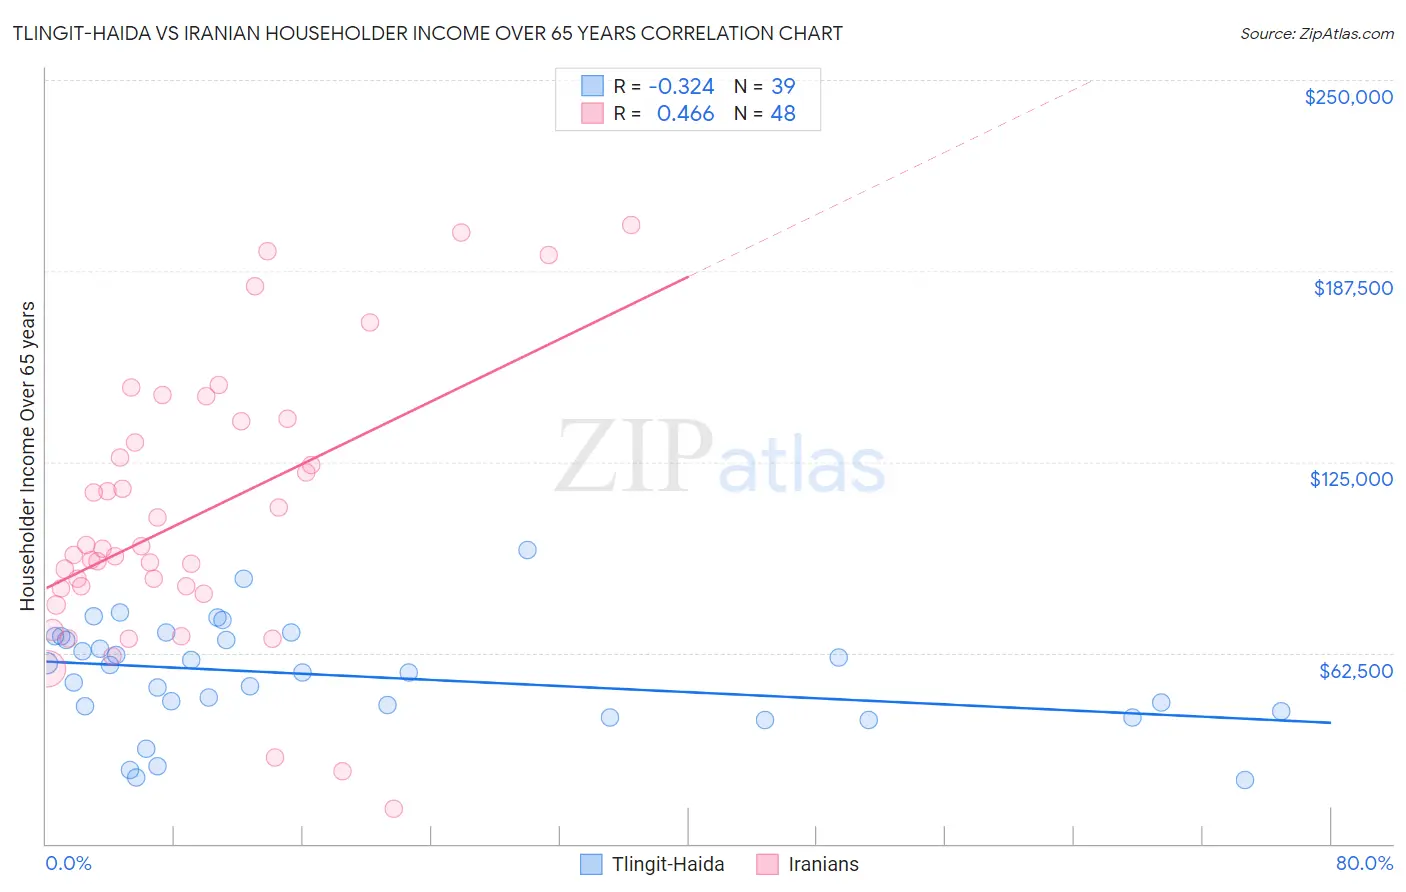
Tlingit-Haida vs Iranian Householder Income Over 65 years Correlation Chart
The statistical analysis conducted on geographies consisting of 60,750,081 people shows a mild negative correlation between the proportion of Tlingit-Haida and household income with householder over the age of 65 in the United States with a correlation coefficient (R) of -0.324 and weighted average of $62,922. Similarly, the statistical analysis conducted on geographies consisting of 316,043,836 people shows a moderate positive correlation between the proportion of Iranians and household income with householder over the age of 65 in the United States with a correlation coefficient (R) of 0.466 and weighted average of $77,429, a difference of 23.1%.
Householder Income Over 65 years Correlation Summary
| Measurement | Tlingit-Haida | Iranian |
| Minimum | $20,833 | $11,563 |
| Maximum | $96,250 | $202,500 |
| Range | $75,417 | $190,937 |
| Mean | $54,963 | $106,815 |
| Median | $56,173 | $95,602 |
| Interquartile 25% (IQ1) | $43,571 | $82,658 |
| Interquartile 75% (IQ3) | $67,937 | $134,972 |
| Interquartile Range (IQR) | $24,366 | $52,314 |
| Standard Deviation (Sample) | $17,428 | $44,529 |
| Standard Deviation (Population) | $17,203 | $44,062 |
Similar Demographics by Householder Income Over 65 years
Demographics Similar to Tlingit-Haida by Householder Income Over 65 years
In terms of householder income over 65 years, the demographic groups most similar to Tlingit-Haida are Immigrants from Moldova ($62,939, a difference of 0.030%), Taiwanese ($62,894, a difference of 0.040%), Soviet Union ($62,848, a difference of 0.12%), Immigrants from Vietnam ($63,014, a difference of 0.15%), and Ukrainian ($63,032, a difference of 0.18%).
| Demographics | Rating | Rank | Householder Income Over 65 years |
| Guamanians/Chamorros | 91.1 /100 | #116 | Exceptional $63,187 |
| Immigrants | Croatia | 90.9 /100 | #117 | Exceptional $63,168 |
| Danes | 90.5 /100 | #118 | Exceptional $63,117 |
| Immigrants | Jordan | 89.8 /100 | #119 | Excellent $63,041 |
| Ukrainians | 89.7 /100 | #120 | Excellent $63,032 |
| Immigrants | Vietnam | 89.5 /100 | #121 | Excellent $63,014 |
| Immigrants | Moldova | 88.7 /100 | #122 | Excellent $62,939 |
| Tlingit-Haida | 88.6 /100 | #123 | Excellent $62,922 |
| Taiwanese | 88.3 /100 | #124 | Excellent $62,894 |
| Soviet Union | 87.8 /100 | #125 | Excellent $62,848 |
| Peruvians | 86.8 /100 | #126 | Excellent $62,766 |
| Swedes | 86.4 /100 | #127 | Excellent $62,736 |
| Aleuts | 86.1 /100 | #128 | Excellent $62,708 |
| Immigrants | Eastern Europe | 85.9 /100 | #129 | Excellent $62,693 |
| Basques | 85.4 /100 | #130 | Excellent $62,653 |
Demographics Similar to Iranians by Householder Income Over 65 years
In terms of householder income over 65 years, the demographic groups most similar to Iranians are Chinese ($77,465, a difference of 0.050%), Immigrants from Taiwan ($77,051, a difference of 0.49%), Filipino ($76,686, a difference of 0.97%), Immigrants from Iran ($75,081, a difference of 3.1%), and Bolivian ($74,245, a difference of 4.3%).
| Demographics | Rating | Rank | Householder Income Over 65 years |
| Chinese | 100.0 /100 | #1 | Exceptional $77,465 |
| Iranians | 100.0 /100 | #2 | Exceptional $77,429 |
| Immigrants | Taiwan | 100.0 /100 | #3 | Exceptional $77,051 |
| Filipinos | 100.0 /100 | #4 | Exceptional $76,686 |
| Immigrants | Iran | 100.0 /100 | #5 | Exceptional $75,081 |
| Bolivians | 100.0 /100 | #6 | Exceptional $74,245 |
| Immigrants | Bolivia | 100.0 /100 | #7 | Exceptional $73,434 |
| Immigrants | Singapore | 100.0 /100 | #8 | Exceptional $72,963 |
| Immigrants | India | 100.0 /100 | #9 | Exceptional $72,804 |
| Bhutanese | 100.0 /100 | #10 | Exceptional $72,288 |
| Thais | 100.0 /100 | #11 | Exceptional $72,099 |
| Cypriots | 100.0 /100 | #12 | Exceptional $71,714 |
| Immigrants | Hong Kong | 100.0 /100 | #13 | Exceptional $71,567 |
| Burmese | 100.0 /100 | #14 | Exceptional $71,139 |
| Native Hawaiians | 100.0 /100 | #15 | Exceptional $71,021 |