Swiss vs Immigrants from Zaire Median Female Earnings
COMPARE
Swiss
Immigrants from Zaire
Median Female Earnings
Median Female Earnings Comparison
Swiss
Immigrants from Zaire
$37,904
MEDIAN FEMALE EARNINGS
2.3/ 100
METRIC RATING
249th/ 347
METRIC RANK
$36,017
MEDIAN FEMALE EARNINGS
0.0/ 100
METRIC RATING
288th/ 347
METRIC RANK
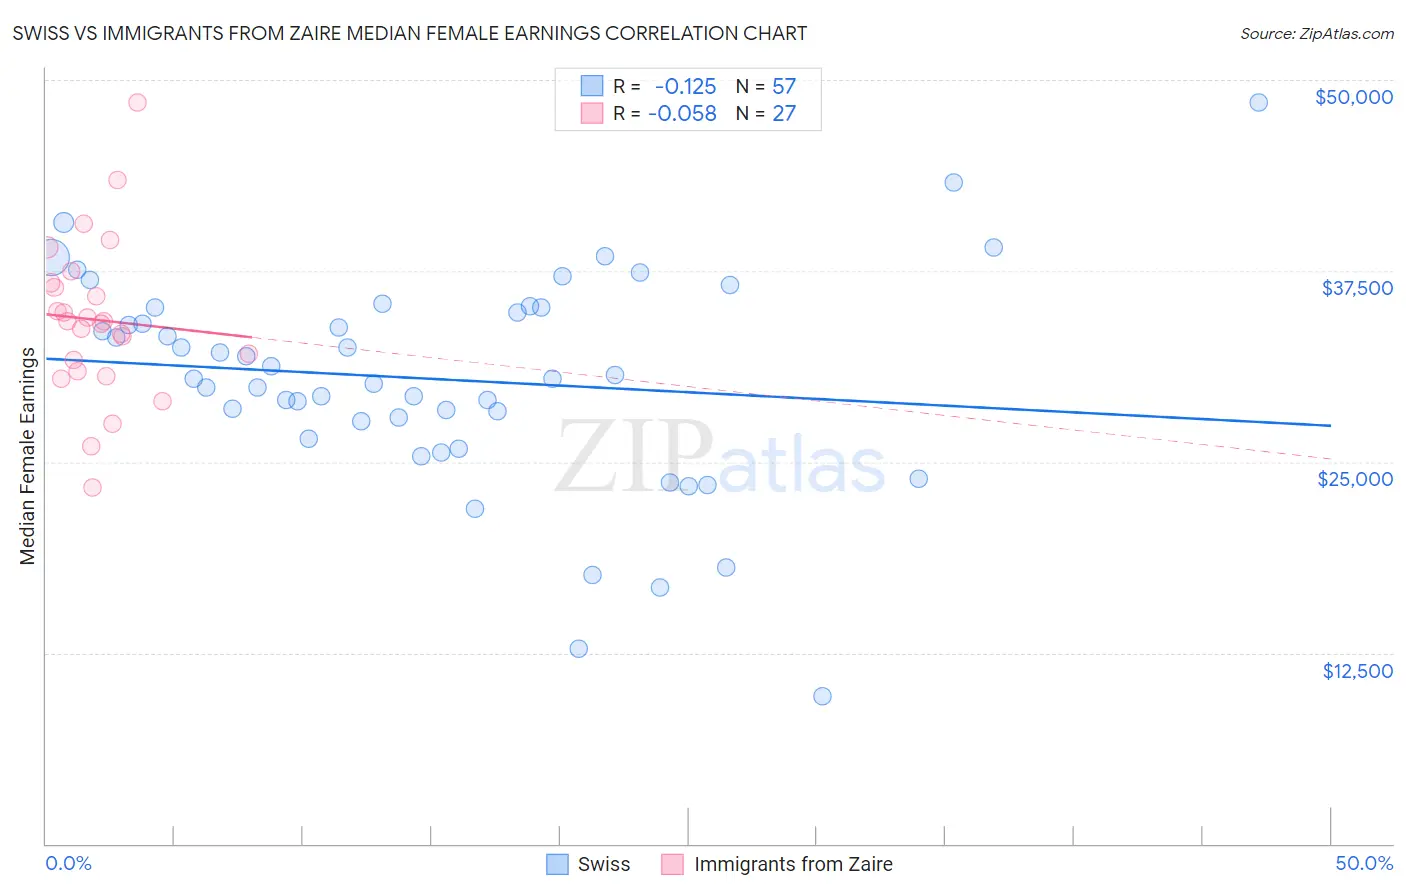
Swiss vs Immigrants from Zaire Median Female Earnings Correlation Chart
The statistical analysis conducted on geographies consisting of 464,484,716 people shows a poor negative correlation between the proportion of Swiss and median female earnings in the United States with a correlation coefficient (R) of -0.125 and weighted average of $37,904. Similarly, the statistical analysis conducted on geographies consisting of 107,241,232 people shows a slight negative correlation between the proportion of Immigrants from Zaire and median female earnings in the United States with a correlation coefficient (R) of -0.058 and weighted average of $36,017, a difference of 5.2%.
Median Female Earnings Correlation Summary
| Measurement | Swiss | Immigrants from Zaire |
| Minimum | $9,649 | $23,286 |
| Maximum | $48,533 | $48,487 |
| Range | $38,884 | $25,201 |
| Mean | $30,422 | $34,296 |
| Median | $30,468 | $34,189 |
| Interquartile 25% (IQ1) | $27,075 | $30,969 |
| Interquartile 75% (IQ3) | $35,111 | $36,705 |
| Interquartile Range (IQR) | $8,036 | $5,736 |
| Standard Deviation (Sample) | $7,120 | $5,243 |
| Standard Deviation (Population) | $7,057 | $5,145 |
Similar Demographics by Median Female Earnings
Demographics Similar to Swiss by Median Female Earnings
In terms of median female earnings, the demographic groups most similar to Swiss are Alaskan Athabascan ($37,905, a difference of 0.0%), Immigrants from Somalia ($37,914, a difference of 0.030%), Immigrants from Iraq ($37,864, a difference of 0.11%), Welsh ($37,856, a difference of 0.13%), and Immigrants from Middle Africa ($37,965, a difference of 0.16%).
| Demographics | Rating | Rank | Median Female Earnings |
| Immigrants | Burma/Myanmar | 3.0 /100 | #242 | Tragic $38,028 |
| Germans | 2.8 /100 | #243 | Tragic $37,986 |
| Immigrants | Liberia | 2.7 /100 | #244 | Tragic $37,970 |
| Immigrants | Middle Africa | 2.7 /100 | #245 | Tragic $37,965 |
| Delaware | 2.6 /100 | #246 | Tragic $37,964 |
| Immigrants | Somalia | 2.4 /100 | #247 | Tragic $37,914 |
| Alaskan Athabascans | 2.3 /100 | #248 | Tragic $37,905 |
| Swiss | 2.3 /100 | #249 | Tragic $37,904 |
| Immigrants | Iraq | 2.2 /100 | #250 | Tragic $37,864 |
| Welsh | 2.1 /100 | #251 | Tragic $37,856 |
| Immigrants | Dominica | 2.0 /100 | #252 | Tragic $37,825 |
| Danes | 1.6 /100 | #253 | Tragic $37,730 |
| Whites/Caucasians | 1.1 /100 | #254 | Tragic $37,531 |
| Colville | 1.1 /100 | #255 | Tragic $37,514 |
| Samoans | 1.0 /100 | #256 | Tragic $37,498 |
Demographics Similar to Immigrants from Zaire by Median Female Earnings
In terms of median female earnings, the demographic groups most similar to Immigrants from Zaire are Immigrants from Nicaragua ($36,023, a difference of 0.020%), Osage ($36,034, a difference of 0.050%), Paiute ($36,056, a difference of 0.11%), Bangladeshi ($35,960, a difference of 0.16%), and Central American Indian ($35,930, a difference of 0.24%).
| Demographics | Rating | Rank | Median Female Earnings |
| Spanish Americans | 0.1 /100 | #281 | Tragic $36,391 |
| Haitians | 0.1 /100 | #282 | Tragic $36,374 |
| Immigrants | Haiti | 0.1 /100 | #283 | Tragic $36,203 |
| Indonesians | 0.1 /100 | #284 | Tragic $36,140 |
| Paiute | 0.1 /100 | #285 | Tragic $36,056 |
| Osage | 0.0 /100 | #286 | Tragic $36,034 |
| Immigrants | Nicaragua | 0.0 /100 | #287 | Tragic $36,023 |
| Immigrants | Zaire | 0.0 /100 | #288 | Tragic $36,017 |
| Bangladeshis | 0.0 /100 | #289 | Tragic $35,960 |
| Central American Indians | 0.0 /100 | #290 | Tragic $35,930 |
| Blackfeet | 0.0 /100 | #291 | Tragic $35,864 |
| Americans | 0.0 /100 | #292 | Tragic $35,777 |
| Guatemalans | 0.0 /100 | #293 | Tragic $35,695 |
| Cheyenne | 0.0 /100 | #294 | Tragic $35,673 |
| Comanche | 0.0 /100 | #295 | Tragic $35,661 |