Swiss vs Immigrants from Denmark Median Female Earnings
COMPARE
Swiss
Immigrants from Denmark
Median Female Earnings
Median Female Earnings Comparison
Swiss
Immigrants from Denmark
$37,904
MEDIAN FEMALE EARNINGS
2.3/ 100
METRIC RATING
249th/ 347
METRIC RANK
$43,646
MEDIAN FEMALE EARNINGS
100.0/ 100
METRIC RATING
42nd/ 347
METRIC RANK
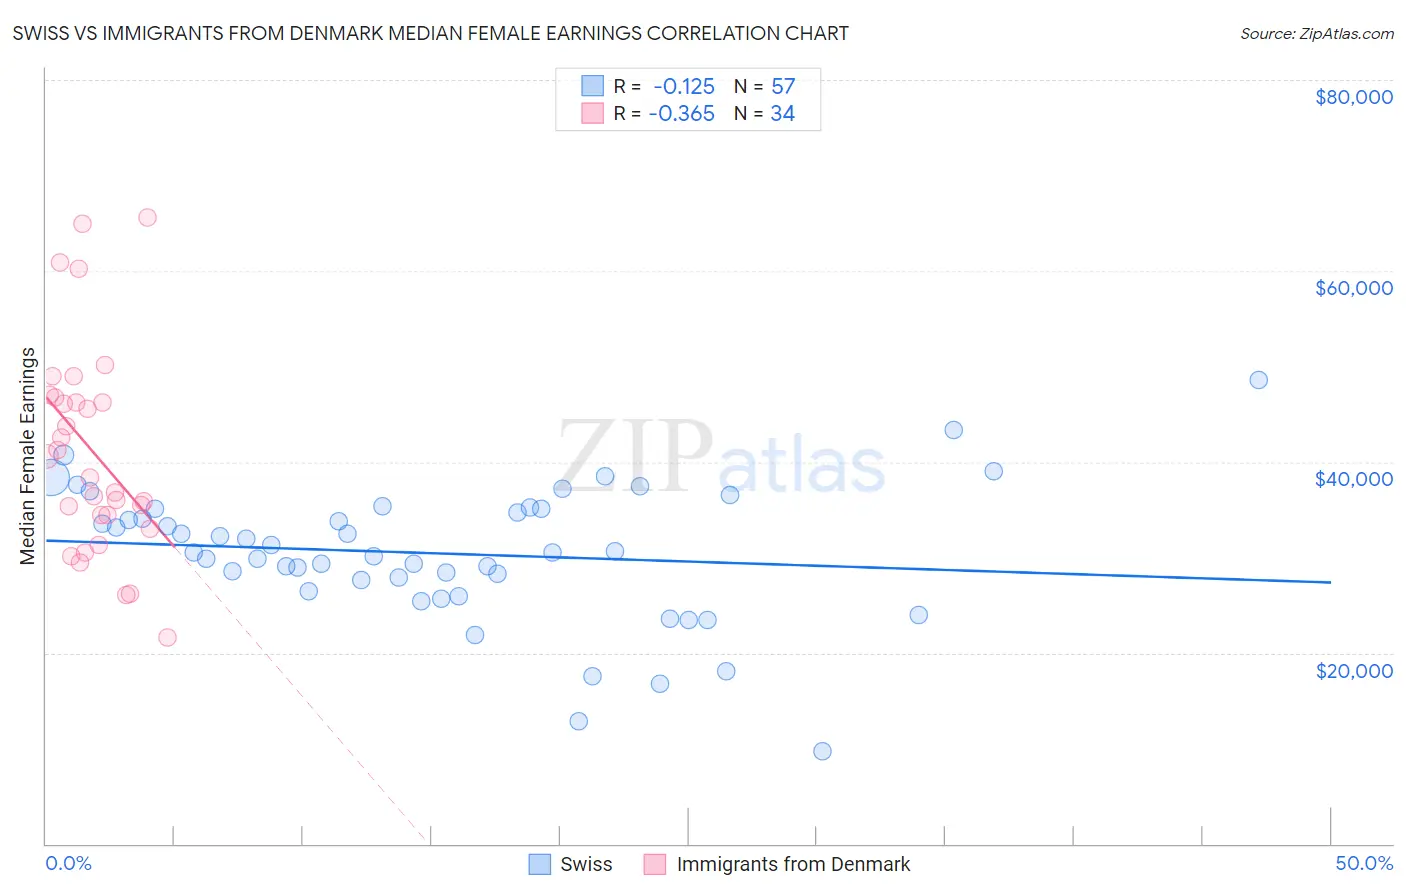
Swiss vs Immigrants from Denmark Median Female Earnings Correlation Chart
The statistical analysis conducted on geographies consisting of 464,484,716 people shows a poor negative correlation between the proportion of Swiss and median female earnings in the United States with a correlation coefficient (R) of -0.125 and weighted average of $37,904. Similarly, the statistical analysis conducted on geographies consisting of 136,407,509 people shows a mild negative correlation between the proportion of Immigrants from Denmark and median female earnings in the United States with a correlation coefficient (R) of -0.365 and weighted average of $43,646, a difference of 15.1%.
Median Female Earnings Correlation Summary
| Measurement | Swiss | Immigrants from Denmark |
| Minimum | $9,649 | $21,591 |
| Maximum | $48,533 | $65,662 |
| Range | $38,884 | $44,071 |
| Mean | $30,422 | $41,084 |
| Median | $30,468 | $39,517 |
| Interquartile 25% (IQ1) | $27,075 | $34,414 |
| Interquartile 75% (IQ3) | $35,111 | $46,746 |
| Interquartile Range (IQR) | $8,036 | $12,332 |
| Standard Deviation (Sample) | $7,120 | $10,895 |
| Standard Deviation (Population) | $7,057 | $10,734 |
Similar Demographics by Median Female Earnings
Demographics Similar to Swiss by Median Female Earnings
In terms of median female earnings, the demographic groups most similar to Swiss are Alaskan Athabascan ($37,905, a difference of 0.0%), Immigrants from Somalia ($37,914, a difference of 0.030%), Immigrants from Iraq ($37,864, a difference of 0.11%), Welsh ($37,856, a difference of 0.13%), and Immigrants from Middle Africa ($37,965, a difference of 0.16%).
| Demographics | Rating | Rank | Median Female Earnings |
| Immigrants | Burma/Myanmar | 3.0 /100 | #242 | Tragic $38,028 |
| Germans | 2.8 /100 | #243 | Tragic $37,986 |
| Immigrants | Liberia | 2.7 /100 | #244 | Tragic $37,970 |
| Immigrants | Middle Africa | 2.7 /100 | #245 | Tragic $37,965 |
| Delaware | 2.6 /100 | #246 | Tragic $37,964 |
| Immigrants | Somalia | 2.4 /100 | #247 | Tragic $37,914 |
| Alaskan Athabascans | 2.3 /100 | #248 | Tragic $37,905 |
| Swiss | 2.3 /100 | #249 | Tragic $37,904 |
| Immigrants | Iraq | 2.2 /100 | #250 | Tragic $37,864 |
| Welsh | 2.1 /100 | #251 | Tragic $37,856 |
| Immigrants | Dominica | 2.0 /100 | #252 | Tragic $37,825 |
| Danes | 1.6 /100 | #253 | Tragic $37,730 |
| Whites/Caucasians | 1.1 /100 | #254 | Tragic $37,531 |
| Colville | 1.1 /100 | #255 | Tragic $37,514 |
| Samoans | 1.0 /100 | #256 | Tragic $37,498 |
Demographics Similar to Immigrants from Denmark by Median Female Earnings
In terms of median female earnings, the demographic groups most similar to Immigrants from Denmark are Bhutanese ($43,648, a difference of 0.0%), Bulgarian ($43,638, a difference of 0.020%), Immigrants from Czechoslovakia ($43,571, a difference of 0.17%), Immigrants from Europe ($43,523, a difference of 0.28%), and Immigrants from Bolivia ($43,467, a difference of 0.41%).
| Demographics | Rating | Rank | Median Female Earnings |
| Immigrants | Sri Lanka | 100.0 /100 | #35 | Exceptional $44,161 |
| Immigrants | Turkey | 100.0 /100 | #36 | Exceptional $44,066 |
| Immigrants | Switzerland | 100.0 /100 | #37 | Exceptional $43,996 |
| Latvians | 100.0 /100 | #38 | Exceptional $43,941 |
| Israelis | 100.0 /100 | #39 | Exceptional $43,852 |
| Immigrants | Malaysia | 100.0 /100 | #40 | Exceptional $43,835 |
| Bhutanese | 100.0 /100 | #41 | Exceptional $43,648 |
| Immigrants | Denmark | 100.0 /100 | #42 | Exceptional $43,646 |
| Bulgarians | 100.0 /100 | #43 | Exceptional $43,638 |
| Immigrants | Czechoslovakia | 100.0 /100 | #44 | Exceptional $43,571 |
| Immigrants | Europe | 100.0 /100 | #45 | Exceptional $43,523 |
| Immigrants | Bolivia | 100.0 /100 | #46 | Exceptional $43,467 |
| Bolivians | 100.0 /100 | #47 | Exceptional $43,445 |
| Immigrants | Indonesia | 100.0 /100 | #48 | Exceptional $43,412 |
| Immigrants | Serbia | 100.0 /100 | #49 | Exceptional $43,385 |