Sudanese vs Yaqui Householder Income Under 25 years
COMPARE
Sudanese
Yaqui
Householder Income Under 25 years
Householder Income Under 25 years Comparison
Sudanese
Yaqui
$46,982
HOUSEHOLDER INCOME UNDER 25 YEARS
0.0/ 100
METRIC RATING
316th/ 347
METRIC RANK
$48,300
HOUSEHOLDER INCOME UNDER 25 YEARS
0.0/ 100
METRIC RATING
298th/ 347
METRIC RANK
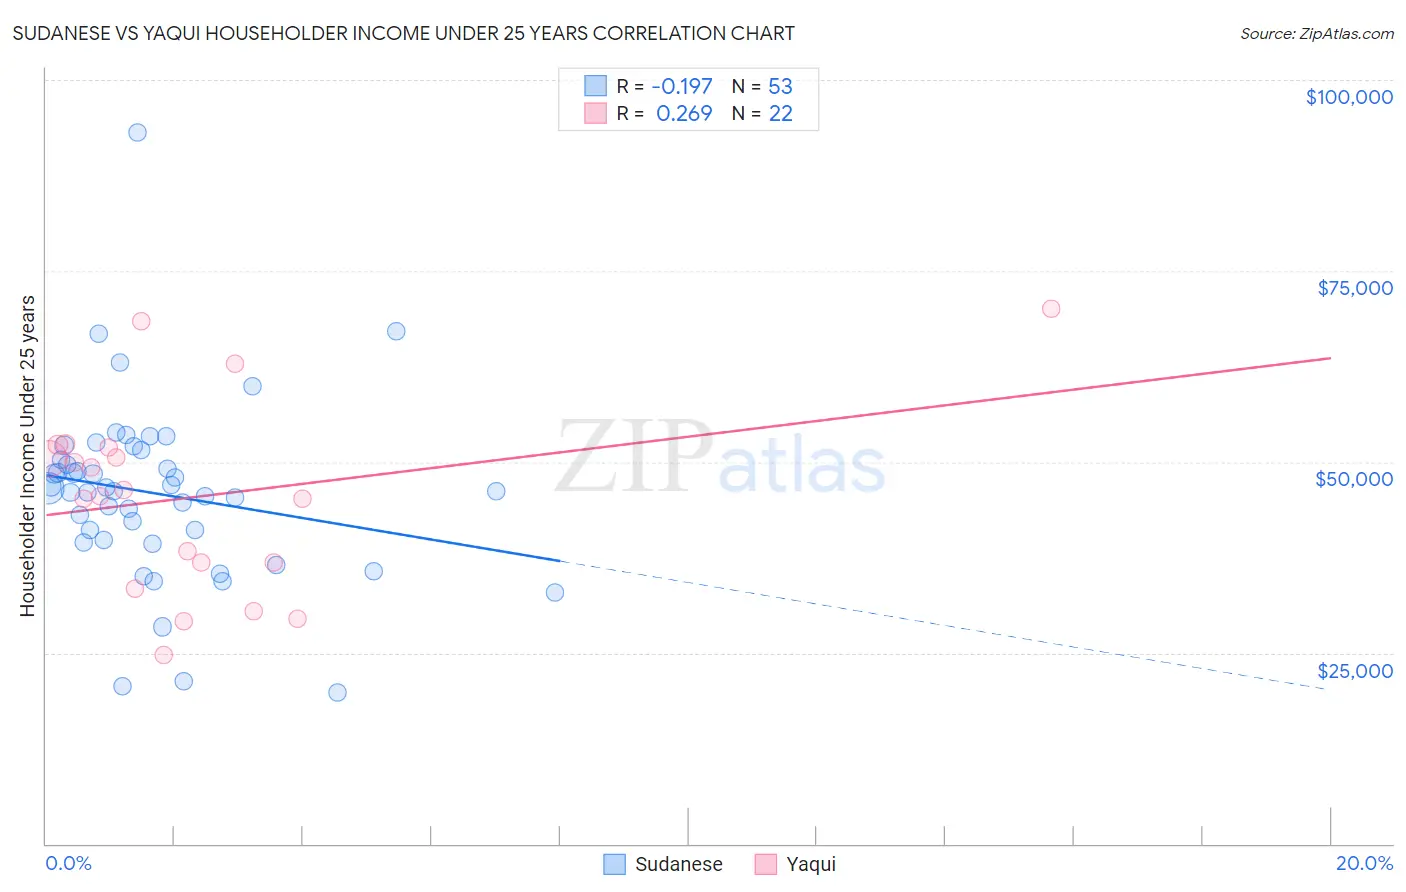
Sudanese vs Yaqui Householder Income Under 25 years Correlation Chart
The statistical analysis conducted on geographies consisting of 104,582,172 people shows a poor negative correlation between the proportion of Sudanese and household income with householder under the age of 25 in the United States with a correlation coefficient (R) of -0.197 and weighted average of $46,982. Similarly, the statistical analysis conducted on geographies consisting of 100,142,881 people shows a weak positive correlation between the proportion of Yaqui and household income with householder under the age of 25 in the United States with a correlation coefficient (R) of 0.269 and weighted average of $48,300, a difference of 2.8%.
Householder Income Under 25 years Correlation Summary
| Measurement | Sudanese | Yaqui |
| Minimum | $19,757 | $24,739 |
| Maximum | $93,063 | $70,037 |
| Range | $73,306 | $45,298 |
| Mean | $45,800 | $45,409 |
| Median | $46,181 | $45,880 |
| Interquartile 25% (IQ1) | $39,636 | $36,750 |
| Interquartile 75% (IQ3) | $50,904 | $51,924 |
| Interquartile Range (IQR) | $11,268 | $15,174 |
| Standard Deviation (Sample) | $11,891 | $12,300 |
| Standard Deviation (Population) | $11,778 | $12,017 |
Demographics Similar to Sudanese and Yaqui by Householder Income Under 25 years
In terms of householder income under 25 years, the demographic groups most similar to Sudanese are Hopi ($46,978, a difference of 0.010%), Crow ($47,012, a difference of 0.060%), Chippewa ($47,015, a difference of 0.070%), Delaware ($47,159, a difference of 0.38%), and Bermudan ($47,359, a difference of 0.80%). Similarly, the demographic groups most similar to Yaqui are Immigrants from Honduras ($48,267, a difference of 0.070%), Immigrants from Somalia ($48,135, a difference of 0.34%), Immigrants from Kuwait ($48,126, a difference of 0.36%), Cree ($48,514, a difference of 0.44%), and Immigrants from Liberia ($47,981, a difference of 0.66%).
| Demographics | Rating | Rank | Householder Income Under 25 years |
| Cree | 0.0 /100 | #297 | Tragic $48,514 |
| Yaqui | 0.0 /100 | #298 | Tragic $48,300 |
| Immigrants | Honduras | 0.0 /100 | #299 | Tragic $48,267 |
| Immigrants | Somalia | 0.0 /100 | #300 | Tragic $48,135 |
| Immigrants | Kuwait | 0.0 /100 | #301 | Tragic $48,126 |
| Immigrants | Liberia | 0.0 /100 | #302 | Tragic $47,981 |
| Immigrants | Middle Africa | 0.0 /100 | #303 | Tragic $47,916 |
| Menominee | 0.0 /100 | #304 | Tragic $47,907 |
| Cherokee | 0.0 /100 | #305 | Tragic $47,848 |
| Natives/Alaskans | 0.0 /100 | #306 | Tragic $47,704 |
| Bangladeshis | 0.0 /100 | #307 | Tragic $47,589 |
| Comanche | 0.0 /100 | #308 | Tragic $47,518 |
| U.S. Virgin Islanders | 0.0 /100 | #309 | Tragic $47,448 |
| Iroquois | 0.0 /100 | #310 | Tragic $47,380 |
| Ottawa | 0.0 /100 | #311 | Tragic $47,366 |
| Bermudans | 0.0 /100 | #312 | Tragic $47,359 |
| Delaware | 0.0 /100 | #313 | Tragic $47,159 |
| Chippewa | 0.0 /100 | #314 | Tragic $47,015 |
| Crow | 0.0 /100 | #315 | Tragic $47,012 |
| Sudanese | 0.0 /100 | #316 | Tragic $46,982 |
| Hopi | 0.0 /100 | #317 | Tragic $46,978 |