Sudanese vs Immigrants from Moldova Householder Income Under 25 years
COMPARE
Sudanese
Immigrants from Moldova
Householder Income Under 25 years
Householder Income Under 25 years Comparison
Sudanese
Immigrants from Moldova
$46,982
HOUSEHOLDER INCOME UNDER 25 YEARS
0.0/ 100
METRIC RATING
316th/ 347
METRIC RANK
$56,168
HOUSEHOLDER INCOME UNDER 25 YEARS
100.0/ 100
METRIC RATING
30th/ 347
METRIC RANK
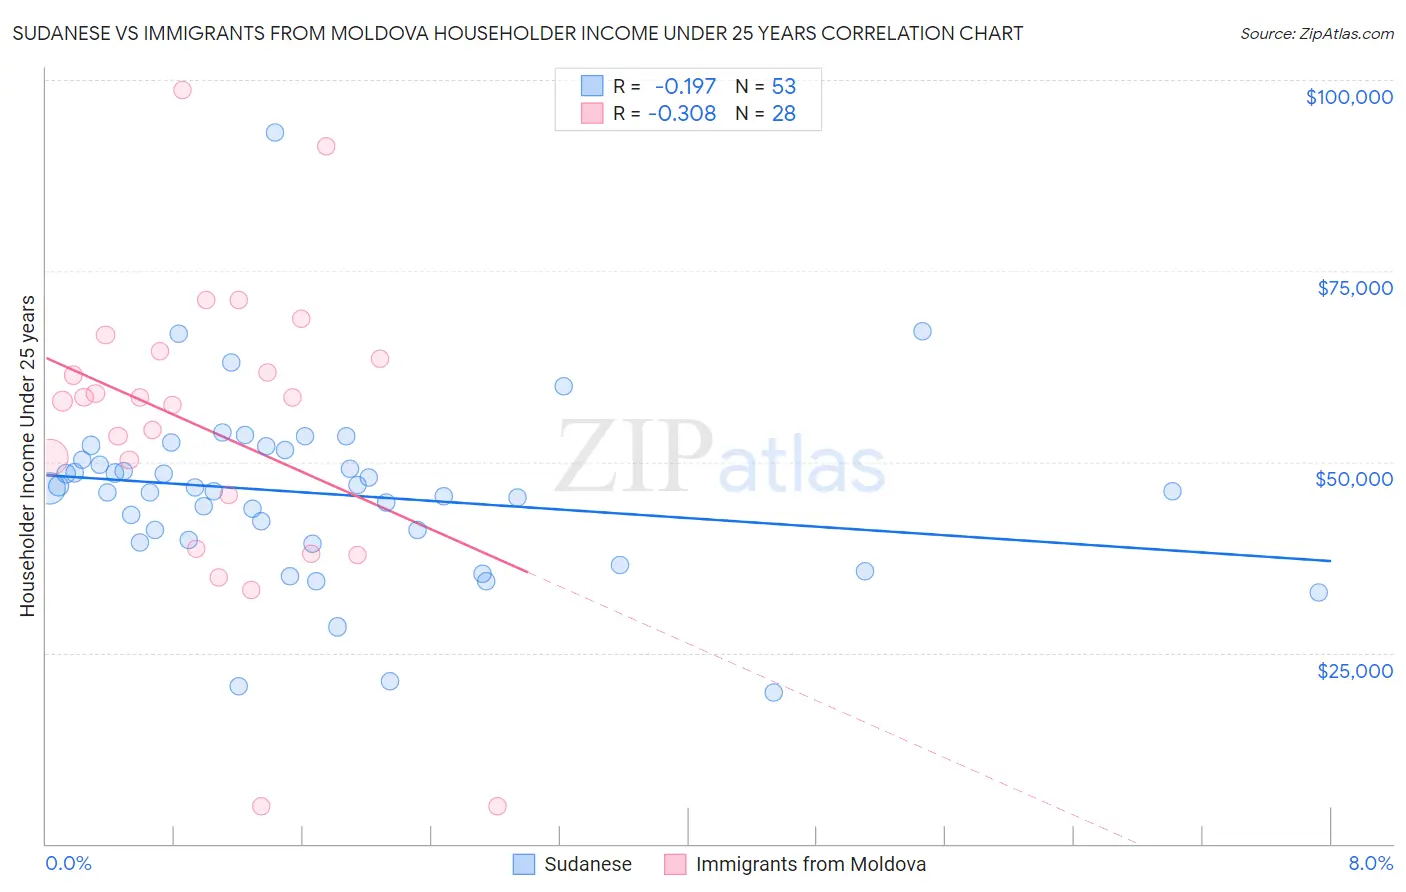
Sudanese vs Immigrants from Moldova Householder Income Under 25 years Correlation Chart
The statistical analysis conducted on geographies consisting of 104,582,172 people shows a poor negative correlation between the proportion of Sudanese and household income with householder under the age of 25 in the United States with a correlation coefficient (R) of -0.197 and weighted average of $46,982. Similarly, the statistical analysis conducted on geographies consisting of 112,044,637 people shows a mild negative correlation between the proportion of Immigrants from Moldova and household income with householder under the age of 25 in the United States with a correlation coefficient (R) of -0.308 and weighted average of $56,168, a difference of 19.6%.
Householder Income Under 25 years Correlation Summary
| Measurement | Sudanese | Immigrants from Moldova |
| Minimum | $19,757 | $4,881 |
| Maximum | $93,063 | $98,750 |
| Range | $73,306 | $93,869 |
| Mean | $45,800 | $54,102 |
| Median | $46,181 | $58,227 |
| Interquartile 25% (IQ1) | $39,636 | $42,159 |
| Interquartile 75% (IQ3) | $50,904 | $64,005 |
| Interquartile Range (IQR) | $11,268 | $21,847 |
| Standard Deviation (Sample) | $11,891 | $20,418 |
| Standard Deviation (Population) | $11,778 | $20,050 |
Similar Demographics by Householder Income Under 25 years
Demographics Similar to Sudanese by Householder Income Under 25 years
In terms of householder income under 25 years, the demographic groups most similar to Sudanese are Hopi ($46,978, a difference of 0.010%), Crow ($47,012, a difference of 0.060%), Chippewa ($47,015, a difference of 0.070%), Spanish American ($46,913, a difference of 0.15%), and African ($46,838, a difference of 0.31%).
| Demographics | Rating | Rank | Householder Income Under 25 years |
| U.S. Virgin Islanders | 0.0 /100 | #309 | Tragic $47,448 |
| Iroquois | 0.0 /100 | #310 | Tragic $47,380 |
| Ottawa | 0.0 /100 | #311 | Tragic $47,366 |
| Bermudans | 0.0 /100 | #312 | Tragic $47,359 |
| Delaware | 0.0 /100 | #313 | Tragic $47,159 |
| Chippewa | 0.0 /100 | #314 | Tragic $47,015 |
| Crow | 0.0 /100 | #315 | Tragic $47,012 |
| Sudanese | 0.0 /100 | #316 | Tragic $46,982 |
| Hopi | 0.0 /100 | #317 | Tragic $46,978 |
| Spanish Americans | 0.0 /100 | #318 | Tragic $46,913 |
| Africans | 0.0 /100 | #319 | Tragic $46,838 |
| Immigrants | Sudan | 0.0 /100 | #320 | Tragic $46,791 |
| Potawatomi | 0.0 /100 | #321 | Tragic $46,462 |
| Sioux | 0.0 /100 | #322 | Tragic $46,417 |
| Immigrants | Saudi Arabia | 0.0 /100 | #323 | Tragic $46,187 |
Demographics Similar to Immigrants from Moldova by Householder Income Under 25 years
In terms of householder income under 25 years, the demographic groups most similar to Immigrants from Moldova are Vietnamese ($56,127, a difference of 0.070%), Peruvian ($56,052, a difference of 0.21%), Immigrants from Asia ($56,379, a difference of 0.37%), Immigrants from Peru ($56,384, a difference of 0.38%), and Inupiat ($55,935, a difference of 0.42%).
| Demographics | Rating | Rank | Householder Income Under 25 years |
| Tongans | 100.0 /100 | #23 | Exceptional $56,972 |
| Immigrants | Singapore | 100.0 /100 | #24 | Exceptional $56,835 |
| Immigrants | Pakistan | 100.0 /100 | #25 | Exceptional $56,789 |
| Immigrants | Australia | 100.0 /100 | #26 | Exceptional $56,660 |
| Immigrants | North Macedonia | 100.0 /100 | #27 | Exceptional $56,503 |
| Immigrants | Peru | 100.0 /100 | #28 | Exceptional $56,384 |
| Immigrants | Asia | 100.0 /100 | #29 | Exceptional $56,379 |
| Immigrants | Moldova | 100.0 /100 | #30 | Exceptional $56,168 |
| Vietnamese | 100.0 /100 | #31 | Exceptional $56,127 |
| Peruvians | 100.0 /100 | #32 | Exceptional $56,052 |
| Inupiat | 100.0 /100 | #33 | Exceptional $55,935 |
| Immigrants | Japan | 100.0 /100 | #34 | Exceptional $55,932 |
| Tlingit-Haida | 100.0 /100 | #35 | Exceptional $55,914 |
| Immigrants | Israel | 100.0 /100 | #36 | Exceptional $55,913 |
| Immigrants | Russia | 100.0 /100 | #37 | Exceptional $55,891 |