Subsaharan African vs Trinidadian and Tobagonian Householder Income Over 65 years
COMPARE
Subsaharan African
Trinidadian and Tobagonian
Householder Income Over 65 years
Householder Income Over 65 years Comparison
Sub-Saharan Africans
Trinidadians and Tobagonians
$56,615
HOUSEHOLDER INCOME OVER 65 YEARS
1.0/ 100
METRIC RATING
240th/ 347
METRIC RANK
$55,327
HOUSEHOLDER INCOME OVER 65 YEARS
0.3/ 100
METRIC RATING
257th/ 347
METRIC RANK
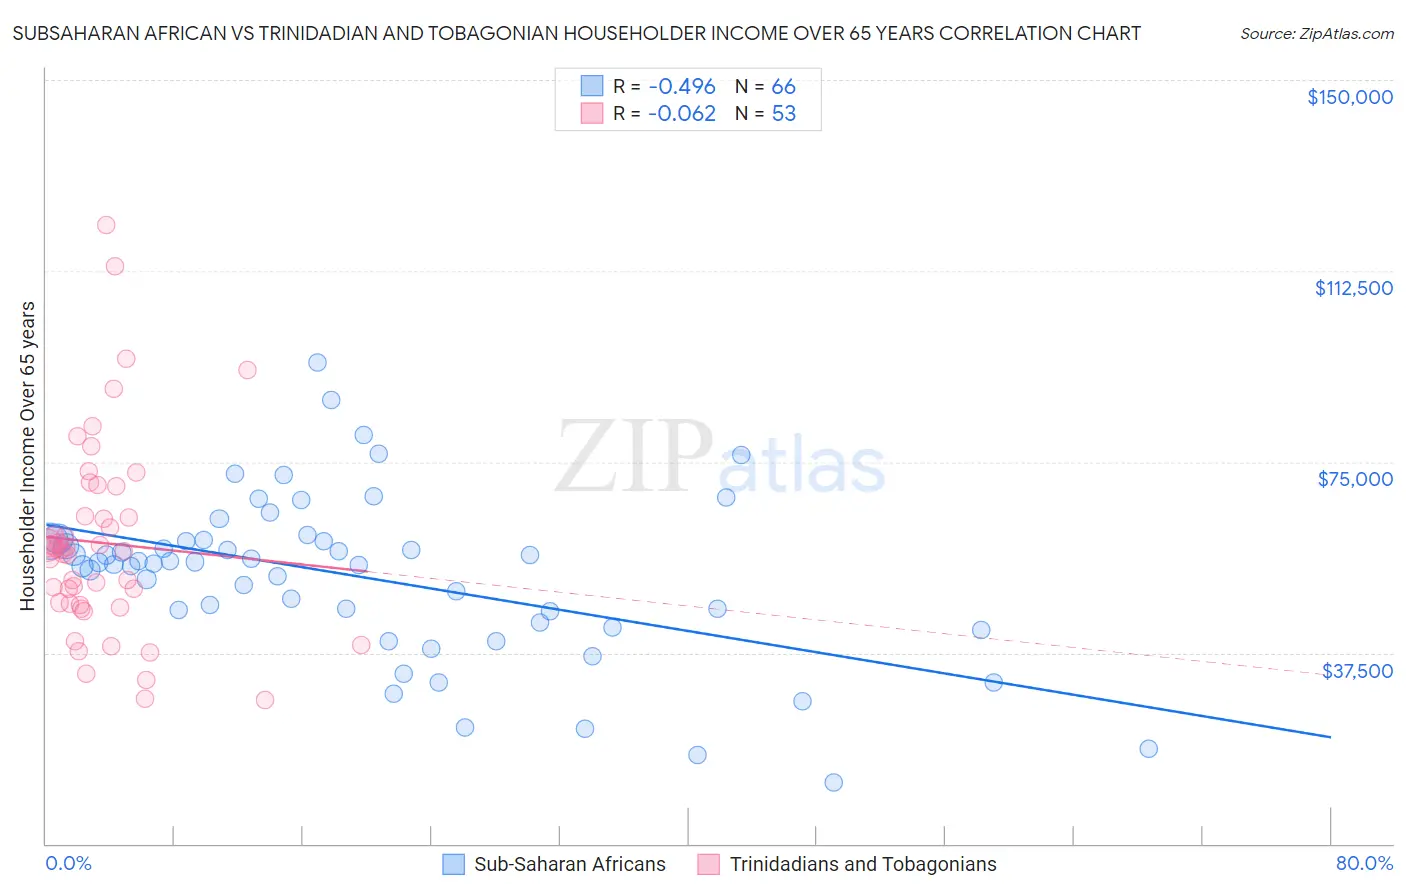
Subsaharan African vs Trinidadian and Tobagonian Householder Income Over 65 years Correlation Chart
The statistical analysis conducted on geographies consisting of 505,008,485 people shows a moderate negative correlation between the proportion of Sub-Saharan Africans and household income with householder over the age of 65 in the United States with a correlation coefficient (R) of -0.496 and weighted average of $56,615. Similarly, the statistical analysis conducted on geographies consisting of 219,266,314 people shows a slight negative correlation between the proportion of Trinidadians and Tobagonians and household income with householder over the age of 65 in the United States with a correlation coefficient (R) of -0.062 and weighted average of $55,327, a difference of 2.3%.
Householder Income Over 65 years Correlation Summary
| Measurement | Subsaharan African | Trinidadian and Tobagonian |
| Minimum | $12,049 | $28,152 |
| Maximum | $94,427 | $121,597 |
| Range | $82,378 | $93,445 |
| Mean | $52,341 | $59,094 |
| Median | $55,146 | $57,745 |
| Interquartile 25% (IQ1) | $43,507 | $46,990 |
| Interquartile 75% (IQ3) | $59,521 | $67,305 |
| Interquartile Range (IQR) | $16,014 | $20,315 |
| Standard Deviation (Sample) | $16,149 | $19,236 |
| Standard Deviation (Population) | $16,026 | $19,054 |
Demographics Similar to Sub-Saharan Africans and Trinidadians and Tobagonians by Householder Income Over 65 years
In terms of householder income over 65 years, the demographic groups most similar to Sub-Saharan Africans are Immigrants from Laos ($56,722, a difference of 0.19%), Immigrants from Guyana ($56,495, a difference of 0.21%), Fijian ($56,768, a difference of 0.27%), Yaqui ($56,417, a difference of 0.35%), and Guyanese ($56,351, a difference of 0.47%). Similarly, the demographic groups most similar to Trinidadians and Tobagonians are German Russian ($55,356, a difference of 0.050%), Immigrants from Bangladesh ($55,394, a difference of 0.12%), American ($55,527, a difference of 0.36%), Immigrants from Trinidad and Tobago ($55,598, a difference of 0.49%), and Osage ($55,677, a difference of 0.63%).
| Demographics | Rating | Rank | Householder Income Over 65 years |
| Fijians | 1.2 /100 | #238 | Tragic $56,768 |
| Immigrants | Laos | 1.2 /100 | #239 | Tragic $56,722 |
| Sub-Saharan Africans | 1.0 /100 | #240 | Tragic $56,615 |
| Immigrants | Guyana | 0.9 /100 | #241 | Tragic $56,495 |
| Yaqui | 0.8 /100 | #242 | Tragic $56,417 |
| Guyanese | 0.8 /100 | #243 | Tragic $56,351 |
| Hmong | 0.8 /100 | #244 | Tragic $56,339 |
| Immigrants | Uzbekistan | 0.8 /100 | #245 | Tragic $56,331 |
| Central Americans | 0.8 /100 | #246 | Tragic $56,321 |
| Yakama | 0.7 /100 | #247 | Tragic $56,234 |
| Vietnamese | 0.6 /100 | #248 | Tragic $56,143 |
| Mexican American Indians | 0.6 /100 | #249 | Tragic $56,089 |
| Immigrants | Bosnia and Herzegovina | 0.5 /100 | #250 | Tragic $55,986 |
| Immigrants | Portugal | 0.5 /100 | #251 | Tragic $55,924 |
| Osage | 0.4 /100 | #252 | Tragic $55,677 |
| Immigrants | Trinidad and Tobago | 0.4 /100 | #253 | Tragic $55,598 |
| Americans | 0.3 /100 | #254 | Tragic $55,527 |
| Immigrants | Bangladesh | 0.3 /100 | #255 | Tragic $55,394 |
| German Russians | 0.3 /100 | #256 | Tragic $55,356 |
| Trinidadians and Tobagonians | 0.3 /100 | #257 | Tragic $55,327 |
| Ecuadorians | 0.2 /100 | #258 | Tragic $54,958 |