Subsaharan African vs Sudanese Householder Income Over 65 years
COMPARE
Subsaharan African
Sudanese
Householder Income Over 65 years
Householder Income Over 65 years Comparison
Sub-Saharan Africans
Sudanese
$56,615
HOUSEHOLDER INCOME OVER 65 YEARS
1.0/ 100
METRIC RATING
240th/ 347
METRIC RANK
$58,281
HOUSEHOLDER INCOME OVER 65 YEARS
5.7/ 100
METRIC RATING
217th/ 347
METRIC RANK
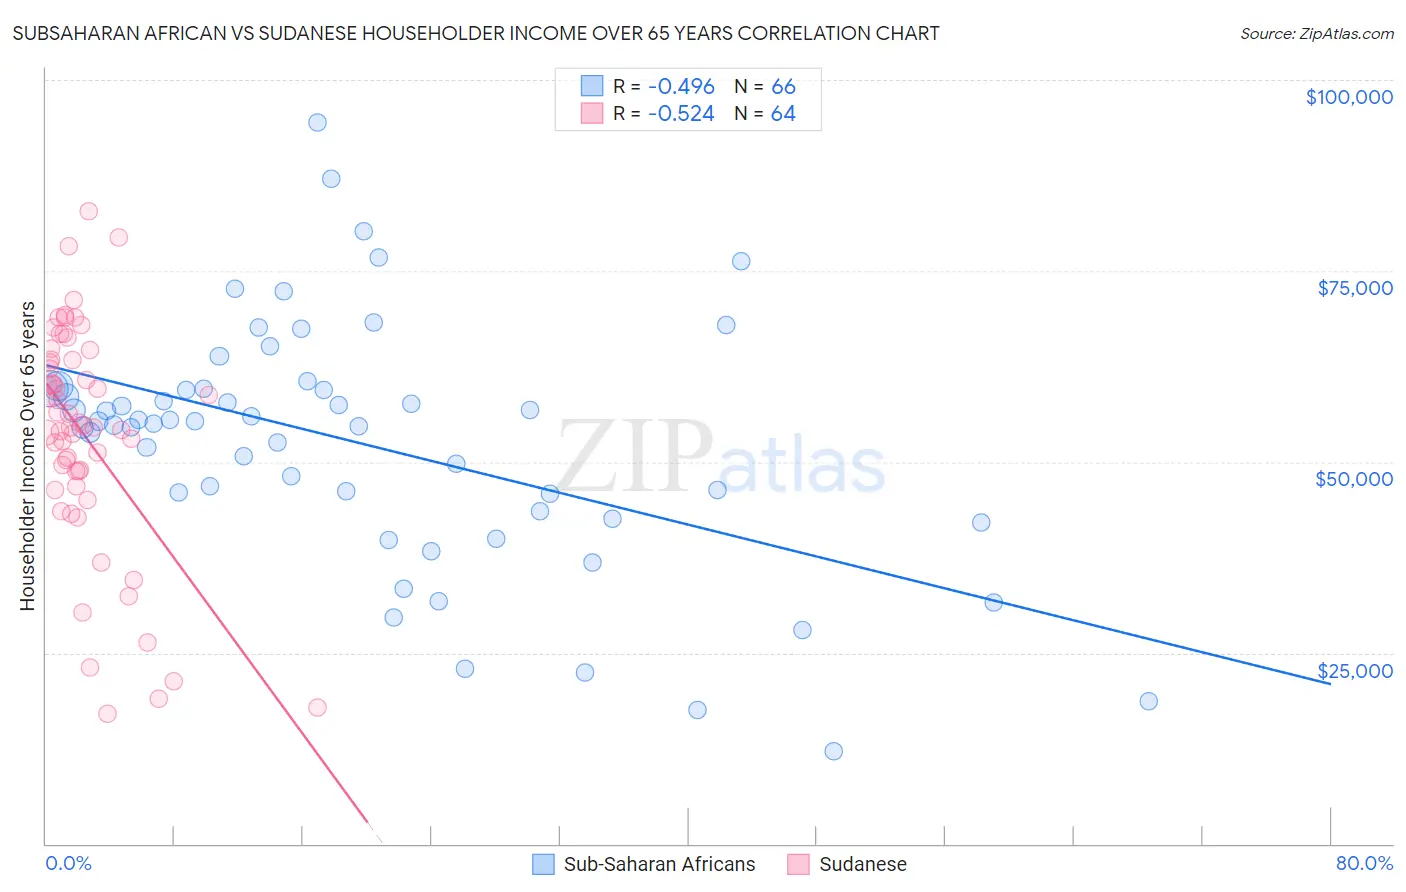
Subsaharan African vs Sudanese Householder Income Over 65 years Correlation Chart
The statistical analysis conducted on geographies consisting of 505,008,485 people shows a moderate negative correlation between the proportion of Sub-Saharan Africans and household income with householder over the age of 65 in the United States with a correlation coefficient (R) of -0.496 and weighted average of $56,615. Similarly, the statistical analysis conducted on geographies consisting of 109,968,006 people shows a substantial negative correlation between the proportion of Sudanese and household income with householder over the age of 65 in the United States with a correlation coefficient (R) of -0.524 and weighted average of $58,281, a difference of 2.9%.
Householder Income Over 65 years Correlation Summary
| Measurement | Subsaharan African | Sudanese |
| Minimum | $12,049 | $17,083 |
| Maximum | $94,427 | $82,774 |
| Range | $82,378 | $65,691 |
| Mean | $52,341 | $53,447 |
| Median | $55,146 | $54,692 |
| Interquartile 25% (IQ1) | $43,507 | $47,752 |
| Interquartile 75% (IQ3) | $59,521 | $63,414 |
| Interquartile Range (IQR) | $16,014 | $15,662 |
| Standard Deviation (Sample) | $16,149 | $14,913 |
| Standard Deviation (Population) | $16,026 | $14,796 |
Similar Demographics by Householder Income Over 65 years
Demographics Similar to Sub-Saharan Africans by Householder Income Over 65 years
In terms of householder income over 65 years, the demographic groups most similar to Sub-Saharan Africans are Immigrants from Laos ($56,722, a difference of 0.19%), Immigrants from Guyana ($56,495, a difference of 0.21%), Fijian ($56,768, a difference of 0.27%), Yaqui ($56,417, a difference of 0.35%), and Guyanese ($56,351, a difference of 0.47%).
| Demographics | Rating | Rank | Householder Income Over 65 years |
| Immigrants | Western Africa | 1.7 /100 | #233 | Tragic $57,119 |
| Immigrants | Burma/Myanmar | 1.7 /100 | #234 | Tragic $57,114 |
| Spanish Americans | 1.6 /100 | #235 | Tragic $57,021 |
| Immigrants | Uruguay | 1.5 /100 | #236 | Tragic $56,975 |
| Immigrants | Panama | 1.5 /100 | #237 | Tragic $56,944 |
| Fijians | 1.2 /100 | #238 | Tragic $56,768 |
| Immigrants | Laos | 1.2 /100 | #239 | Tragic $56,722 |
| Sub-Saharan Africans | 1.0 /100 | #240 | Tragic $56,615 |
| Immigrants | Guyana | 0.9 /100 | #241 | Tragic $56,495 |
| Yaqui | 0.8 /100 | #242 | Tragic $56,417 |
| Guyanese | 0.8 /100 | #243 | Tragic $56,351 |
| Hmong | 0.8 /100 | #244 | Tragic $56,339 |
| Immigrants | Uzbekistan | 0.8 /100 | #245 | Tragic $56,331 |
| Central Americans | 0.8 /100 | #246 | Tragic $56,321 |
| Yakama | 0.7 /100 | #247 | Tragic $56,234 |
Demographics Similar to Sudanese by Householder Income Over 65 years
In terms of householder income over 65 years, the demographic groups most similar to Sudanese are Panamanian ($58,266, a difference of 0.030%), Malaysian ($58,244, a difference of 0.060%), Yugoslavian ($58,243, a difference of 0.070%), Immigrants from El Salvador ($58,226, a difference of 0.10%), and Delaware ($58,214, a difference of 0.11%).
| Demographics | Rating | Rank | Householder Income Over 65 years |
| Nigerians | 11.2 /100 | #210 | Poor $58,992 |
| Immigrants | Nigeria | 10.7 /100 | #211 | Poor $58,942 |
| Colombians | 9.8 /100 | #212 | Tragic $58,851 |
| Whites/Caucasians | 9.8 /100 | #213 | Tragic $58,847 |
| Nepalese | 9.0 /100 | #214 | Tragic $58,761 |
| Immigrants | Ghana | 7.9 /100 | #215 | Tragic $58,624 |
| Immigrants | Middle Africa | 6.2 /100 | #216 | Tragic $58,375 |
| Sudanese | 5.7 /100 | #217 | Tragic $58,281 |
| Panamanians | 5.6 /100 | #218 | Tragic $58,266 |
| Malaysians | 5.5 /100 | #219 | Tragic $58,244 |
| Yugoslavians | 5.5 /100 | #220 | Tragic $58,243 |
| Immigrants | El Salvador | 5.4 /100 | #221 | Tragic $58,226 |
| Delaware | 5.3 /100 | #222 | Tragic $58,214 |
| Tsimshian | 5.2 /100 | #223 | Tragic $58,202 |
| Bermudans | 5.1 /100 | #224 | Tragic $58,171 |