Subsaharan African vs Immigrants from Cuba Median Household Income
COMPARE
Subsaharan African
Immigrants from Cuba
Median Household Income
Median Household Income Comparison
Sub-Saharan Africans
Immigrants from Cuba
$77,631
MEDIAN HOUSEHOLD INCOME
0.8/ 100
METRIC RATING
254th/ 347
METRIC RANK
$68,461
MEDIAN HOUSEHOLD INCOME
0.0/ 100
METRIC RATING
327th/ 347
METRIC RANK
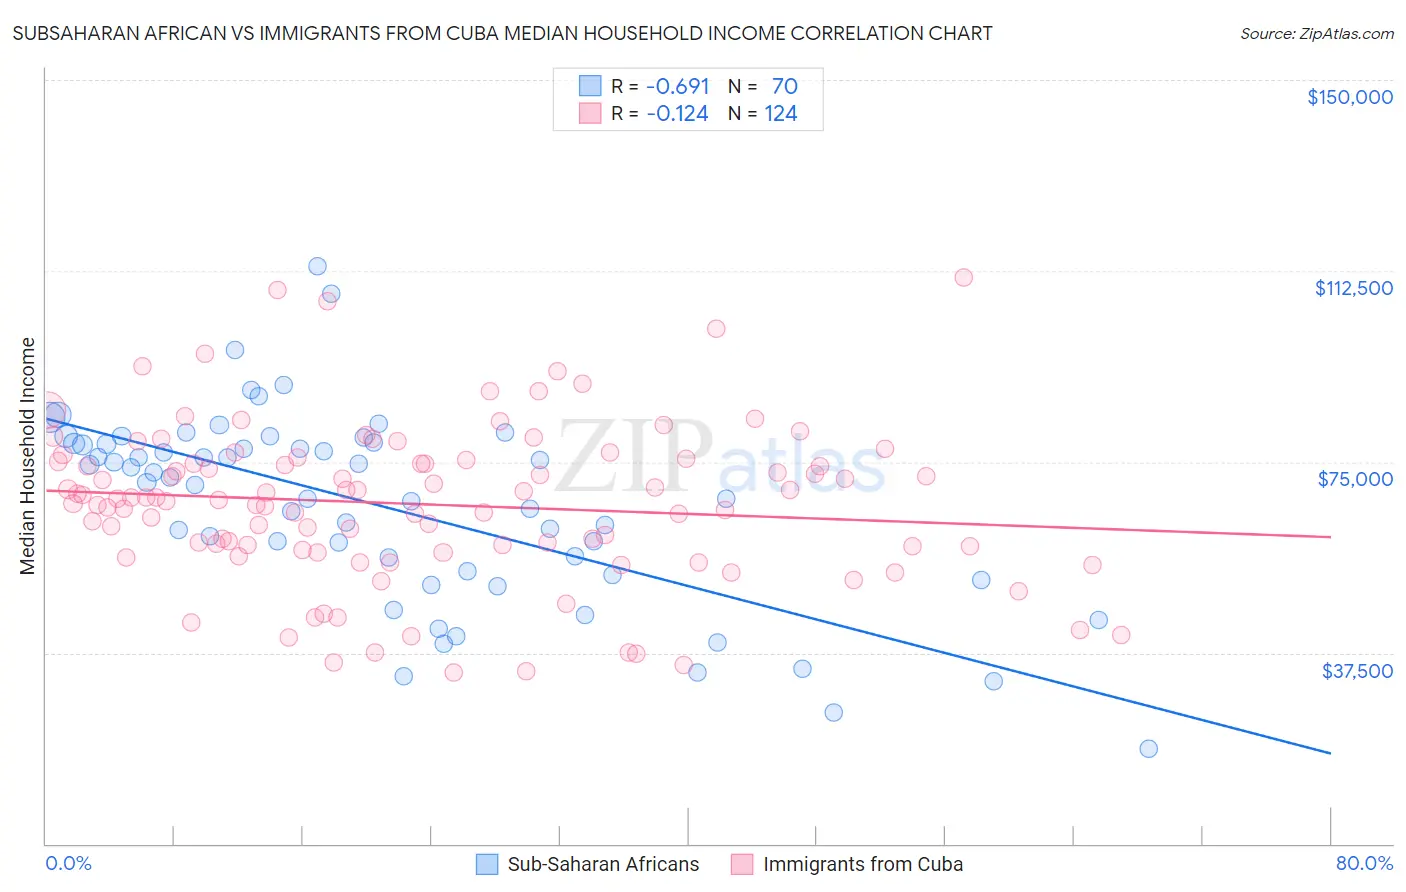
Subsaharan African vs Immigrants from Cuba Median Household Income Correlation Chart
The statistical analysis conducted on geographies consisting of 507,380,534 people shows a significant negative correlation between the proportion of Sub-Saharan Africans and median household income in the United States with a correlation coefficient (R) of -0.691 and weighted average of $77,631. Similarly, the statistical analysis conducted on geographies consisting of 325,902,946 people shows a poor negative correlation between the proportion of Immigrants from Cuba and median household income in the United States with a correlation coefficient (R) of -0.124 and weighted average of $68,461, a difference of 13.4%.
Median Household Income Correlation Summary
| Measurement | Subsaharan African | Immigrants from Cuba |
| Minimum | $18,750 | $33,697 |
| Maximum | $113,418 | $111,328 |
| Range | $94,668 | $77,631 |
| Mean | $66,483 | $66,701 |
| Median | $71,386 | $67,566 |
| Interquartile 25% (IQ1) | $53,589 | $57,982 |
| Interquartile 75% (IQ3) | $78,576 | $75,238 |
| Interquartile Range (IQR) | $24,988 | $17,257 |
| Standard Deviation (Sample) | $18,848 | $15,525 |
| Standard Deviation (Population) | $18,713 | $15,462 |
Similar Demographics by Median Household Income
Demographics Similar to Sub-Saharan Africans by Median Household Income
In terms of median household income, the demographic groups most similar to Sub-Saharan Africans are Immigrants from St. Vincent and the Grenadines ($77,690, a difference of 0.080%), Immigrants from Middle Africa ($77,559, a difference of 0.090%), Immigrants from West Indies ($77,956, a difference of 0.42%), Mexican American Indian ($78,166, a difference of 0.69%), and Belizean ($77,028, a difference of 0.78%).
| Demographics | Rating | Rank | Median Household Income |
| Immigrants | Burma/Myanmar | 1.6 /100 | #247 | Tragic $78,682 |
| Sudanese | 1.5 /100 | #248 | Tragic $78,529 |
| West Indians | 1.4 /100 | #249 | Tragic $78,455 |
| Immigrants | Laos | 1.3 /100 | #250 | Tragic $78,327 |
| Mexican American Indians | 1.2 /100 | #251 | Tragic $78,166 |
| Immigrants | West Indies | 1.0 /100 | #252 | Tragic $77,956 |
| Immigrants | St. Vincent and the Grenadines | 0.9 /100 | #253 | Tragic $77,690 |
| Sub-Saharan Africans | 0.8 /100 | #254 | Tragic $77,631 |
| Immigrants | Middle Africa | 0.8 /100 | #255 | Tragic $77,559 |
| Belizeans | 0.6 /100 | #256 | Tragic $77,028 |
| Immigrants | Senegal | 0.5 /100 | #257 | Tragic $76,915 |
| Immigrants | Nicaragua | 0.5 /100 | #258 | Tragic $76,784 |
| Spanish American Indians | 0.4 /100 | #259 | Tragic $76,670 |
| Jamaicans | 0.4 /100 | #260 | Tragic $76,583 |
| Immigrants | Grenada | 0.4 /100 | #261 | Tragic $76,517 |
Demographics Similar to Immigrants from Cuba by Median Household Income
In terms of median household income, the demographic groups most similar to Immigrants from Cuba are Menominee ($68,423, a difference of 0.060%), Dutch West Indian ($68,412, a difference of 0.070%), Yuman ($68,743, a difference of 0.41%), Arapaho ($67,965, a difference of 0.73%), and Native/Alaskan ($67,879, a difference of 0.86%).
| Demographics | Rating | Rank | Median Household Income |
| Colville | 0.0 /100 | #320 | Tragic $70,094 |
| Chickasaw | 0.0 /100 | #321 | Tragic $70,005 |
| Choctaw | 0.0 /100 | #322 | Tragic $69,947 |
| Bahamians | 0.0 /100 | #323 | Tragic $69,726 |
| Yup'ik | 0.0 /100 | #324 | Tragic $69,695 |
| Seminole | 0.0 /100 | #325 | Tragic $69,420 |
| Yuman | 0.0 /100 | #326 | Tragic $68,743 |
| Immigrants | Cuba | 0.0 /100 | #327 | Tragic $68,461 |
| Menominee | 0.0 /100 | #328 | Tragic $68,423 |
| Dutch West Indians | 0.0 /100 | #329 | Tragic $68,412 |
| Arapaho | 0.0 /100 | #330 | Tragic $67,965 |
| Natives/Alaskans | 0.0 /100 | #331 | Tragic $67,879 |
| Sioux | 0.0 /100 | #332 | Tragic $67,792 |
| Creek | 0.0 /100 | #333 | Tragic $67,715 |
| Blacks/African Americans | 0.0 /100 | #334 | Tragic $67,573 |