Subsaharan African vs Chickasaw Householder Income Under 25 years
COMPARE
Subsaharan African
Chickasaw
Householder Income Under 25 years
Householder Income Under 25 years Comparison
Sub-Saharan Africans
Chickasaw
$48,691
HOUSEHOLDER INCOME UNDER 25 YEARS
0.0/ 100
METRIC RATING
293rd/ 347
METRIC RANK
$44,763
HOUSEHOLDER INCOME UNDER 25 YEARS
0.0/ 100
METRIC RATING
338th/ 347
METRIC RANK
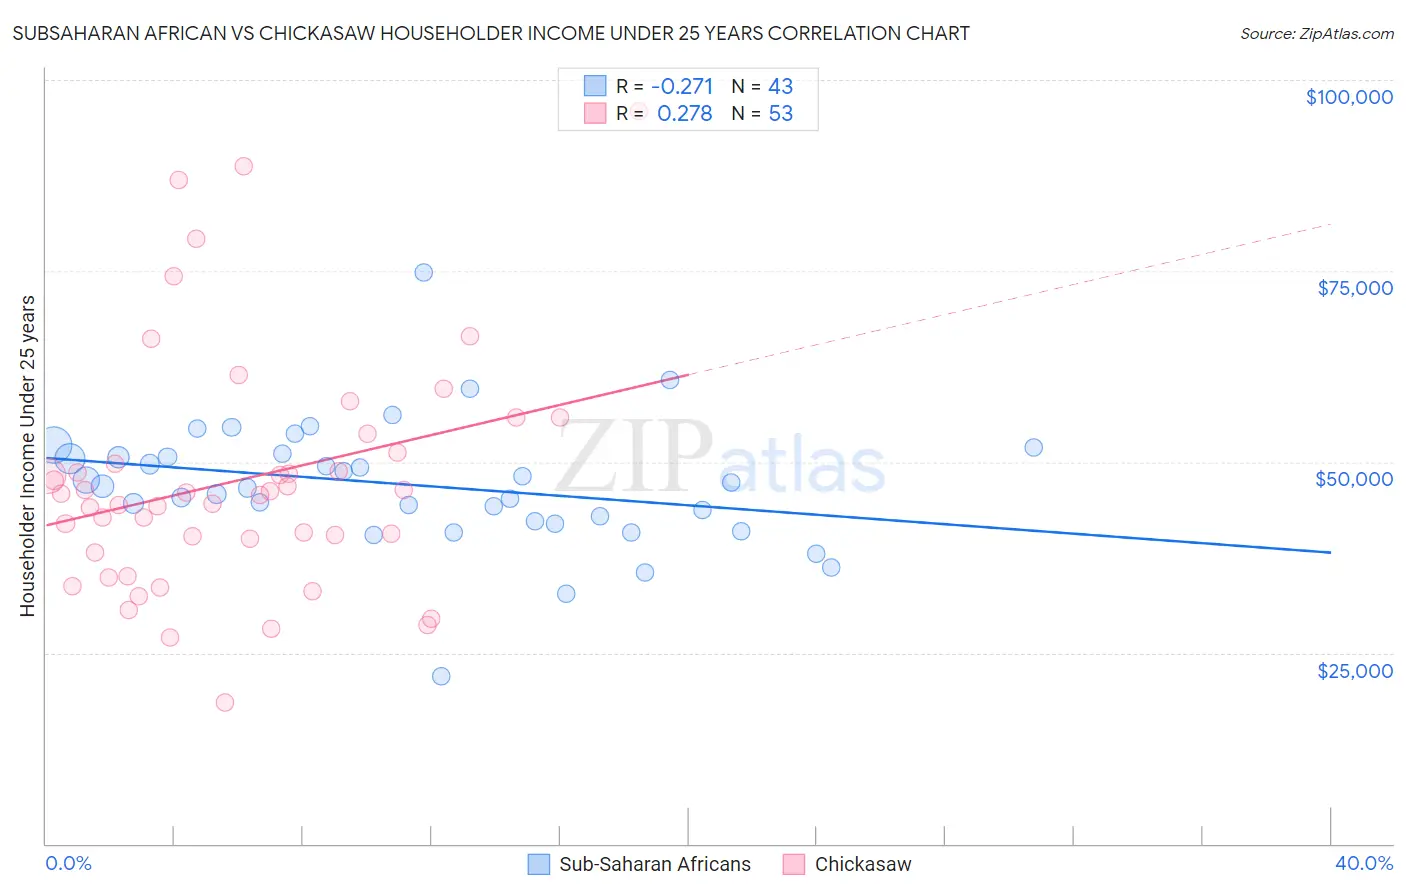
Subsaharan African vs Chickasaw Householder Income Under 25 years Correlation Chart
The statistical analysis conducted on geographies consisting of 413,616,575 people shows a weak negative correlation between the proportion of Sub-Saharan Africans and household income with householder under the age of 25 in the United States with a correlation coefficient (R) of -0.271 and weighted average of $48,691. Similarly, the statistical analysis conducted on geographies consisting of 137,295,377 people shows a weak positive correlation between the proportion of Chickasaw and household income with householder under the age of 25 in the United States with a correlation coefficient (R) of 0.278 and weighted average of $44,763, a difference of 8.8%.
Householder Income Under 25 years Correlation Summary
| Measurement | Subsaharan African | Chickasaw |
| Minimum | $21,932 | $18,415 |
| Maximum | $74,779 | $95,833 |
| Range | $52,847 | $77,418 |
| Mean | $46,996 | $47,638 |
| Median | $46,794 | $45,852 |
| Interquartile 25% (IQ1) | $42,165 | $38,980 |
| Interquartile 75% (IQ3) | $51,035 | $52,456 |
| Interquartile Range (IQR) | $8,871 | $13,476 |
| Standard Deviation (Sample) | $8,415 | $15,738 |
| Standard Deviation (Population) | $8,316 | $15,588 |
Similar Demographics by Householder Income Under 25 years
Demographics Similar to Sub-Saharan Africans by Householder Income Under 25 years
In terms of householder income under 25 years, the demographic groups most similar to Sub-Saharan Africans are Shoshone ($48,720, a difference of 0.060%), Somali ($48,657, a difference of 0.070%), Central American Indian ($48,643, a difference of 0.10%), Immigrants from Burma/Myanmar ($48,749, a difference of 0.12%), and Blackfeet ($48,603, a difference of 0.18%).
| Demographics | Rating | Rank | Householder Income Under 25 years |
| French American Indians | 0.0 /100 | #286 | Tragic $48,977 |
| Senegalese | 0.0 /100 | #287 | Tragic $48,953 |
| Liberians | 0.0 /100 | #288 | Tragic $48,917 |
| Hondurans | 0.0 /100 | #289 | Tragic $48,885 |
| Americans | 0.0 /100 | #290 | Tragic $48,860 |
| Immigrants | Burma/Myanmar | 0.0 /100 | #291 | Tragic $48,749 |
| Shoshone | 0.0 /100 | #292 | Tragic $48,720 |
| Sub-Saharan Africans | 0.0 /100 | #293 | Tragic $48,691 |
| Somalis | 0.0 /100 | #294 | Tragic $48,657 |
| Central American Indians | 0.0 /100 | #295 | Tragic $48,643 |
| Blackfeet | 0.0 /100 | #296 | Tragic $48,603 |
| Cree | 0.0 /100 | #297 | Tragic $48,514 |
| Yaqui | 0.0 /100 | #298 | Tragic $48,300 |
| Immigrants | Honduras | 0.0 /100 | #299 | Tragic $48,267 |
| Immigrants | Somalia | 0.0 /100 | #300 | Tragic $48,135 |
Demographics Similar to Chickasaw by Householder Income Under 25 years
In terms of householder income under 25 years, the demographic groups most similar to Chickasaw are Kiowa ($44,733, a difference of 0.070%), Pueblo ($45,018, a difference of 0.57%), Black/African American ($44,381, a difference of 0.86%), Houma ($44,356, a difference of 0.92%), and Tohono O'odham ($45,248, a difference of 1.1%).
| Demographics | Rating | Rank | Householder Income Under 25 years |
| Immigrants | Zaire | 0.0 /100 | #331 | Tragic $45,529 |
| Choctaw | 0.0 /100 | #332 | Tragic $45,450 |
| Creek | 0.0 /100 | #333 | Tragic $45,371 |
| Cajuns | 0.0 /100 | #334 | Tragic $45,338 |
| Cheyenne | 0.0 /100 | #335 | Tragic $45,275 |
| Tohono O'odham | 0.0 /100 | #336 | Tragic $45,248 |
| Pueblo | 0.0 /100 | #337 | Tragic $45,018 |
| Chickasaw | 0.0 /100 | #338 | Tragic $44,763 |
| Kiowa | 0.0 /100 | #339 | Tragic $44,733 |
| Blacks/African Americans | 0.0 /100 | #340 | Tragic $44,381 |
| Houma | 0.0 /100 | #341 | Tragic $44,356 |
| Arapaho | 0.0 /100 | #342 | Tragic $44,003 |
| Immigrants | Yemen | 0.0 /100 | #343 | Tragic $43,591 |
| Immigrants | Congo | 0.0 /100 | #344 | Tragic $43,266 |
| Navajo | 0.0 /100 | #345 | Tragic $42,380 |