Spanish American vs Immigrants from Scotland Median Earnings
COMPARE
Spanish American
Immigrants from Scotland
Median Earnings
Median Earnings Comparison
Spanish Americans
Immigrants from Scotland
$42,316
MEDIAN EARNINGS
0.3/ 100
METRIC RATING
276th/ 347
METRIC RANK
$50,741
MEDIAN EARNINGS
99.8/ 100
METRIC RATING
75th/ 347
METRIC RANK
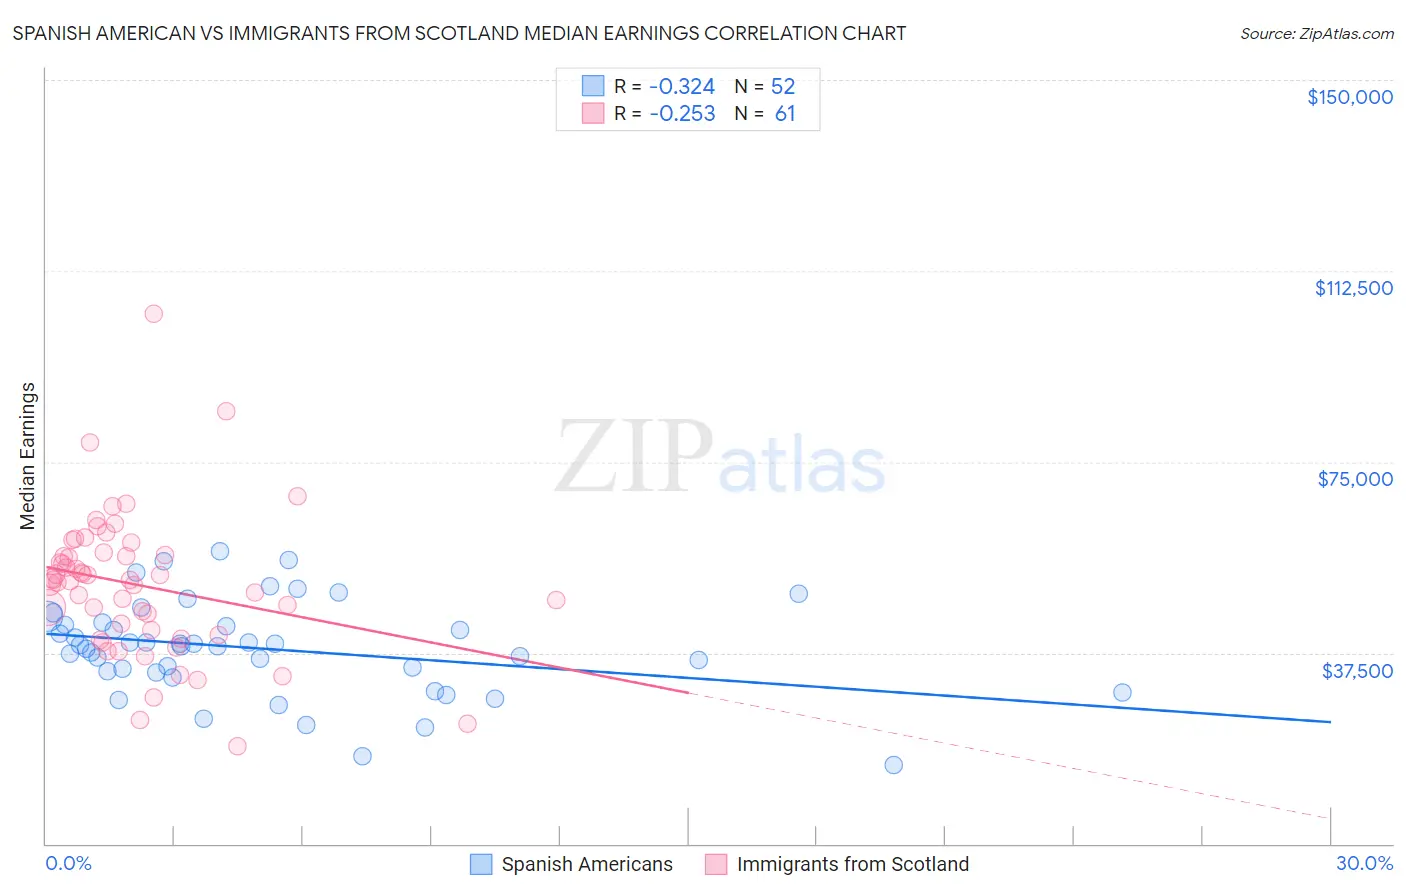
Spanish American vs Immigrants from Scotland Median Earnings Correlation Chart
The statistical analysis conducted on geographies consisting of 103,163,926 people shows a mild negative correlation between the proportion of Spanish Americans and median earnings in the United States with a correlation coefficient (R) of -0.324 and weighted average of $42,316. Similarly, the statistical analysis conducted on geographies consisting of 196,389,390 people shows a weak negative correlation between the proportion of Immigrants from Scotland and median earnings in the United States with a correlation coefficient (R) of -0.253 and weighted average of $50,741, a difference of 19.9%.
Median Earnings Correlation Summary
| Measurement | Spanish American | Immigrants from Scotland |
| Minimum | $15,345 | $19,118 |
| Maximum | $57,404 | $104,015 |
| Range | $42,059 | $84,897 |
| Mean | $38,311 | $50,819 |
| Median | $38,863 | $51,683 |
| Interquartile 25% (IQ1) | $33,792 | $41,420 |
| Interquartile 75% (IQ3) | $43,155 | $56,954 |
| Interquartile Range (IQR) | $9,363 | $15,534 |
| Standard Deviation (Sample) | $9,272 | $14,157 |
| Standard Deviation (Population) | $9,182 | $14,040 |
Similar Demographics by Median Earnings
Demographics Similar to Spanish Americans by Median Earnings
In terms of median earnings, the demographic groups most similar to Spanish Americans are Immigrants from Belize ($42,339, a difference of 0.060%), Central American ($42,280, a difference of 0.090%), Immigrants from El Salvador ($42,413, a difference of 0.23%), Immigrants from Dominica ($42,420, a difference of 0.25%), and Iroquois ($42,430, a difference of 0.27%).
| Demographics | Rating | Rank | Median Earnings |
| Belizeans | 0.5 /100 | #269 | Tragic $42,702 |
| Osage | 0.5 /100 | #270 | Tragic $42,651 |
| Pennsylvania Germans | 0.5 /100 | #271 | Tragic $42,615 |
| Iroquois | 0.4 /100 | #272 | Tragic $42,430 |
| Immigrants | Dominica | 0.4 /100 | #273 | Tragic $42,420 |
| Immigrants | El Salvador | 0.4 /100 | #274 | Tragic $42,413 |
| Immigrants | Belize | 0.3 /100 | #275 | Tragic $42,339 |
| Spanish Americans | 0.3 /100 | #276 | Tragic $42,316 |
| Central Americans | 0.3 /100 | #277 | Tragic $42,280 |
| Cajuns | 0.3 /100 | #278 | Tragic $42,189 |
| Colville | 0.2 /100 | #279 | Tragic $42,151 |
| Hmong | 0.2 /100 | #280 | Tragic $42,111 |
| Marshallese | 0.2 /100 | #281 | Tragic $41,969 |
| Africans | 0.2 /100 | #282 | Tragic $41,955 |
| Dominicans | 0.2 /100 | #283 | Tragic $41,864 |
Demographics Similar to Immigrants from Scotland by Median Earnings
In terms of median earnings, the demographic groups most similar to Immigrants from Scotland are South African ($50,752, a difference of 0.020%), Immigrants from Netherlands ($50,818, a difference of 0.15%), Immigrants from Egypt ($50,901, a difference of 0.32%), Immigrants from Italy ($50,581, a difference of 0.32%), and Immigrants from Western Europe ($50,549, a difference of 0.38%).
| Demographics | Rating | Rank | Median Earnings |
| Paraguayans | 99.9 /100 | #68 | Exceptional $51,068 |
| Mongolians | 99.8 /100 | #69 | Exceptional $51,038 |
| Lithuanians | 99.8 /100 | #70 | Exceptional $50,991 |
| Immigrants | Ukraine | 99.8 /100 | #71 | Exceptional $50,984 |
| Immigrants | Egypt | 99.8 /100 | #72 | Exceptional $50,901 |
| Immigrants | Netherlands | 99.8 /100 | #73 | Exceptional $50,818 |
| South Africans | 99.8 /100 | #74 | Exceptional $50,752 |
| Immigrants | Scotland | 99.8 /100 | #75 | Exceptional $50,741 |
| Immigrants | Italy | 99.7 /100 | #76 | Exceptional $50,581 |
| Immigrants | Western Europe | 99.7 /100 | #77 | Exceptional $50,549 |
| Argentineans | 99.6 /100 | #78 | Exceptional $50,399 |
| Laotians | 99.6 /100 | #79 | Exceptional $50,343 |
| Ukrainians | 99.6 /100 | #80 | Exceptional $50,320 |
| Immigrants | Southern Europe | 99.6 /100 | #81 | Exceptional $50,280 |
| Immigrants | Moldova | 99.5 /100 | #82 | Exceptional $50,274 |