Northern European vs Immigrants from Scotland Median Earnings
COMPARE
Northern European
Immigrants from Scotland
Median Earnings
Median Earnings Comparison
Northern Europeans
Immigrants from Scotland
$48,887
MEDIAN EARNINGS
96.9/ 100
METRIC RATING
112th/ 347
METRIC RANK
$50,741
MEDIAN EARNINGS
99.8/ 100
METRIC RATING
75th/ 347
METRIC RANK
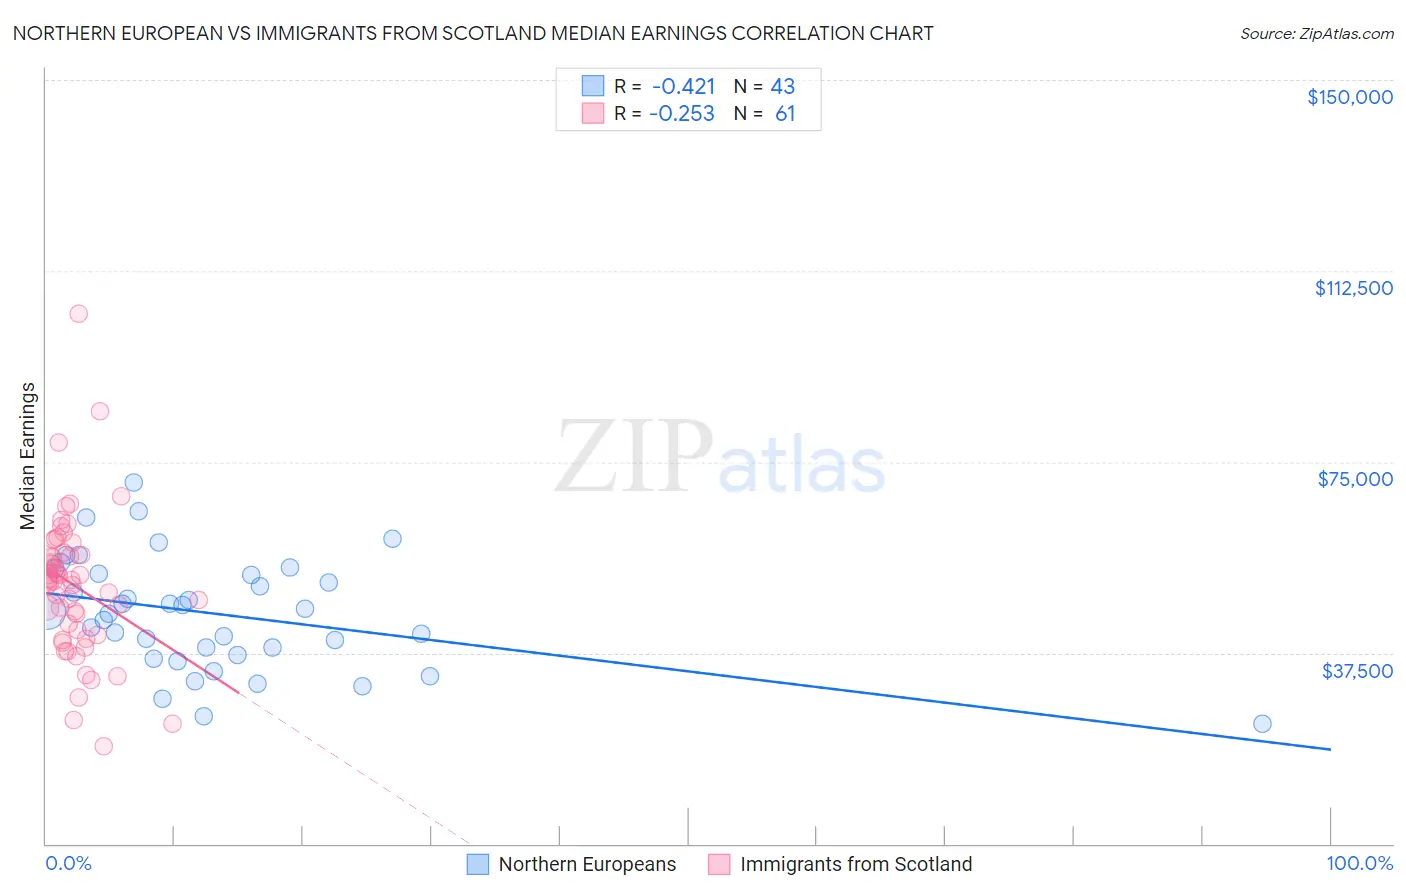
Northern European vs Immigrants from Scotland Median Earnings Correlation Chart
The statistical analysis conducted on geographies consisting of 406,030,818 people shows a moderate negative correlation between the proportion of Northern Europeans and median earnings in the United States with a correlation coefficient (R) of -0.421 and weighted average of $48,887. Similarly, the statistical analysis conducted on geographies consisting of 196,389,390 people shows a weak negative correlation between the proportion of Immigrants from Scotland and median earnings in the United States with a correlation coefficient (R) of -0.253 and weighted average of $50,741, a difference of 3.8%.
Median Earnings Correlation Summary
| Measurement | Northern European | Immigrants from Scotland |
| Minimum | $23,571 | $19,118 |
| Maximum | $70,939 | $104,015 |
| Range | $47,368 | $84,897 |
| Mean | $45,160 | $50,819 |
| Median | $45,714 | $51,683 |
| Interquartile 25% (IQ1) | $37,035 | $41,420 |
| Interquartile 75% (IQ3) | $52,998 | $56,954 |
| Interquartile Range (IQR) | $15,963 | $15,534 |
| Standard Deviation (Sample) | $10,934 | $14,157 |
| Standard Deviation (Population) | $10,806 | $14,040 |
Similar Demographics by Median Earnings
Demographics Similar to Northern Europeans by Median Earnings
In terms of median earnings, the demographic groups most similar to Northern Europeans are Immigrants from Zimbabwe ($48,913, a difference of 0.050%), Immigrants from Kuwait ($48,861, a difference of 0.050%), Immigrants from Ethiopia ($48,924, a difference of 0.070%), Syrian ($48,934, a difference of 0.10%), and Moroccan ($48,838, a difference of 0.10%).
| Demographics | Rating | Rank | Median Earnings |
| Immigrants | Western Asia | 98.4 /100 | #105 | Exceptional $49,389 |
| Immigrants | Albania | 98.4 /100 | #106 | Exceptional $49,377 |
| Immigrants | Morocco | 98.4 /100 | #107 | Exceptional $49,368 |
| Palestinians | 98.0 /100 | #108 | Exceptional $49,209 |
| Syrians | 97.1 /100 | #109 | Exceptional $48,934 |
| Immigrants | Ethiopia | 97.1 /100 | #110 | Exceptional $48,924 |
| Immigrants | Zimbabwe | 97.0 /100 | #111 | Exceptional $48,913 |
| Northern Europeans | 96.9 /100 | #112 | Exceptional $48,887 |
| Immigrants | Kuwait | 96.8 /100 | #113 | Exceptional $48,861 |
| Moroccans | 96.7 /100 | #114 | Exceptional $48,838 |
| Chinese | 96.7 /100 | #115 | Exceptional $48,836 |
| Koreans | 96.2 /100 | #116 | Exceptional $48,727 |
| Serbians | 95.9 /100 | #117 | Exceptional $48,677 |
| Immigrants | Jordan | 95.9 /100 | #118 | Exceptional $48,673 |
| Poles | 95.8 /100 | #119 | Exceptional $48,659 |
Demographics Similar to Immigrants from Scotland by Median Earnings
In terms of median earnings, the demographic groups most similar to Immigrants from Scotland are South African ($50,752, a difference of 0.020%), Immigrants from Netherlands ($50,818, a difference of 0.15%), Immigrants from Egypt ($50,901, a difference of 0.32%), Immigrants from Italy ($50,581, a difference of 0.32%), and Immigrants from Western Europe ($50,549, a difference of 0.38%).
| Demographics | Rating | Rank | Median Earnings |
| Paraguayans | 99.9 /100 | #68 | Exceptional $51,068 |
| Mongolians | 99.8 /100 | #69 | Exceptional $51,038 |
| Lithuanians | 99.8 /100 | #70 | Exceptional $50,991 |
| Immigrants | Ukraine | 99.8 /100 | #71 | Exceptional $50,984 |
| Immigrants | Egypt | 99.8 /100 | #72 | Exceptional $50,901 |
| Immigrants | Netherlands | 99.8 /100 | #73 | Exceptional $50,818 |
| South Africans | 99.8 /100 | #74 | Exceptional $50,752 |
| Immigrants | Scotland | 99.8 /100 | #75 | Exceptional $50,741 |
| Immigrants | Italy | 99.7 /100 | #76 | Exceptional $50,581 |
| Immigrants | Western Europe | 99.7 /100 | #77 | Exceptional $50,549 |
| Argentineans | 99.6 /100 | #78 | Exceptional $50,399 |
| Laotians | 99.6 /100 | #79 | Exceptional $50,343 |
| Ukrainians | 99.6 /100 | #80 | Exceptional $50,320 |
| Immigrants | Southern Europe | 99.6 /100 | #81 | Exceptional $50,280 |
| Immigrants | Moldova | 99.5 /100 | #82 | Exceptional $50,274 |