Slovene vs Turkish Wage/Income Gap
COMPARE
Slovene
Turkish
Wage/Income Gap
Wage/Income Gap Comparison
Slovenes
Turks
28.3%
WAGE/INCOME GAP
0.3/ 100
METRIC RATING
295th/ 347
METRIC RANK
27.7%
WAGE/INCOME GAP
1.0/ 100
METRIC RATING
267th/ 347
METRIC RANK
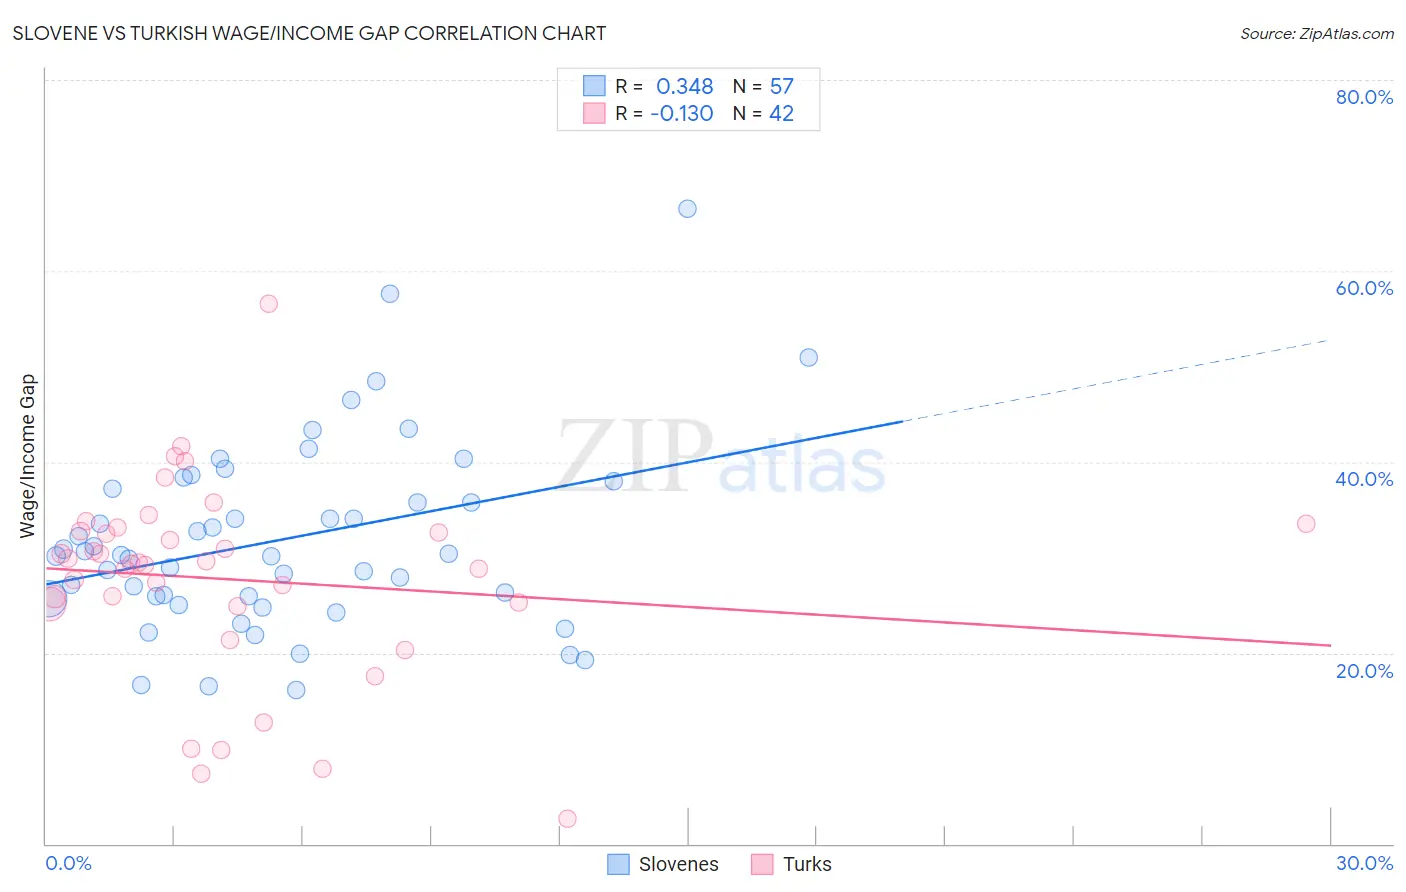
Slovene vs Turkish Wage/Income Gap Correlation Chart
The statistical analysis conducted on geographies consisting of 261,240,856 people shows a mild positive correlation between the proportion of Slovenes and wage/income gap percentage in the United States with a correlation coefficient (R) of 0.348 and weighted average of 28.3%. Similarly, the statistical analysis conducted on geographies consisting of 271,781,198 people shows a poor negative correlation between the proportion of Turks and wage/income gap percentage in the United States with a correlation coefficient (R) of -0.130 and weighted average of 27.7%, a difference of 2.1%.
Wage/Income Gap Correlation Summary
| Measurement | Slovene | Turkish |
| Minimum | 16.1% | 2.6% |
| Maximum | 66.5% | 56.6% |
| Range | 50.5% | 54.0% |
| Mean | 31.9% | 27.7% |
| Median | 30.2% | 29.3% |
| Interquartile 25% (IQ1) | 25.8% | 25.1% |
| Interquartile 75% (IQ3) | 37.6% | 32.7% |
| Interquartile Range (IQR) | 11.9% | 7.6% |
| Standard Deviation (Sample) | 9.9% | 10.3% |
| Standard Deviation (Population) | 9.8% | 10.2% |
Similar Demographics by Wage/Income Gap
Demographics Similar to Slovenes by Wage/Income Gap
In terms of wage/income gap, the demographic groups most similar to Slovenes are Northern European (28.3%, a difference of 0.0%), Greek (28.2%, a difference of 0.13%), Immigrants from Israel (28.2%, a difference of 0.15%), Immigrants from Australia (28.2%, a difference of 0.26%), and Czechoslovakian (28.2%, a difference of 0.32%).
| Demographics | Rating | Rank | Wage/Income Gap |
| Choctaw | 0.4 /100 | #288 | Tragic 28.1% |
| Canadians | 0.3 /100 | #289 | Tragic 28.1% |
| Australians | 0.3 /100 | #290 | Tragic 28.2% |
| Czechoslovakians | 0.3 /100 | #291 | Tragic 28.2% |
| Immigrants | Australia | 0.3 /100 | #292 | Tragic 28.2% |
| Immigrants | Israel | 0.3 /100 | #293 | Tragic 28.2% |
| Greeks | 0.3 /100 | #294 | Tragic 28.2% |
| Slovenes | 0.3 /100 | #295 | Tragic 28.3% |
| Northern Europeans | 0.3 /100 | #296 | Tragic 28.3% |
| Immigrants | North America | 0.2 /100 | #297 | Tragic 28.4% |
| Austrians | 0.2 /100 | #298 | Tragic 28.4% |
| Immigrants | North Macedonia | 0.2 /100 | #299 | Tragic 28.4% |
| Immigrants | Northern Europe | 0.2 /100 | #300 | Tragic 28.5% |
| Immigrants | Canada | 0.2 /100 | #301 | Tragic 28.5% |
| Scotch-Irish | 0.2 /100 | #302 | Tragic 28.5% |
Demographics Similar to Turks by Wage/Income Gap
In terms of wage/income gap, the demographic groups most similar to Turks are Immigrants from Switzerland (27.7%, a difference of 0.020%), Serbian (27.7%, a difference of 0.020%), Hmong (27.7%, a difference of 0.020%), New Zealander (27.7%, a difference of 0.080%), and Potawatomi (27.7%, a difference of 0.090%).
| Demographics | Rating | Rank | Wage/Income Gap |
| Tongans | 1.7 /100 | #260 | Tragic 27.5% |
| Immigrants | Germany | 1.5 /100 | #261 | Tragic 27.5% |
| Immigrants | Lebanon | 1.5 /100 | #262 | Tragic 27.5% |
| Syrians | 1.4 /100 | #263 | Tragic 27.6% |
| Immigrants | Switzerland | 1.0 /100 | #264 | Tragic 27.7% |
| Serbians | 1.0 /100 | #265 | Tragic 27.7% |
| Hmong | 1.0 /100 | #266 | Tragic 27.7% |
| Turks | 1.0 /100 | #267 | Tragic 27.7% |
| New Zealanders | 1.0 /100 | #268 | Tragic 27.7% |
| Potawatomi | 0.9 /100 | #269 | Tragic 27.7% |
| Immigrants | Western Europe | 0.9 /100 | #270 | Tragic 27.8% |
| Ute | 0.8 /100 | #271 | Tragic 27.8% |
| Immigrants | Korea | 0.8 /100 | #272 | Tragic 27.8% |
| Bulgarians | 0.7 /100 | #273 | Tragic 27.8% |
| Americans | 0.7 /100 | #274 | Tragic 27.8% |