Slovene vs Basque Median Female Earnings
COMPARE
Slovene
Basque
Median Female Earnings
Median Female Earnings Comparison
Slovenes
Basques
$39,817
MEDIAN FEMALE EARNINGS
56.2/ 100
METRIC RATING
170th/ 347
METRIC RANK
$38,352
MEDIAN FEMALE EARNINGS
5.7/ 100
METRIC RATING
230th/ 347
METRIC RANK
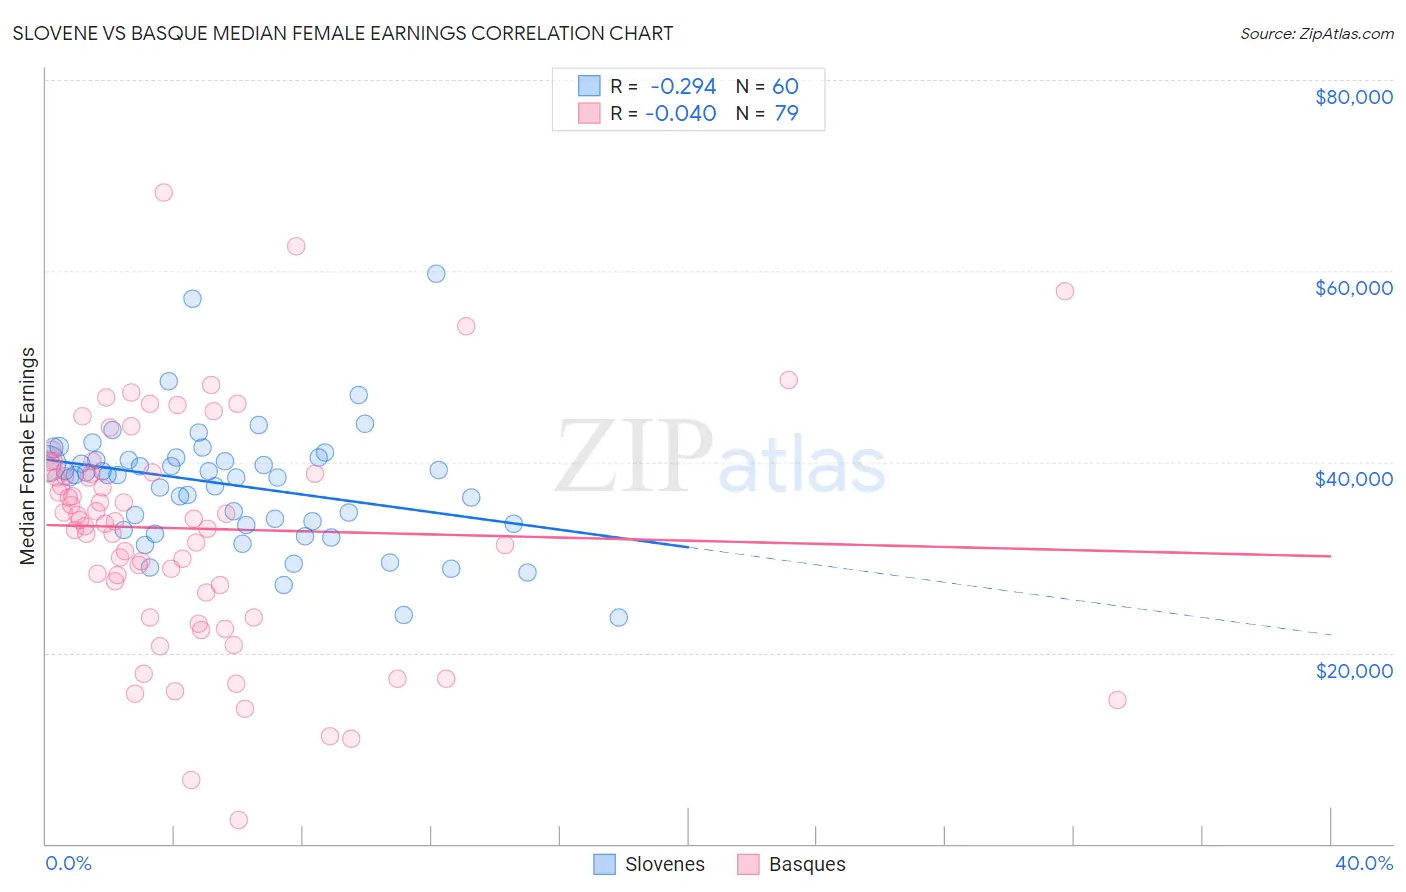
Slovene vs Basque Median Female Earnings Correlation Chart
The statistical analysis conducted on geographies consisting of 261,275,001 people shows a weak negative correlation between the proportion of Slovenes and median female earnings in the United States with a correlation coefficient (R) of -0.294 and weighted average of $39,817. Similarly, the statistical analysis conducted on geographies consisting of 165,731,854 people shows no correlation between the proportion of Basques and median female earnings in the United States with a correlation coefficient (R) of -0.040 and weighted average of $38,352, a difference of 3.8%.
Median Female Earnings Correlation Summary
| Measurement | Slovene | Basque |
| Minimum | $23,750 | $2,499 |
| Maximum | $59,643 | $68,214 |
| Range | $35,893 | $65,715 |
| Mean | $37,579 | $33,005 |
| Median | $38,639 | $33,892 |
| Interquartile 25% (IQ1) | $33,473 | $26,382 |
| Interquartile 75% (IQ3) | $40,326 | $39,564 |
| Interquartile Range (IQR) | $6,853 | $13,182 |
| Standard Deviation (Sample) | $6,516 | $12,137 |
| Standard Deviation (Population) | $6,461 | $12,060 |
Similar Demographics by Median Female Earnings
Demographics Similar to Slovenes by Median Female Earnings
In terms of median female earnings, the demographic groups most similar to Slovenes are Immigrants from Portugal ($39,788, a difference of 0.070%), Kenyan ($39,860, a difference of 0.11%), British ($39,772, a difference of 0.11%), Immigrants from Peru ($39,871, a difference of 0.13%), and Immigrants from Ghana ($39,894, a difference of 0.19%).
| Demographics | Rating | Rank | Median Female Earnings |
| Lebanese | 65.5 /100 | #163 | Good $40,006 |
| Immigrants | Saudi Arabia | 62.9 /100 | #164 | Good $39,952 |
| Immigrants | Bangladesh | 60.8 /100 | #165 | Good $39,910 |
| Immigrants | Ghana | 60.0 /100 | #166 | Good $39,894 |
| Luxembourgers | 59.9 /100 | #167 | Average $39,891 |
| Immigrants | Peru | 58.9 /100 | #168 | Average $39,871 |
| Kenyans | 58.4 /100 | #169 | Average $39,860 |
| Slovenes | 56.2 /100 | #170 | Average $39,817 |
| Immigrants | Portugal | 54.7 /100 | #171 | Average $39,788 |
| British | 53.8 /100 | #172 | Average $39,772 |
| Canadians | 51.4 /100 | #173 | Average $39,724 |
| South Americans | 50.0 /100 | #174 | Average $39,698 |
| Immigrants | South America | 47.2 /100 | #175 | Average $39,643 |
| Nigerians | 47.0 /100 | #176 | Average $39,641 |
| Costa Ricans | 46.1 /100 | #177 | Average $39,622 |
Demographics Similar to Basques by Median Female Earnings
In terms of median female earnings, the demographic groups most similar to Basques are Somali ($38,333, a difference of 0.050%), Belgian ($38,382, a difference of 0.080%), Subsaharan African ($38,391, a difference of 0.10%), Scottish ($38,397, a difference of 0.12%), and Scandinavian ($38,306, a difference of 0.12%).
| Demographics | Rating | Rank | Median Female Earnings |
| Immigrants | Sudan | 7.8 /100 | #223 | Tragic $38,511 |
| Native Hawaiians | 7.1 /100 | #224 | Tragic $38,461 |
| French | 7.0 /100 | #225 | Tragic $38,457 |
| French Canadians | 6.8 /100 | #226 | Tragic $38,436 |
| Scottish | 6.3 /100 | #227 | Tragic $38,397 |
| Sub-Saharan Africans | 6.2 /100 | #228 | Tragic $38,391 |
| Belgians | 6.1 /100 | #229 | Tragic $38,382 |
| Basques | 5.7 /100 | #230 | Tragic $38,352 |
| Somalis | 5.5 /100 | #231 | Tragic $38,333 |
| Scandinavians | 5.2 /100 | #232 | Tragic $38,306 |
| Tongans | 5.1 /100 | #233 | Tragic $38,288 |
| Celtics | 5.0 /100 | #234 | Tragic $38,283 |
| Sudanese | 4.4 /100 | #235 | Tragic $38,215 |
| Liberians | 4.4 /100 | #236 | Tragic $38,215 |
| Immigrants | Cabo Verde | 4.3 /100 | #237 | Tragic $38,208 |