Slovene vs Basque Cognitive Disability
COMPARE
Slovene
Basque
Cognitive Disability
Cognitive Disability Comparison
Slovenes
Basques
16.5%
COGNITIVE DISABILITY
99.9/ 100
METRIC RATING
37th/ 347
METRIC RANK
17.1%
COGNITIVE DISABILITY
85.5/ 100
METRIC RATING
150th/ 347
METRIC RANK
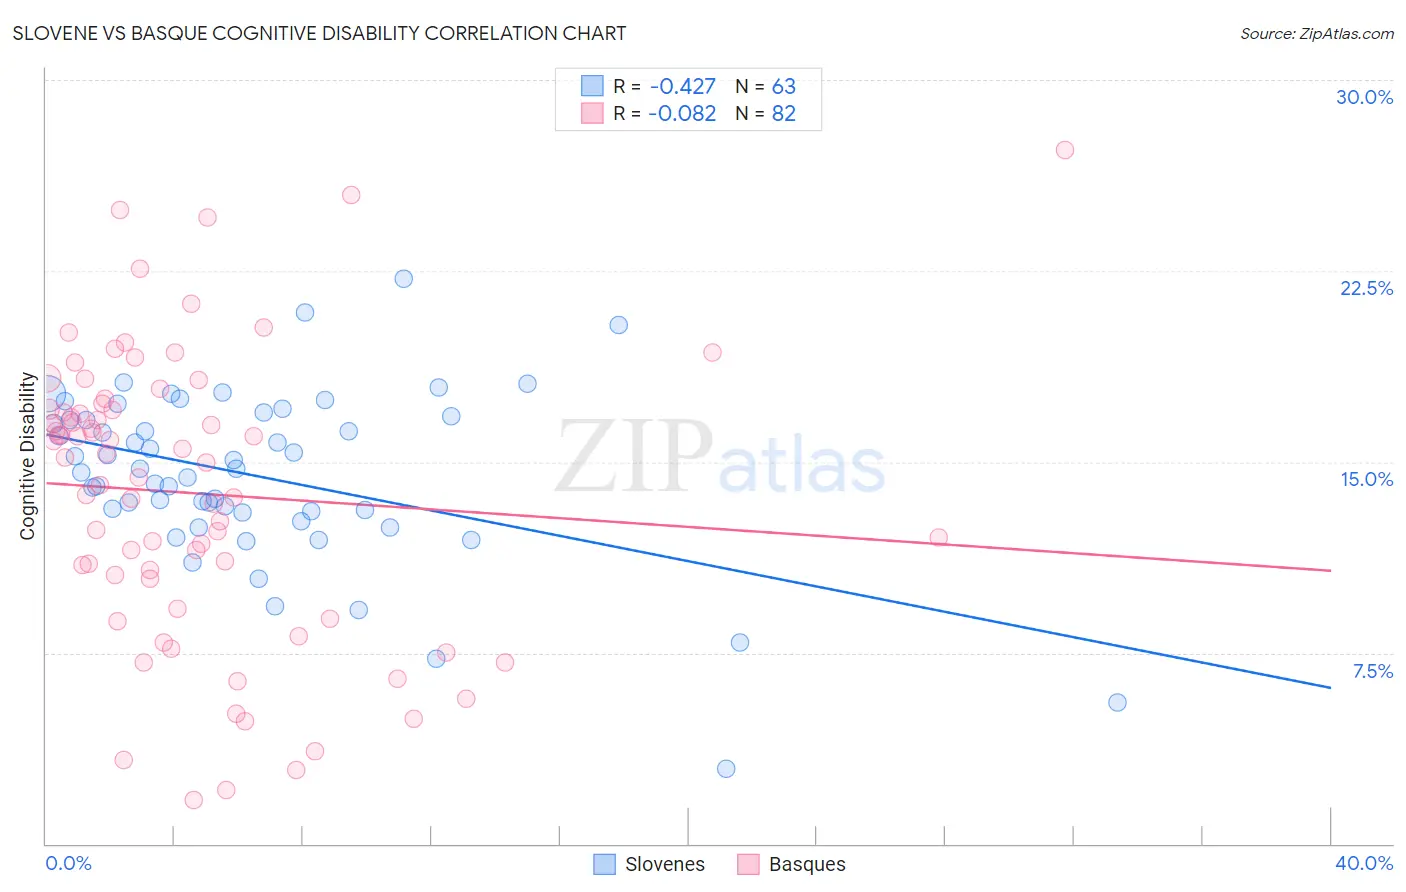
Slovene vs Basque Cognitive Disability Correlation Chart
The statistical analysis conducted on geographies consisting of 261,350,780 people shows a moderate negative correlation between the proportion of Slovenes and percentage of population with cognitive disability in the United States with a correlation coefficient (R) of -0.427 and weighted average of 16.5%. Similarly, the statistical analysis conducted on geographies consisting of 165,778,299 people shows a slight negative correlation between the proportion of Basques and percentage of population with cognitive disability in the United States with a correlation coefficient (R) of -0.082 and weighted average of 17.1%, a difference of 3.7%.
Cognitive Disability Correlation Summary
| Measurement | Slovene | Basque |
| Minimum | 2.9% | 1.7% |
| Maximum | 22.2% | 27.3% |
| Range | 19.2% | 25.6% |
| Mean | 14.4% | 13.8% |
| Median | 14.7% | 15.1% |
| Interquartile 25% (IQ1) | 13.0% | 10.4% |
| Interquartile 75% (IQ3) | 16.8% | 17.1% |
| Interquartile Range (IQR) | 3.8% | 6.7% |
| Standard Deviation (Sample) | 3.4% | 5.7% |
| Standard Deviation (Population) | 3.4% | 5.6% |
Similar Demographics by Cognitive Disability
Demographics Similar to Slovenes by Cognitive Disability
In terms of cognitive disability, the demographic groups most similar to Slovenes are Immigrants from Eastern Europe (16.5%, a difference of 0.020%), Bolivian (16.5%, a difference of 0.090%), Immigrants from Belarus (16.5%, a difference of 0.10%), Cuban (16.5%, a difference of 0.11%), and Hungarian (16.5%, a difference of 0.12%).
| Demographics | Rating | Rank | Cognitive Disability |
| Czechs | 99.9 /100 | #30 | Exceptional 16.4% |
| Immigrants | Romania | 99.9 /100 | #31 | Exceptional 16.4% |
| Immigrants | Israel | 99.9 /100 | #32 | Exceptional 16.4% |
| Italians | 99.9 /100 | #33 | Exceptional 16.4% |
| Russians | 99.9 /100 | #34 | Exceptional 16.4% |
| Slovaks | 99.9 /100 | #35 | Exceptional 16.4% |
| Greeks | 99.9 /100 | #36 | Exceptional 16.4% |
| Slovenes | 99.9 /100 | #37 | Exceptional 16.5% |
| Immigrants | Eastern Europe | 99.9 /100 | #38 | Exceptional 16.5% |
| Bolivians | 99.9 /100 | #39 | Exceptional 16.5% |
| Immigrants | Belarus | 99.9 /100 | #40 | Exceptional 16.5% |
| Cubans | 99.9 /100 | #41 | Exceptional 16.5% |
| Hungarians | 99.9 /100 | #42 | Exceptional 16.5% |
| Immigrants | Canada | 99.8 /100 | #43 | Exceptional 16.5% |
| Macedonians | 99.8 /100 | #44 | Exceptional 16.5% |
Demographics Similar to Basques by Cognitive Disability
In terms of cognitive disability, the demographic groups most similar to Basques are French Canadian (17.1%, a difference of 0.010%), Cypriot (17.1%, a difference of 0.010%), Scotch-Irish (17.1%, a difference of 0.030%), Syrian (17.1%, a difference of 0.13%), and Immigrants from Indonesia (17.1%, a difference of 0.15%).
| Demographics | Rating | Rank | Cognitive Disability |
| British | 89.3 /100 | #143 | Excellent 17.0% |
| Immigrants | Brazil | 89.3 /100 | #144 | Excellent 17.0% |
| Immigrants | South Eastern Asia | 88.7 /100 | #145 | Excellent 17.0% |
| Costa Ricans | 88.0 /100 | #146 | Excellent 17.0% |
| Scotch-Irish | 85.9 /100 | #147 | Excellent 17.1% |
| French Canadians | 85.7 /100 | #148 | Excellent 17.1% |
| Cypriots | 85.7 /100 | #149 | Excellent 17.1% |
| Basques | 85.5 /100 | #150 | Excellent 17.1% |
| Syrians | 83.0 /100 | #151 | Excellent 17.1% |
| Immigrants | Indonesia | 82.7 /100 | #152 | Excellent 17.1% |
| Immigrants | Kazakhstan | 80.5 /100 | #153 | Excellent 17.1% |
| Immigrants | Malaysia | 79.3 /100 | #154 | Good 17.1% |
| Brazilians | 78.9 /100 | #155 | Good 17.1% |
| Sri Lankans | 78.9 /100 | #156 | Good 17.1% |
| Immigrants | Australia | 76.0 /100 | #157 | Good 17.1% |