Slovak vs Uruguayan Per Capita Income
COMPARE
Slovak
Uruguayan
Per Capita Income
Per Capita Income Comparison
Slovaks
Uruguayans
$44,229
PER CAPITA INCOME
65.4/ 100
METRIC RATING
156th/ 347
METRIC RANK
$44,318
PER CAPITA INCOME
67.6/ 100
METRIC RATING
155th/ 347
METRIC RANK
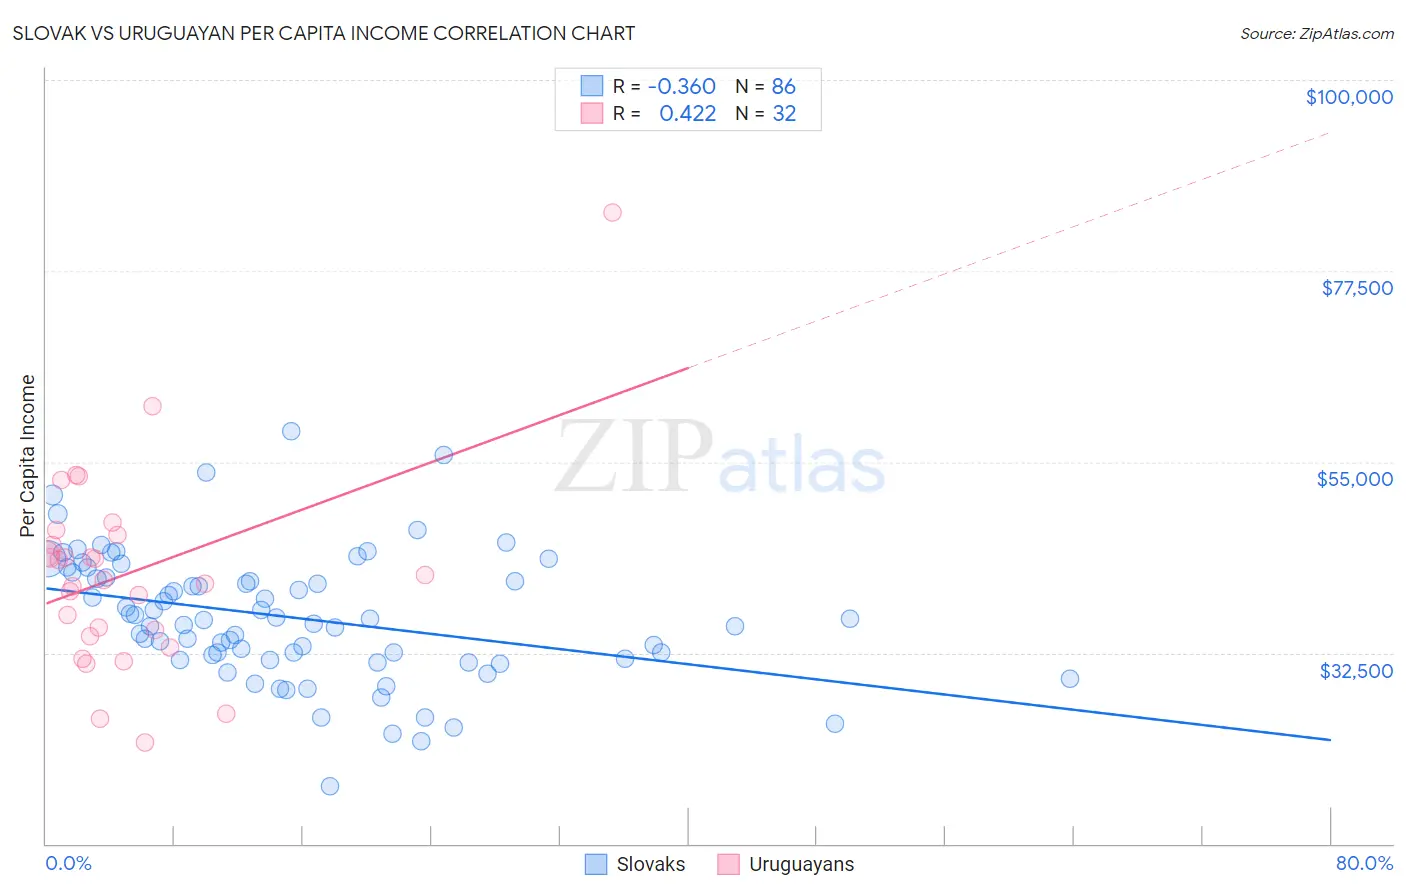
Slovak vs Uruguayan Per Capita Income Correlation Chart
The statistical analysis conducted on geographies consisting of 397,898,984 people shows a mild negative correlation between the proportion of Slovaks and per capita income in the United States with a correlation coefficient (R) of -0.360 and weighted average of $44,229. Similarly, the statistical analysis conducted on geographies consisting of 144,785,218 people shows a moderate positive correlation between the proportion of Uruguayans and per capita income in the United States with a correlation coefficient (R) of 0.422 and weighted average of $44,318, a difference of 0.20%.
Per Capita Income Correlation Summary
| Measurement | Slovak | Uruguayan |
| Minimum | $16,734 | $21,859 |
| Maximum | $58,546 | $84,313 |
| Range | $41,812 | $62,454 |
| Mean | $36,677 | $41,831 |
| Median | $36,437 | $41,436 |
| Interquartile 25% (IQ1) | $31,763 | $34,824 |
| Interquartile 75% (IQ3) | $41,360 | $45,774 |
| Interquartile Range (IQR) | $9,597 | $10,950 |
| Standard Deviation (Sample) | $7,565 | $11,692 |
| Standard Deviation (Population) | $7,521 | $11,508 |
Demographics Similar to Slovaks and Uruguayans by Per Capita Income
In terms of per capita income, the demographic groups most similar to Slovaks are South American Indian ($44,206, a difference of 0.050%), Immigrants from Nepal ($44,187, a difference of 0.090%), South American ($44,114, a difference of 0.26%), Portuguese ($44,362, a difference of 0.30%), and Danish ($44,095, a difference of 0.30%). Similarly, the demographic groups most similar to Uruguayans are Portuguese ($44,362, a difference of 0.10%), South American Indian ($44,206, a difference of 0.25%), Scottish ($44,440, a difference of 0.27%), Immigrants from Nepal ($44,187, a difference of 0.30%), and Norwegian ($44,480, a difference of 0.36%).
| Demographics | Rating | Rank | Per Capita Income |
| Immigrants | Afghanistan | 78.0 /100 | #145 | Good $44,790 |
| Irish | 75.8 /100 | #146 | Good $44,679 |
| Czechs | 74.1 /100 | #147 | Good $44,595 |
| Immigrants | Armenia | 73.1 /100 | #148 | Good $44,552 |
| Koreans | 72.5 /100 | #149 | Good $44,522 |
| Immigrants | Eritrea | 72.1 /100 | #150 | Good $44,509 |
| Norwegians | 71.5 /100 | #151 | Good $44,480 |
| Peruvians | 71.5 /100 | #152 | Good $44,479 |
| Scottish | 70.6 /100 | #153 | Good $44,440 |
| Portuguese | 68.7 /100 | #154 | Good $44,362 |
| Uruguayans | 67.6 /100 | #155 | Good $44,318 |
| Slovaks | 65.4 /100 | #156 | Good $44,229 |
| South American Indians | 64.8 /100 | #157 | Good $44,206 |
| Immigrants | Nepal | 64.3 /100 | #158 | Good $44,187 |
| South Americans | 62.4 /100 | #159 | Good $44,114 |
| Danes | 61.9 /100 | #160 | Good $44,095 |
| Costa Ricans | 61.8 /100 | #161 | Good $44,090 |
| Swiss | 61.4 /100 | #162 | Good $44,076 |
| Immigrants | South America | 61.2 /100 | #163 | Good $44,068 |
| Sri Lankans | 59.8 /100 | #164 | Average $44,014 |
| Immigrants | Philippines | 59.4 /100 | #165 | Average $44,000 |