Slovak vs Immigrants from Taiwan Per Capita Income
COMPARE
Slovak
Immigrants from Taiwan
Per Capita Income
Per Capita Income Comparison
Slovaks
Immigrants from Taiwan
$44,229
PER CAPITA INCOME
65.4/ 100
METRIC RATING
156th/ 347
METRIC RANK
$57,742
PER CAPITA INCOME
100.0/ 100
METRIC RATING
6th/ 347
METRIC RANK
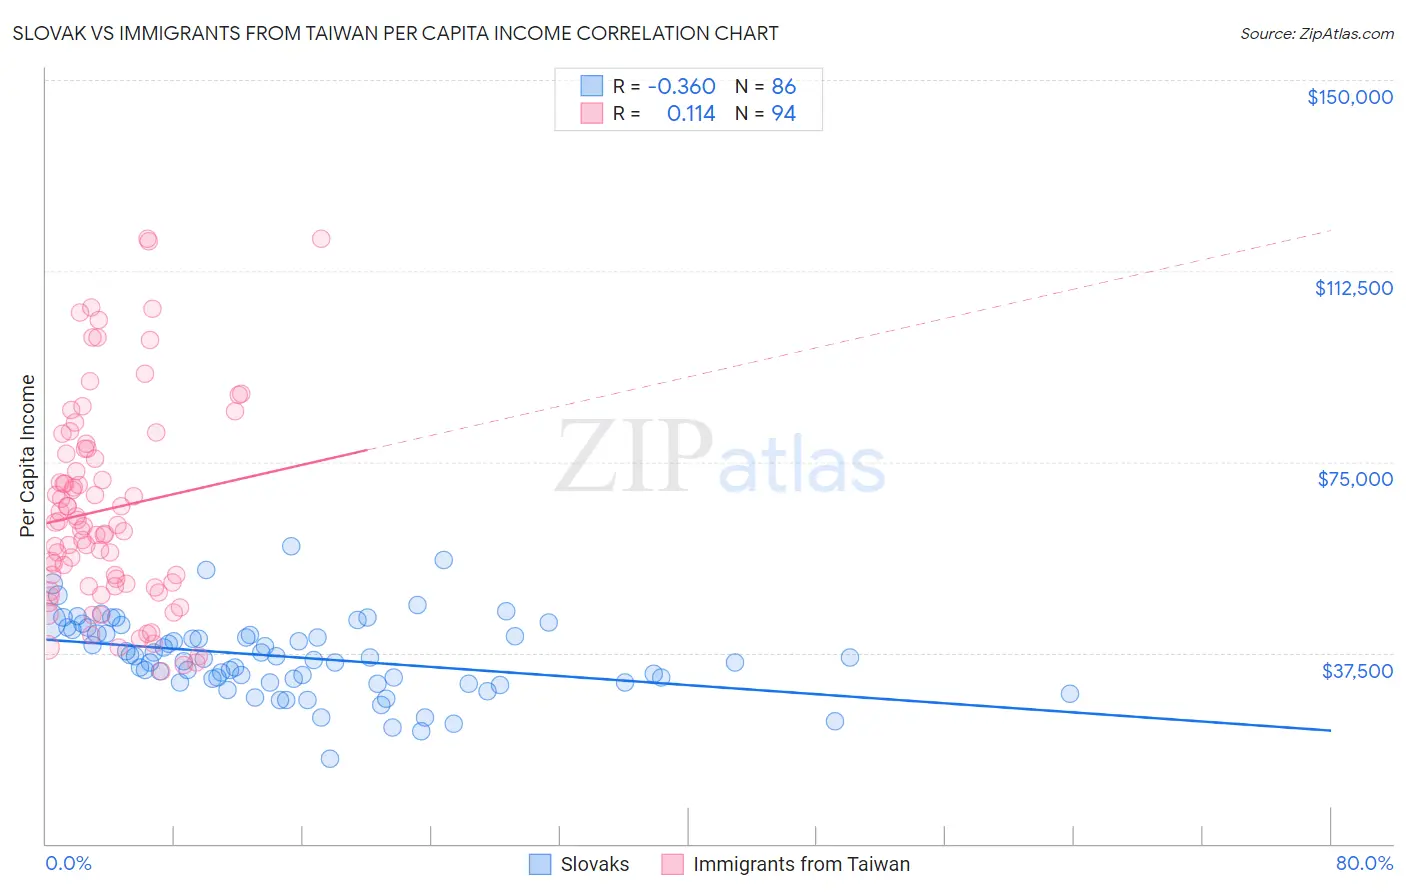
Slovak vs Immigrants from Taiwan Per Capita Income Correlation Chart
The statistical analysis conducted on geographies consisting of 397,898,984 people shows a mild negative correlation between the proportion of Slovaks and per capita income in the United States with a correlation coefficient (R) of -0.360 and weighted average of $44,229. Similarly, the statistical analysis conducted on geographies consisting of 298,270,368 people shows a poor positive correlation between the proportion of Immigrants from Taiwan and per capita income in the United States with a correlation coefficient (R) of 0.114 and weighted average of $57,742, a difference of 30.5%.
Per Capita Income Correlation Summary
| Measurement | Slovak | Immigrants from Taiwan |
| Minimum | $16,734 | $33,786 |
| Maximum | $58,546 | $118,914 |
| Range | $41,812 | $85,128 |
| Mean | $36,677 | $65,673 |
| Median | $36,437 | $62,475 |
| Interquartile 25% (IQ1) | $31,763 | $50,616 |
| Interquartile 75% (IQ3) | $41,360 | $77,568 |
| Interquartile Range (IQR) | $9,597 | $26,952 |
| Standard Deviation (Sample) | $7,565 | $20,163 |
| Standard Deviation (Population) | $7,521 | $20,056 |
Similar Demographics by Per Capita Income
Demographics Similar to Slovaks by Per Capita Income
In terms of per capita income, the demographic groups most similar to Slovaks are South American Indian ($44,206, a difference of 0.050%), Immigrants from Nepal ($44,187, a difference of 0.090%), Uruguayan ($44,318, a difference of 0.20%), South American ($44,114, a difference of 0.26%), and Portuguese ($44,362, a difference of 0.30%).
| Demographics | Rating | Rank | Per Capita Income |
| Koreans | 72.5 /100 | #149 | Good $44,522 |
| Immigrants | Eritrea | 72.1 /100 | #150 | Good $44,509 |
| Norwegians | 71.5 /100 | #151 | Good $44,480 |
| Peruvians | 71.5 /100 | #152 | Good $44,479 |
| Scottish | 70.6 /100 | #153 | Good $44,440 |
| Portuguese | 68.7 /100 | #154 | Good $44,362 |
| Uruguayans | 67.6 /100 | #155 | Good $44,318 |
| Slovaks | 65.4 /100 | #156 | Good $44,229 |
| South American Indians | 64.8 /100 | #157 | Good $44,206 |
| Immigrants | Nepal | 64.3 /100 | #158 | Good $44,187 |
| South Americans | 62.4 /100 | #159 | Good $44,114 |
| Danes | 61.9 /100 | #160 | Good $44,095 |
| Costa Ricans | 61.8 /100 | #161 | Good $44,090 |
| Swiss | 61.4 /100 | #162 | Good $44,076 |
| Immigrants | South America | 61.2 /100 | #163 | Good $44,068 |
Demographics Similar to Immigrants from Taiwan by Per Capita Income
In terms of per capita income, the demographic groups most similar to Immigrants from Taiwan are Immigrants from Iran ($57,759, a difference of 0.030%), Immigrants from Australia ($57,953, a difference of 0.37%), Immigrants from Israel ($57,384, a difference of 0.62%), Immigrants from Singapore ($58,353, a difference of 1.1%), and Iranian ($58,786, a difference of 1.8%).
| Demographics | Rating | Rank | Per Capita Income |
| Filipinos | 100.0 /100 | #1 | Exceptional $59,066 |
| Iranians | 100.0 /100 | #2 | Exceptional $58,786 |
| Immigrants | Singapore | 100.0 /100 | #3 | Exceptional $58,353 |
| Immigrants | Australia | 100.0 /100 | #4 | Exceptional $57,953 |
| Immigrants | Iran | 100.0 /100 | #5 | Exceptional $57,759 |
| Immigrants | Taiwan | 100.0 /100 | #6 | Exceptional $57,742 |
| Immigrants | Israel | 100.0 /100 | #7 | Exceptional $57,384 |
| Immigrants | Hong Kong | 100.0 /100 | #8 | Exceptional $56,709 |
| Immigrants | Ireland | 100.0 /100 | #9 | Exceptional $56,584 |
| Okinawans | 100.0 /100 | #10 | Exceptional $55,817 |
| Eastern Europeans | 100.0 /100 | #11 | Exceptional $55,780 |
| Immigrants | Sweden | 100.0 /100 | #12 | Exceptional $55,582 |
| Immigrants | India | 100.0 /100 | #13 | Exceptional $55,268 |
| Immigrants | Belgium | 100.0 /100 | #14 | Exceptional $55,082 |
| Cypriots | 100.0 /100 | #15 | Exceptional $54,899 |