Slovak vs Paraguayan Median Family Income
COMPARE
Slovak
Paraguayan
Median Family Income
Median Family Income Comparison
Slovaks
Paraguayans
$103,729
MEDIAN FAMILY INCOME
63.1/ 100
METRIC RATING
165th/ 347
METRIC RANK
$114,016
MEDIAN FAMILY INCOME
99.7/ 100
METRIC RATING
66th/ 347
METRIC RANK
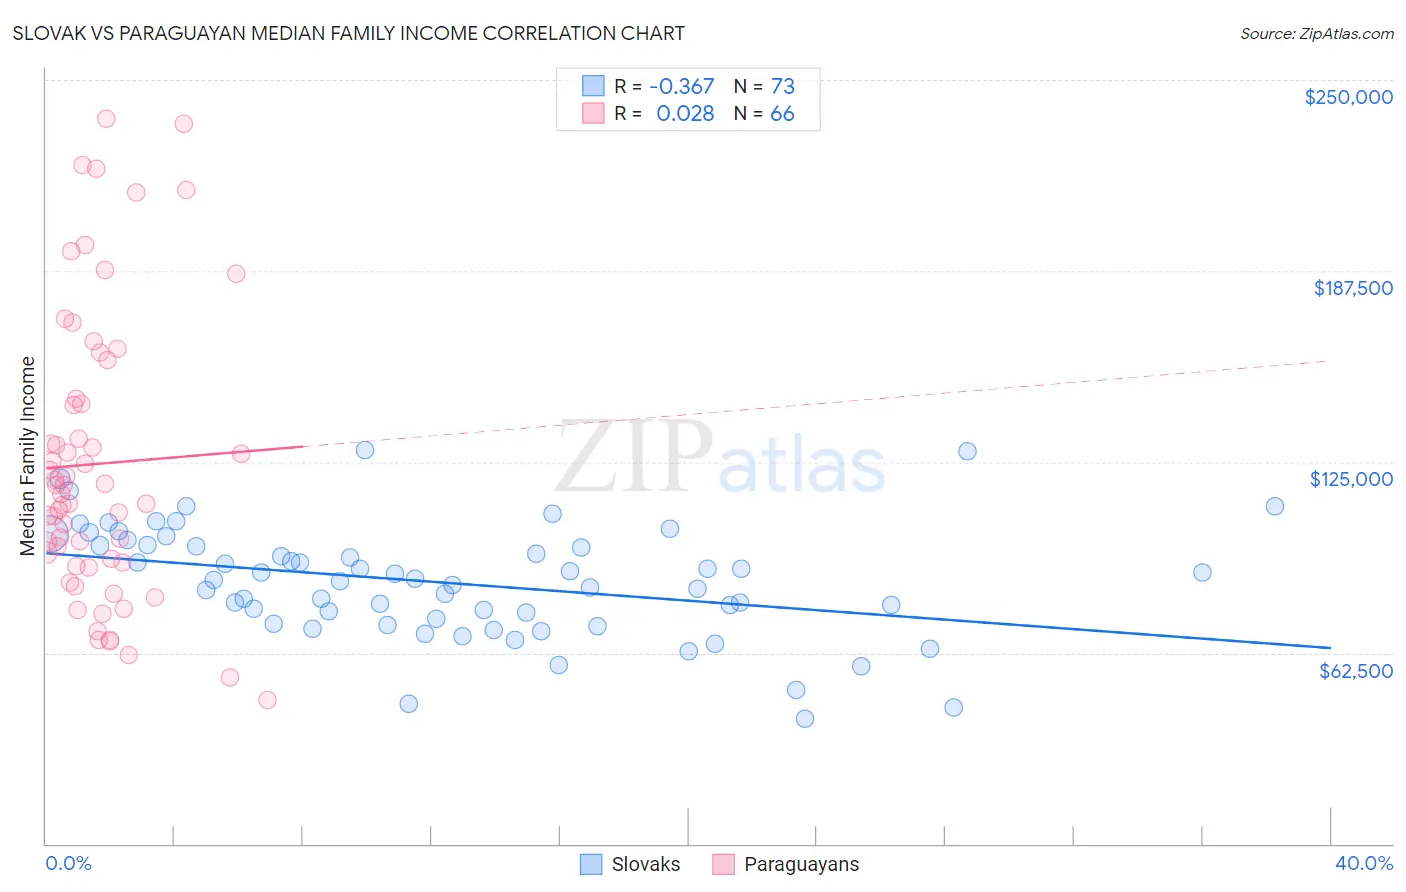
Slovak vs Paraguayan Median Family Income Correlation Chart
The statistical analysis conducted on geographies consisting of 397,537,551 people shows a mild negative correlation between the proportion of Slovaks and median family income in the United States with a correlation coefficient (R) of -0.367 and weighted average of $103,729. Similarly, the statistical analysis conducted on geographies consisting of 95,094,698 people shows no correlation between the proportion of Paraguayans and median family income in the United States with a correlation coefficient (R) of 0.028 and weighted average of $114,016, a difference of 9.9%.
Median Family Income Correlation Summary
| Measurement | Slovak | Paraguayan |
| Minimum | $40,809 | $47,188 |
| Maximum | $128,732 | $237,188 |
| Range | $87,923 | $190,000 |
| Mean | $85,532 | $124,379 |
| Median | $86,184 | $115,994 |
| Interquartile 25% (IQ1) | $72,785 | $91,993 |
| Interquartile 75% (IQ3) | $97,619 | $145,560 |
| Interquartile Range (IQR) | $24,833 | $53,567 |
| Standard Deviation (Sample) | $18,291 | $46,622 |
| Standard Deviation (Population) | $18,165 | $46,268 |
Similar Demographics by Median Family Income
Demographics Similar to Slovaks by Median Family Income
In terms of median family income, the demographic groups most similar to Slovaks are English ($103,684, a difference of 0.040%), South American Indian ($103,624, a difference of 0.10%), Sierra Leonean ($103,859, a difference of 0.13%), Immigrants from Peru ($103,534, a difference of 0.19%), and Immigrants from Sierra Leone ($103,990, a difference of 0.25%).
| Demographics | Rating | Rank | Median Family Income |
| Scandinavians | 70.8 /100 | #158 | Good $104,410 |
| Swiss | 70.7 /100 | #159 | Good $104,396 |
| Scottish | 69.5 /100 | #160 | Good $104,288 |
| Icelanders | 69.4 /100 | #161 | Good $104,282 |
| Immigrants | Sierra Leone | 66.2 /100 | #162 | Good $103,990 |
| Costa Ricans | 66.2 /100 | #163 | Good $103,989 |
| Sierra Leoneans | 64.7 /100 | #164 | Good $103,859 |
| Slovaks | 63.1 /100 | #165 | Good $103,729 |
| English | 62.6 /100 | #166 | Good $103,684 |
| South American Indians | 61.9 /100 | #167 | Good $103,624 |
| Immigrants | Peru | 60.8 /100 | #168 | Good $103,534 |
| Czechoslovakians | 57.6 /100 | #169 | Average $103,273 |
| Immigrants | Uzbekistan | 56.6 /100 | #170 | Average $103,197 |
| Alsatians | 54.3 /100 | #171 | Average $103,010 |
| Immigrants | Eritrea | 51.9 /100 | #172 | Average $102,823 |
Demographics Similar to Paraguayans by Median Family Income
In terms of median family income, the demographic groups most similar to Paraguayans are Egyptian ($114,119, a difference of 0.090%), Immigrants from Spain ($113,815, a difference of 0.18%), Immigrants from Scotland ($114,392, a difference of 0.33%), Immigrants from Pakistan ($114,406, a difference of 0.34%), and Mongolian ($114,553, a difference of 0.47%).
| Demographics | Rating | Rank | Median Family Income |
| Immigrants | Netherlands | 99.8 /100 | #59 | Exceptional $114,987 |
| Immigrants | Latvia | 99.8 /100 | #60 | Exceptional $114,826 |
| Immigrants | Belarus | 99.8 /100 | #61 | Exceptional $114,586 |
| Mongolians | 99.8 /100 | #62 | Exceptional $114,553 |
| Immigrants | Pakistan | 99.8 /100 | #63 | Exceptional $114,406 |
| Immigrants | Scotland | 99.7 /100 | #64 | Exceptional $114,392 |
| Egyptians | 99.7 /100 | #65 | Exceptional $114,119 |
| Paraguayans | 99.7 /100 | #66 | Exceptional $114,016 |
| Immigrants | Spain | 99.7 /100 | #67 | Exceptional $113,815 |
| Immigrants | Serbia | 99.6 /100 | #68 | Exceptional $113,463 |
| Immigrants | Bulgaria | 99.6 /100 | #69 | Exceptional $113,461 |
| Immigrants | Romania | 99.6 /100 | #70 | Exceptional $113,434 |
| South Africans | 99.5 /100 | #71 | Exceptional $113,229 |
| Afghans | 99.5 /100 | #72 | Exceptional $112,971 |
| Laotians | 99.5 /100 | #73 | Exceptional $112,859 |