Slovak vs Immigrants from Cameroon Median Family Income
COMPARE
Slovak
Immigrants from Cameroon
Median Family Income
Median Family Income Comparison
Slovaks
Immigrants from Cameroon
$103,729
MEDIAN FAMILY INCOME
63.1/ 100
METRIC RATING
165th/ 347
METRIC RANK
$100,289
MEDIAN FAMILY INCOME
22.8/ 100
METRIC RATING
197th/ 347
METRIC RANK
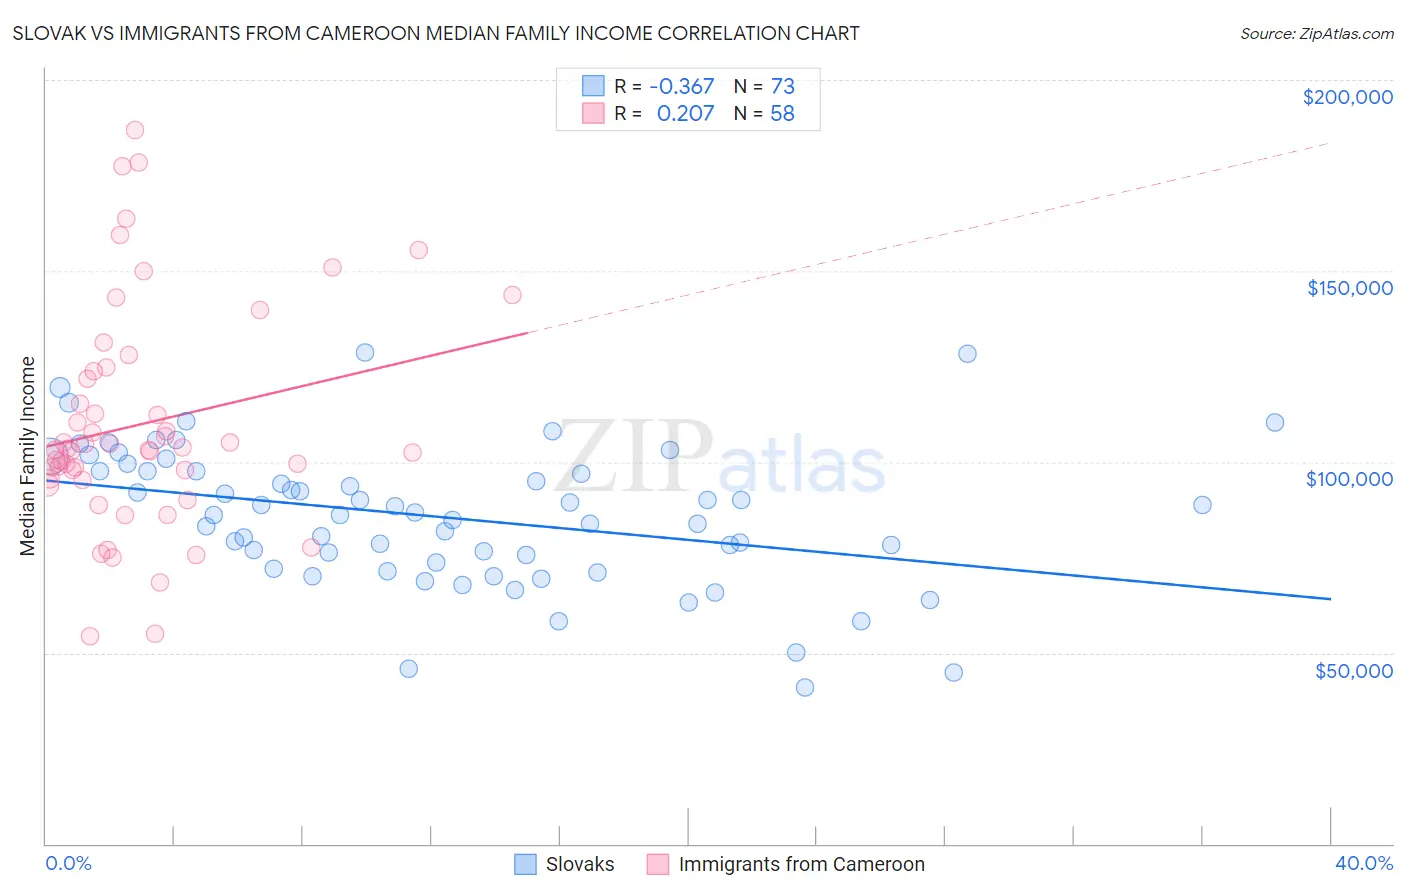
Slovak vs Immigrants from Cameroon Median Family Income Correlation Chart
The statistical analysis conducted on geographies consisting of 397,537,551 people shows a mild negative correlation between the proportion of Slovaks and median family income in the United States with a correlation coefficient (R) of -0.367 and weighted average of $103,729. Similarly, the statistical analysis conducted on geographies consisting of 130,726,829 people shows a weak positive correlation between the proportion of Immigrants from Cameroon and median family income in the United States with a correlation coefficient (R) of 0.207 and weighted average of $100,289, a difference of 3.4%.
Median Family Income Correlation Summary
| Measurement | Slovak | Immigrants from Cameroon |
| Minimum | $40,809 | $54,178 |
| Maximum | $128,732 | $186,802 |
| Range | $87,923 | $132,624 |
| Mean | $85,532 | $109,949 |
| Median | $86,184 | $103,317 |
| Interquartile 25% (IQ1) | $72,785 | $95,592 |
| Interquartile 75% (IQ3) | $97,619 | $123,784 |
| Interquartile Range (IQR) | $24,833 | $28,192 |
| Standard Deviation (Sample) | $18,291 | $29,032 |
| Standard Deviation (Population) | $18,165 | $28,780 |
Similar Demographics by Median Family Income
Demographics Similar to Slovaks by Median Family Income
In terms of median family income, the demographic groups most similar to Slovaks are English ($103,684, a difference of 0.040%), South American Indian ($103,624, a difference of 0.10%), Sierra Leonean ($103,859, a difference of 0.13%), Immigrants from Peru ($103,534, a difference of 0.19%), and Immigrants from Sierra Leone ($103,990, a difference of 0.25%).
| Demographics | Rating | Rank | Median Family Income |
| Scandinavians | 70.8 /100 | #158 | Good $104,410 |
| Swiss | 70.7 /100 | #159 | Good $104,396 |
| Scottish | 69.5 /100 | #160 | Good $104,288 |
| Icelanders | 69.4 /100 | #161 | Good $104,282 |
| Immigrants | Sierra Leone | 66.2 /100 | #162 | Good $103,990 |
| Costa Ricans | 66.2 /100 | #163 | Good $103,989 |
| Sierra Leoneans | 64.7 /100 | #164 | Good $103,859 |
| Slovaks | 63.1 /100 | #165 | Good $103,729 |
| English | 62.6 /100 | #166 | Good $103,684 |
| South American Indians | 61.9 /100 | #167 | Good $103,624 |
| Immigrants | Peru | 60.8 /100 | #168 | Good $103,534 |
| Czechoslovakians | 57.6 /100 | #169 | Average $103,273 |
| Immigrants | Uzbekistan | 56.6 /100 | #170 | Average $103,197 |
| Alsatians | 54.3 /100 | #171 | Average $103,010 |
| Immigrants | Eritrea | 51.9 /100 | #172 | Average $102,823 |
Demographics Similar to Immigrants from Cameroon by Median Family Income
In terms of median family income, the demographic groups most similar to Immigrants from Cameroon are Immigrants from Africa ($100,256, a difference of 0.030%), Samoan ($100,344, a difference of 0.060%), Immigrants from South America ($100,414, a difference of 0.12%), Yugoslavian ($100,119, a difference of 0.17%), and Spanish ($99,977, a difference of 0.31%).
| Demographics | Rating | Rank | Median Family Income |
| Immigrants | Immigrants | 29.4 /100 | #190 | Fair $100,962 |
| Colombians | 27.2 /100 | #191 | Fair $100,750 |
| Immigrants | Kenya | 26.5 /100 | #192 | Fair $100,679 |
| Iraqis | 26.3 /100 | #193 | Fair $100,658 |
| Uruguayans | 26.3 /100 | #194 | Fair $100,656 |
| Immigrants | South America | 23.9 /100 | #195 | Fair $100,414 |
| Samoans | 23.3 /100 | #196 | Fair $100,344 |
| Immigrants | Cameroon | 22.8 /100 | #197 | Fair $100,289 |
| Immigrants | Africa | 22.5 /100 | #198 | Fair $100,256 |
| Yugoslavians | 21.3 /100 | #199 | Fair $100,119 |
| Spanish | 20.1 /100 | #200 | Fair $99,977 |
| Immigrants | Thailand | 19.0 /100 | #201 | Poor $99,840 |
| Whites/Caucasians | 18.7 /100 | #202 | Poor $99,800 |
| Scotch-Irish | 17.1 /100 | #203 | Poor $99,591 |
| Ghanaians | 12.6 /100 | #204 | Poor $98,877 |