Scottish vs Greek Median Female Earnings
COMPARE
Scottish
Greek
Median Female Earnings
Median Female Earnings Comparison
Scottish
Greeks
$38,397
MEDIAN FEMALE EARNINGS
6.3/ 100
METRIC RATING
227th/ 347
METRIC RANK
$42,336
MEDIAN FEMALE EARNINGS
99.6/ 100
METRIC RATING
79th/ 347
METRIC RANK
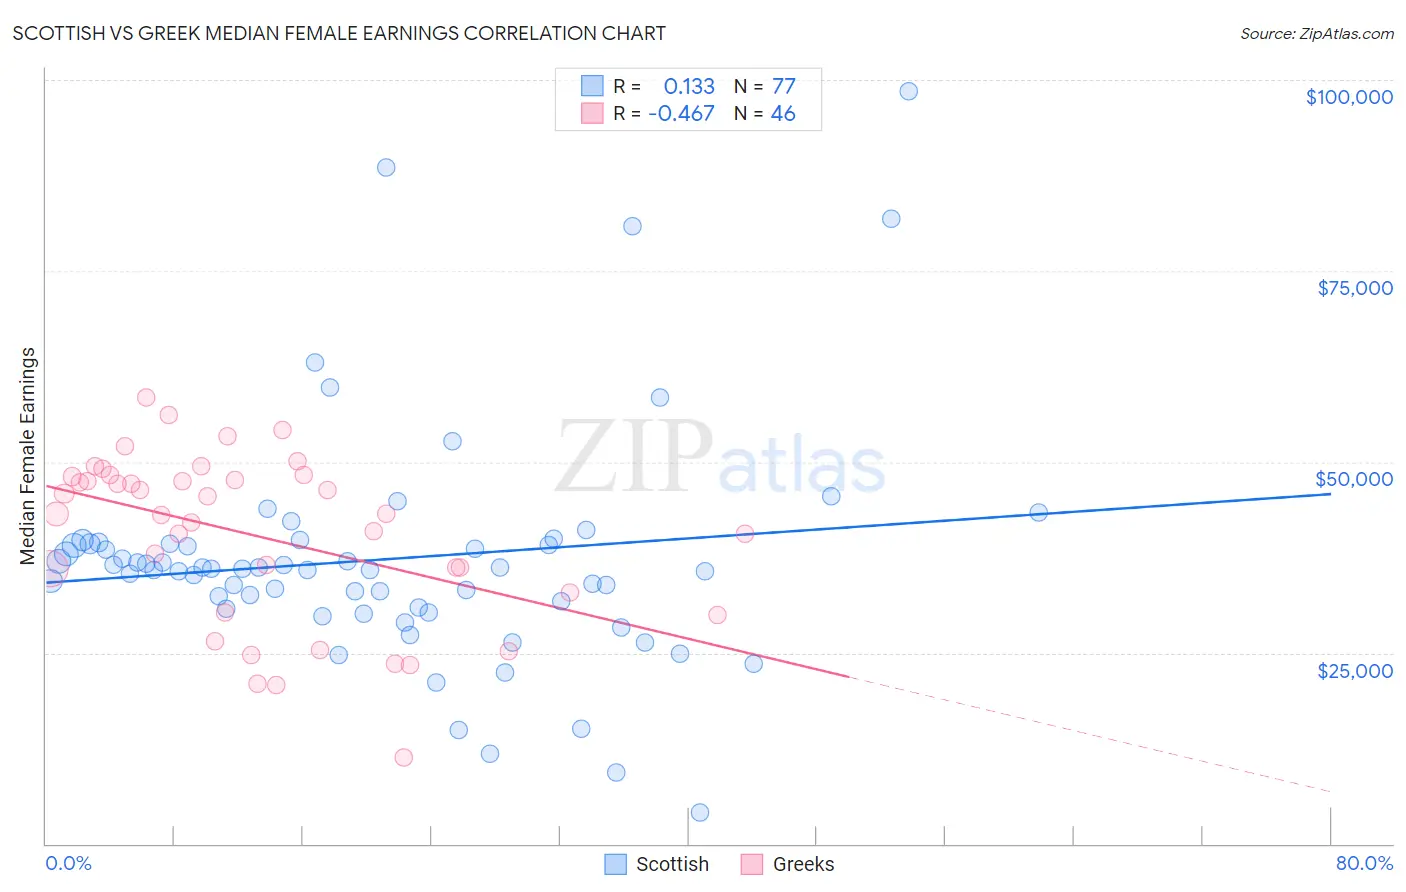
Scottish vs Greek Median Female Earnings Correlation Chart
The statistical analysis conducted on geographies consisting of 565,316,168 people shows a poor positive correlation between the proportion of Scottish and median female earnings in the United States with a correlation coefficient (R) of 0.133 and weighted average of $38,397. Similarly, the statistical analysis conducted on geographies consisting of 482,348,495 people shows a moderate negative correlation between the proportion of Greeks and median female earnings in the United States with a correlation coefficient (R) of -0.467 and weighted average of $42,336, a difference of 10.3%.
Median Female Earnings Correlation Summary
| Measurement | Scottish | Greek |
| Minimum | $4,115 | $11,250 |
| Maximum | $98,472 | $58,379 |
| Range | $94,357 | $47,129 |
| Mean | $37,218 | $40,351 |
| Median | $35,990 | $43,165 |
| Interquartile 25% (IQ1) | $30,914 | $32,889 |
| Interquartile 75% (IQ3) | $39,333 | $48,068 |
| Interquartile Range (IQR) | $8,419 | $15,179 |
| Standard Deviation (Sample) | $15,319 | $10,999 |
| Standard Deviation (Population) | $15,219 | $10,879 |
Similar Demographics by Median Female Earnings
Demographics Similar to Scottish by Median Female Earnings
In terms of median female earnings, the demographic groups most similar to Scottish are Subsaharan African ($38,391, a difference of 0.020%), Belgian ($38,382, a difference of 0.040%), French Canadian ($38,436, a difference of 0.10%), Basque ($38,352, a difference of 0.12%), and French ($38,457, a difference of 0.15%).
| Demographics | Rating | Rank | Median Female Earnings |
| Yugoslavians | 8.8 /100 | #220 | Tragic $38,573 |
| Immigrants | Azores | 8.8 /100 | #221 | Tragic $38,573 |
| Japanese | 8.1 /100 | #222 | Tragic $38,528 |
| Immigrants | Sudan | 7.8 /100 | #223 | Tragic $38,511 |
| Native Hawaiians | 7.1 /100 | #224 | Tragic $38,461 |
| French | 7.0 /100 | #225 | Tragic $38,457 |
| French Canadians | 6.8 /100 | #226 | Tragic $38,436 |
| Scottish | 6.3 /100 | #227 | Tragic $38,397 |
| Sub-Saharan Africans | 6.2 /100 | #228 | Tragic $38,391 |
| Belgians | 6.1 /100 | #229 | Tragic $38,382 |
| Basques | 5.7 /100 | #230 | Tragic $38,352 |
| Somalis | 5.5 /100 | #231 | Tragic $38,333 |
| Scandinavians | 5.2 /100 | #232 | Tragic $38,306 |
| Tongans | 5.1 /100 | #233 | Tragic $38,288 |
| Celtics | 5.0 /100 | #234 | Tragic $38,283 |
Demographics Similar to Greeks by Median Female Earnings
In terms of median female earnings, the demographic groups most similar to Greeks are Immigrants from Moldova ($42,304, a difference of 0.080%), Immigrants from Albania ($42,388, a difference of 0.12%), Immigrants from Kazakhstan ($42,386, a difference of 0.12%), Immigrants from Southern Europe ($42,275, a difference of 0.15%), and Immigrants from Morocco ($42,229, a difference of 0.25%).
| Demographics | Rating | Rank | Median Female Earnings |
| Albanians | 99.8 /100 | #72 | Exceptional $42,584 |
| Mongolians | 99.7 /100 | #73 | Exceptional $42,542 |
| Immigrants | South Africa | 99.7 /100 | #74 | Exceptional $42,508 |
| New Zealanders | 99.7 /100 | #75 | Exceptional $42,446 |
| Immigrants | Italy | 99.7 /100 | #76 | Exceptional $42,446 |
| Immigrants | Albania | 99.6 /100 | #77 | Exceptional $42,388 |
| Immigrants | Kazakhstan | 99.6 /100 | #78 | Exceptional $42,386 |
| Greeks | 99.6 /100 | #79 | Exceptional $42,336 |
| Immigrants | Moldova | 99.6 /100 | #80 | Exceptional $42,304 |
| Immigrants | Southern Europe | 99.5 /100 | #81 | Exceptional $42,275 |
| Immigrants | Morocco | 99.5 /100 | #82 | Exceptional $42,229 |
| Immigrants | Sierra Leone | 99.5 /100 | #83 | Exceptional $42,214 |
| Armenians | 99.5 /100 | #84 | Exceptional $42,212 |
| Laotians | 99.4 /100 | #85 | Exceptional $42,133 |
| Immigrants | St. Vincent and the Grenadines | 99.3 /100 | #86 | Exceptional $42,108 |