Paraguayan vs Greek Median Female Earnings
COMPARE
Paraguayan
Greek
Median Female Earnings
Median Female Earnings Comparison
Paraguayans
Greeks
$43,173
MEDIAN FEMALE EARNINGS
99.9/ 100
METRIC RATING
58th/ 347
METRIC RANK
$42,336
MEDIAN FEMALE EARNINGS
99.6/ 100
METRIC RATING
79th/ 347
METRIC RANK
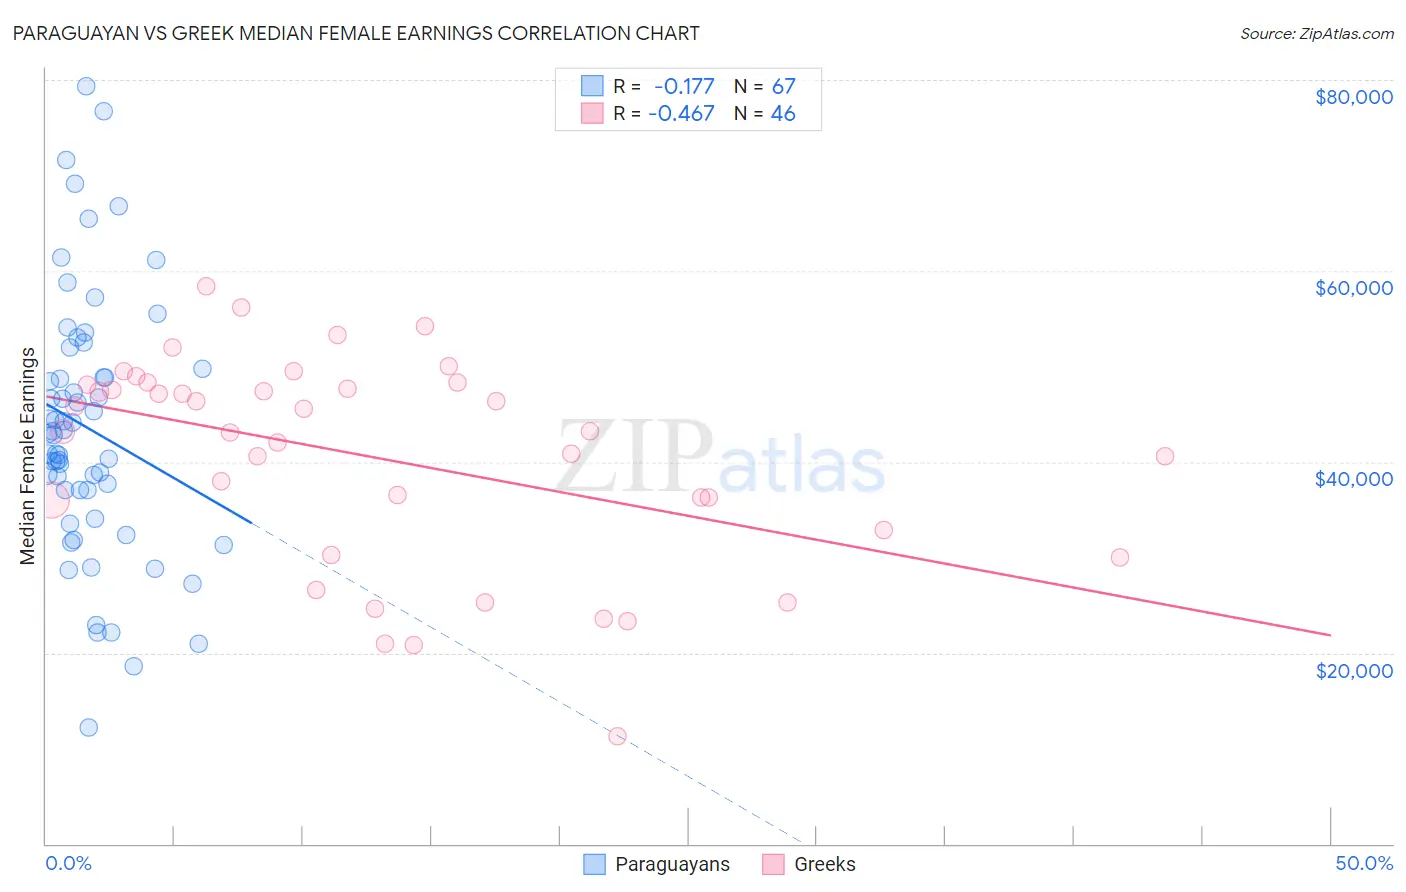
Paraguayan vs Greek Median Female Earnings Correlation Chart
The statistical analysis conducted on geographies consisting of 95,111,705 people shows a poor negative correlation between the proportion of Paraguayans and median female earnings in the United States with a correlation coefficient (R) of -0.177 and weighted average of $43,173. Similarly, the statistical analysis conducted on geographies consisting of 482,348,495 people shows a moderate negative correlation between the proportion of Greeks and median female earnings in the United States with a correlation coefficient (R) of -0.467 and weighted average of $42,336, a difference of 2.0%.
Median Female Earnings Correlation Summary
| Measurement | Paraguayan | Greek |
| Minimum | $12,152 | $11,250 |
| Maximum | $79,410 | $58,379 |
| Range | $67,258 | $47,129 |
| Mean | $43,505 | $40,351 |
| Median | $42,896 | $43,165 |
| Interquartile 25% (IQ1) | $37,010 | $32,889 |
| Interquartile 75% (IQ3) | $49,789 | $48,068 |
| Interquartile Range (IQR) | $12,779 | $15,179 |
| Standard Deviation (Sample) | $13,576 | $10,999 |
| Standard Deviation (Population) | $13,475 | $10,879 |
Similar Demographics by Median Female Earnings
Demographics Similar to Paraguayans by Median Female Earnings
In terms of median female earnings, the demographic groups most similar to Paraguayans are Ethiopian ($43,243, a difference of 0.16%), Estonian ($43,106, a difference of 0.16%), Immigrants from Latvia ($43,099, a difference of 0.17%), Immigrants from Croatia ($43,258, a difference of 0.20%), and Immigrants from Bulgaria ($43,085, a difference of 0.20%).
| Demographics | Rating | Rank | Median Female Earnings |
| Maltese | 100.0 /100 | #51 | Exceptional $43,357 |
| Immigrants | Lithuania | 99.9 /100 | #52 | Exceptional $43,317 |
| Immigrants | Eastern Europe | 99.9 /100 | #53 | Exceptional $43,309 |
| Australians | 99.9 /100 | #54 | Exceptional $43,308 |
| Egyptians | 99.9 /100 | #55 | Exceptional $43,305 |
| Immigrants | Croatia | 99.9 /100 | #56 | Exceptional $43,258 |
| Ethiopians | 99.9 /100 | #57 | Exceptional $43,243 |
| Paraguayans | 99.9 /100 | #58 | Exceptional $43,173 |
| Estonians | 99.9 /100 | #59 | Exceptional $43,106 |
| Immigrants | Latvia | 99.9 /100 | #60 | Exceptional $43,099 |
| Immigrants | Bulgaria | 99.9 /100 | #61 | Exceptional $43,085 |
| Afghans | 99.9 /100 | #62 | Exceptional $43,077 |
| Immigrants | Ukraine | 99.9 /100 | #63 | Exceptional $43,069 |
| Immigrants | Pakistan | 99.9 /100 | #64 | Exceptional $43,052 |
| Sierra Leoneans | 99.9 /100 | #65 | Exceptional $42,868 |
Demographics Similar to Greeks by Median Female Earnings
In terms of median female earnings, the demographic groups most similar to Greeks are Immigrants from Moldova ($42,304, a difference of 0.080%), Immigrants from Albania ($42,388, a difference of 0.12%), Immigrants from Kazakhstan ($42,386, a difference of 0.12%), Immigrants from Southern Europe ($42,275, a difference of 0.15%), and Immigrants from Morocco ($42,229, a difference of 0.25%).
| Demographics | Rating | Rank | Median Female Earnings |
| Albanians | 99.8 /100 | #72 | Exceptional $42,584 |
| Mongolians | 99.7 /100 | #73 | Exceptional $42,542 |
| Immigrants | South Africa | 99.7 /100 | #74 | Exceptional $42,508 |
| New Zealanders | 99.7 /100 | #75 | Exceptional $42,446 |
| Immigrants | Italy | 99.7 /100 | #76 | Exceptional $42,446 |
| Immigrants | Albania | 99.6 /100 | #77 | Exceptional $42,388 |
| Immigrants | Kazakhstan | 99.6 /100 | #78 | Exceptional $42,386 |
| Greeks | 99.6 /100 | #79 | Exceptional $42,336 |
| Immigrants | Moldova | 99.6 /100 | #80 | Exceptional $42,304 |
| Immigrants | Southern Europe | 99.5 /100 | #81 | Exceptional $42,275 |
| Immigrants | Morocco | 99.5 /100 | #82 | Exceptional $42,229 |
| Immigrants | Sierra Leone | 99.5 /100 | #83 | Exceptional $42,214 |
| Armenians | 99.5 /100 | #84 | Exceptional $42,212 |
| Laotians | 99.4 /100 | #85 | Exceptional $42,133 |
| Immigrants | St. Vincent and the Grenadines | 99.3 /100 | #86 | Exceptional $42,108 |